HAL Id: hal-00317651
https://hal.archives-ouvertes.fr/hal-00317651
Submitted on 23 Sep 2004
HAL is a multi-disciplinary open access
archive for the deposit and dissemination of
sci-entific research documents, whether they are
pub-lished or not. The documents may come from
teaching and research institutions in France or
abroad, or from public or private research centers.
L’archive ouverte pluridisciplinaire HAL, est
destinée au dépôt et à la diffusion de documents
scientifiques de niveau recherche, publiés ou non,
émanant des établissements d’enseignement et de
recherche français ou étrangers, des laboratoires
publics ou privés.
A review of recent MLT studies at low latitudes
B. R. Clemesha
To cite this version:
B. R. Clemesha. A review of recent MLT studies at low latitudes. Annales Geophysicae, European
Geosciences Union, 2004, 22 (9), pp.3261-3275. �hal-00317651�
Annales Geophysicae (2004) 22: 3261–3275 SRef-ID: 1432-0576/ag/2004-22-3261 © European Geosciences Union 2004
Annales
Geophysicae
A review of recent MLT studies at low latitudes
B. R. ClemeshaInstituto Nacional de Pesquisas Espaciais, Ave. dos Astronautas, 1758, S˜ao Jos´e dos Campos, 12227-010 SP, Brazil Received: 12 June 2003 – Revised: 3 February 2004 – Accepted: 11 February 2004 – Published: 23 September 2004 Part of Special Issue “Equatorial and low latitude aeronomy”
Abstract. Recent years have shown a continuing interest
in studies of the mesosphere-lower thermosphere region at low latitudes, with more than 50 papers dealing specifically with this area published over the past 5 years. Experimen-tal ground-based work has been carried out mainly in South America and the Caribbean, India and the Pacific areas. Subjects of interest include gravity waves, tides and plane-tary waves, the temperature structure of the mesopause re-gion, with special reference to temperature inversions and the two-level mesopause, sporadic neutral layers and their relationship with ionized layers, the possible effects of the micrometeoroid influx, and long-term trends in the MLT re-gion. Experimental techniques in use include MF, MST and meteor radar, lidar, airglow (including satellite-borne limb-scanning measurements) and rocket-borne instruments. Air-glow imaging has shown itself to be a particularly useful technique, mainly for studying gravity wave propagation in the MLT region. This paper will present highlights of recent work and will discuss some of the problems which remain to be resolved.
Key words. Atmospheric composition and structure
(Mid-dle atmosphere-composition and chemistry; pressure, den-sity and temperature)
1 Introduction
Our knowledge and understanding of the mesosphere and lower thermosphere has improved considerably during the past decade, although there are still some gaps, especially at low latitudes. Much recent work has been aimed at under-standing the importance of energy and momentum transport by gravity waves, tides and planetary waves, and their inter-action with the mean flow. This work has been carried out on both the experimental and theoretical fronts, and steady progress has been made in its application in GCMs. In this respect much recent experimental work has been aimed at
Correspondence to: B. R. Clemesha
characterizing the various wave processes present in this re-gion of the atmosphere, and measuring and understanding the latitudinal and zonal variations in the mean structure, to-gether with its seasonal variations. This sort of work is neces-sarily global in its approach and, since this review is intended to concentrate on low-latitude aeronomy, it may receive here less emphasis than it really merits. Other subjects which have received attention are chemistry and composition, layer-ing processes, mainly concernlayer-ing sporadic neutral layers and their relationship to ionized layers, mesospheric temperature inversions and, last but not least, long-term trends. In the following paragraphs an attempt will be made to summarize recent progress in some of these areas.
2 Climatology and Structure
2.1 Climatology
Our knowledge of the global structure and climatology of the MLT region has improved dramatically over the past decade. This has been the result of satellite measurements by instru-ments such as HRDI and WINDII on board the UARS satel-lite, and ground-based measurements mainly made by lidar. Unfortunately, there have been few lidar measurements of the atmospheric temperature structure at low latitudes, so our de-tailed knowledge of the low-latitude climatology of the MLT region is not quite so satisfactory. An important advance in our knowledge of the temperature structure of the MLT re-gion in constituted by the two level mesopause concept, first proposed by von Zahn et al. (1996) and subsequently con-firmed by other workers (She and von Zahn, 1998; Berger and von Zahn, 1999; She et al., 2000; Thulasiraman and Nee, 2002). These workers have shown that the mesopause occurs at around either 86 km or 100 km, but rarely in be-tween. The lower level appears to occur only in summer at latitudes above about 23◦. At low latitudes the temperature distribution appears always to be similar in form to the mid-latitude winter profile. This result is consistent with the lidar measurements of Clemesha et al. (1999) and the HRDI data presented by Thulasiraman and Nee (2002).
3262 B. R. Clemesha: A review of recent MLT studies at low latitudes
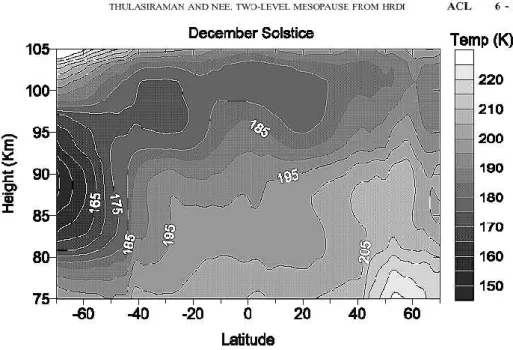
Fig. 1. Solstice temperature maps from the HRDI instrument on board the UARS satellite (after Thulasiraman and Nee, 2002).
Figure 1, taken from Thulasiraman and Nee (2002), shows global temperature maps for the MLT region for the two sol-stices. The lack of seasonal variation in the low-latitude mesopause height can be clearly seen in this figure. Fig-ure 2, based on Na Doppler lidar data from S˜ao Jos´e dos Campos, shows an average winter temperature profile for 23◦S. A detailed study of the seasonal variation in the
low-latitude MLT temperature structure has not yet been pub-lished, although airglow rotational temperatures for limited height ranges have been presented by Takahashi et al. (1994,
1995). Figure 3, from Takahashi et al. (1995), shows the measured annual variation in the rotational temperatures for the OH(9,4) band measured at Cachoeira Paulista (23◦S) and Fortaleza (4◦S), respectively. In this figure the points rep-resent individual nocturnal means and the continuous lines connect the monthly averages. These temperatures, which are believed to refer to a height of around 87±4 km, show a strong semiannual variation at the near-equatorial station, and a weaker variation at 23◦S. In neither case is there any significant annual component. A difficulty in interpreting the
B. R. Clemesha: A review of recent MLT studies at low latitudes 3263
Fig. 2. Comparison between mean temperature profile for 23◦S (SJC) and other profiles (after Clemesha et al., 1999).
3264 B. R. Clemesha: A review of recent MLT studies at low latitudes
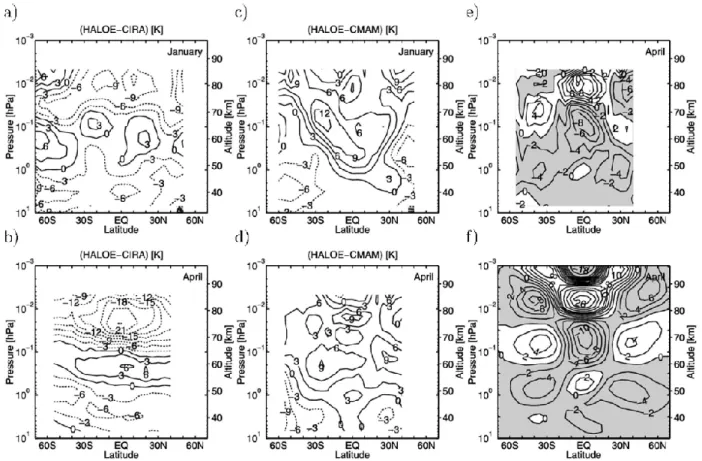
Fig. 4. Comparison between HALOE temperature measurements and the CIRA and CMAM models (after Jonnson et al., 2002).
rotational temperature measurements is, of course, the lack of knowledge of the precise height distribution for the emis-sion. It is also possible that the height of the emission itself shows a seasonal variation, in which case any vertical gradi-ent in temperature would appear as a seasonal variation. It is interesting to note that there appears to be a discrepancy be-tween the ground-based measurements and the satellite mea-surements for low latitudes. Both the OH rotational temper-ature measurements of Takahashi et al. (1995) and the res-onance lidar measurements of Clemesha et al. (1999) show considerably higher temperatures than those measured by the HRDI and HALOE instruments. It may also be relevant that She et al.’s (2000) winter temperatures for 41◦N also appear
to be warmer than those derived from the satellite measure-ments.
Traditional climatological models such as CIRA and MSIS do not reproduce well the temperature structure of the MLT region at low latitudes. Jonnson et al. (2002) have com-pared a climatology derived from the HALOE instrument aboard the UARS satellite with both CIRA86 and the Cana-dian Middle Atmosphere Model (CMAM), and find much better agreement with the latter. At low latitudes the differ-ence between the HALOE upper mesospheric temperatures and CIRA is nearly 25 K in April (see Fig. 4). The existence of data sets such as those from HRDI and HALOE make it possible to update the empirical models, and a new version of CIRA should be available in the near future.
2.2 Layering processes
The MLT region shows various types of fine structure, some of which is not yet well understood. At high latitudes polar mesospheric or noctilucent clouds (PMC/NLC) are believed to consist of ice crystals which form near the mesopause. An interesting aspect of this subject is the possible long-term trend in NLC occurrence which could be the result of in-creasing methane in the atmosphere. The absence of PMC at low latitudes is probably due both to a lack of sufficient water vapor and insufficiently low temperatures. Other types of layers do occur at low latitudes, of course, the best known of which are the sporadic-E-ion-layers (Es) believed to con-sist of metallic ions of meteoric origin, concentrated into a thin layer by the effect of wind-shear in the presence of the Earth’s magnetic field (Whitehead, 1989). Less well un-derstood are the thin layers of meteoric metals known as sporadic neutral layers (Ns). These were first observed in sodium by Clemesha et al. (1978), and have subsequently been detected in other metals such as iron, calcium, potas-sium and magnepotas-sium. The layers, which are detected by res-onance lidar, appear to form much more frequently at low and high latitudes than at mid-latitudes. A number of dif-ferent mechanisms have been suggested for the formation of these layers, but the neutralization of wind-shear con-centrated metallic ion-layers appears to be the most plau-sible. In this respect the modeling studies and laboratory
B. R. Clemesha: A review of recent MLT studies at low latitudes 3265
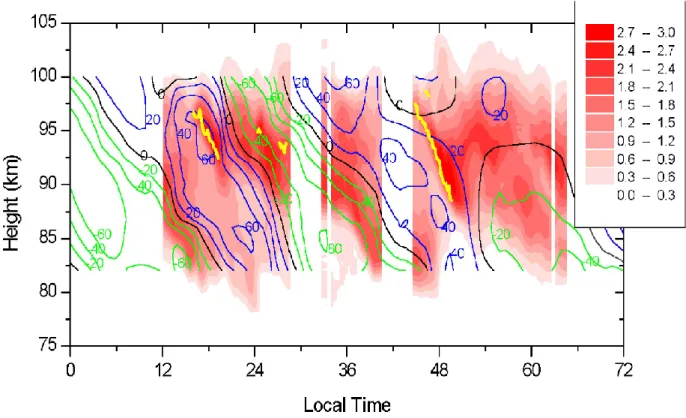
Fig. 5. Na density and meridional winds from 12:00 LT on 12 July to 16:36 LT on 14 July 1999. Density units are 109 m−3. The yellow lines mark Ns-layers. Winds are shown in units of m, s−1: positive contours are shown in blue, negative in green, and the zero wind contour in black (after Clemesha et al., 2001).
3266 B. R. Clemesha: A review of recent MLT studies at low latitudes
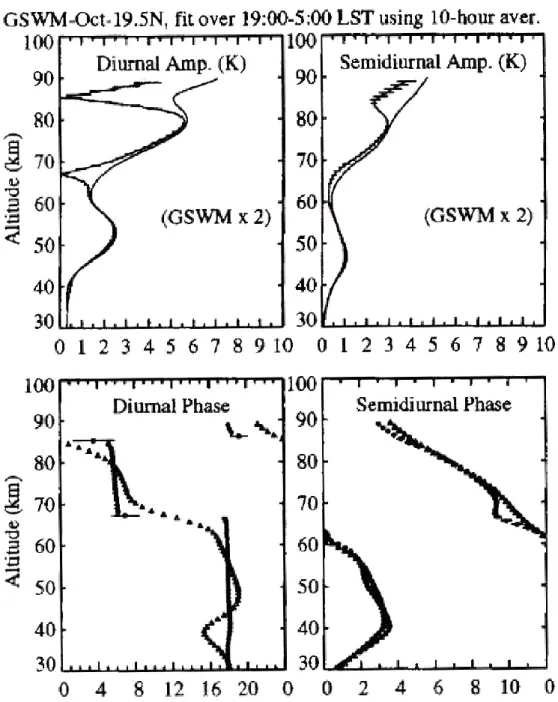
Fig. 7. Comparison between temperature tides observed by Rayleigh lidar at Mauna Loa (19.5◦N) with the GSWM model (after Leblanc et al., 1999).
measurements of the relevant rate coefficients by John Plane and his coworkers (see, for example, Cox et al., 2001) have been most important. One of the reasons for believing that Ns-layers are produced by neutralization of Es-layers is the close, although not one-to-one, correlation of Ns occurrence with that of Es. It has also been observed that Ns-layers gen-erally move downward with time, and the downward veloc-ity decreases with height (Clemesha et al., 1999). This is consistent with the wind-shear theory for sporadic-E, where increasing ion-neutral collision frequency at lower heights causes the ion-layer to lag behind the downward motion of the tidal wind nodes. An example of downward motion in Ns-layers is shown in Fig. 5 (taken from Clemesha et al.,
2001). This figure shows that the downward propagation of the Ns-layers accompanies the phase propagation of the tidal winds, as would be expected from the wind-shear the-ory. A problem with ion-layer neutralization theory for spo-radic sodium layers is that rocket-borne mass spectrometer measurements of Na+ions have generally shown very low concentrations. The number of reliable measurements of this sort, however, is insufficient for any firm conclusions to be made on this aspect of the problem.
Recently, a new type of structure has been observed in the atmospheric sodium layer over Arecibo, Puerto Rico, by Kane et al. (2001). This structure, which appears to occur mainly at and above 100 km, shows complex cusp-like forms,
B. R. Clemesha: A review of recent MLT studies at low latitudes 3267
Fig. 8. Comparison between diurnal and semidiurnal tidal wind components for Cachoeira Paulista (23◦S). Broken lines: 1999 to 2000; solid line: 2000 to 2001; line with points: GSWM (after Batista et al., 2002).
and does not appear to be related to the more frequently re-ported Ns-layers. Pimenta et al. (2002) refer to these as C-structures. An example of this type of structure, taken from Kane et al. (2001), is shown in Fig. 6. The Puerto Rico work-ers have suggested that C-structures might be the result of the billows of an overturning wind, however, it is not at all clear that this is really the case. Although the structures admit-tedly have the appearance of an overturning wave motion, it must be remembered that the lidar measures a time-height history of the sodium concentration, not a two-dimensional spatial distribution. Structures of this sort have not been re-ported from mid- or high-latitude locations, but this could be that they have simply not been noticed. After Kane and his coworkers published their 2001 paper we searched our data from S˜ao Jos´e dos Campos (23◦S) and found that they do occasionally occur at this location (see Pimenta et al., 2002). The understanding of both conventional Ns-layers and C-structures would greatly benefit from measurements of the horizontal structure in these layers. There exist lidars capa-ble of this sort of measurement, and it is to be hoped that such a study will be carried out in the not too distant future.
3 MLT Dynamics
3.1 Tides
Atmospheric tides can be measured by a number of tech-niques, including lidar, meteor radar, and MF radar. The HRDI and WINDII instruments on board UARS have been used to determine the temperature component of tidal os-cillations. One puzzling aspect of the temperature tides is that the measured amplitudes for low-latitude locations are
typically twice those predicted by models. Figure 7, taken from Leblanc et al. (1999), shows an example of this. Tides derived from Rayleigh lidar measurements at Mauna Loa (19.5◦N) are compared with the Global Scale Wave Model (Hagan et al., 1995, 1999, 2001). The vertical profiles of both amplitude and phase are in very good agreement with the model output, but only if the amplitude of the modeled tide is multiplied by a factor of 2. A similar discrepancy was found by Hecht et al. (1998) with respect to a comparison of sodium Doppler lidar measurements made at the latitude of Hawaii (19.5◦N) with the TIME-GCM (Roble and
Rid-ley, 1994). On the other hand, Shepherd et al. (1998) find WINDI temperature measurements generally consistent with the TIME-GCM.
Measurements of tidal winds have been made at low lat-itudes by MF and meteor radar. Batista et al. (2002) have compared meteor radar measurements of diurnal and semid-iurnal tides made at Cachoeira Paulista (23◦S) with the GSWM predictions. The results of this comparison are shown in Figs. 8 and 9. Figure 8 shows the average mea-sured ratios between the diurnal and semidiurnal tides for the periods April 1999 to March 2000 and April 2000 to March 2001, and compares these to the GSWM. Although there is some agreement, there are also some striking discrepancies. In particular, the predicted ratios of the diurnal to semidi-urnal tidal amplitudes, mainly for the zonal wind, are much larger than the measured ones (see Fig. 8). This is true for the zonal wind above 82.5 km and for the meridional wind be-low 87 km. There is also an abrupt change in both phase and amplitude in November/December, especially in the diurnal zonal wind, not predicted by the GSWM. This can be seen in Fig. 9, which shows the annual variations of the amplitude
3268 B. R. Clemesha: A review of recent MLT studies at low latitudes
Fig. 9. Amplitude and phase of the diurnal zonal wind measured at Cachoeira Paulista (23◦S), compared with GSWM00 (after Batista et al., 2002).
and phase of the zonal component of the diurnal tide, and a comparison with the GSMW00 model. It is clear that consid-erable discrepancies remain between models and experiment. Part of this difference could be due to the fact that the model predictions are for zonal averages, and we do not, as of yet, have enough experimental observations to fully characterize longitudinal variations in the tides.
3.2 Gravity waves
An understanding of the importance of internal gravity waves as a mechanism for transporting energy and momentum from the lower atmosphere to the MLT region, allied with the development of improved techniques for measuring gravity waves in the mesopause region, has resulted in increased in-terest in this subject over the past few years. Source char-acterization, mainly in terms of orographic forcing and
tro-pospheric convective systems, is an important although, as of yet, little explored subject. At low latitudes it is gener-ally assumed that tropical convective systems play a major role. Also important in this respect is the filtering of upward propagating gravity waves by tropospheric and stratospheric winds. All these effects need to be included in GCMs but, as of yet, their inclusion is implemented only in terms of empir-ical models.
Techniques for observing gravity waves in the MLT re-gion include lidar, airglow imaging and MF radar. The velopment of large area, high quantum efficiency CCD de-tectors has led to major advances in the imaging of airglow emissions over the past decade. Since these emissions are modulated by the passage of gravity waves, they provide an excellent technique for determining horizontal wavelengths, periods and direction of propagation of the latter. The emis-sions used are mainly the near-infrared hydroxyl bands, the
B. R. Clemesha: A review of recent MLT studies at low latitudes 3269
Fig. 10. Seasonal variations in the direction of propagation of gravity waves observed in the OH nightglow at 23◦S, believed to be caused by wind filtering (after Medeiros et al., 2002).
O2 atmospheric bands and the OI 557 nm atomic oxygen
emission. Since these emissions come from slightly differ-ent heights, it is possible to derive some information on the height structure of the waves, although lidar has better capa-bilities in this respect. The main advantage of airglow imag-ing is, however, the comparative simplicity and reliability of this passive technique.
The filtering of gravity waves by winds has been investi-gated experimentally by Medeiros et al. (2002), who used imaging measurements of the near-infrared airglow emis-sions from around 87 km, to characterize the propagation di-rection of short period gravity waves, observed at 23◦S, as a function of season. They found a strong seasonal variation in the predominant propagation direction, which they relate to winds at lower levels. Using the model winds from Horizon-tal Winds Model – HWM93 (Hedin, 1996) they show the ex-istence of critical blocking levels coherent with the observed seasonal variation in GW propagation direction. The results of Medeiros et al.’s work are summarised in Fig. 10. From this figure it can be seen that their data is fully consistent with complete blocking of westerly propagation in the sum-mer, and very considerable blocking of easterly propagation in winter. Considering that the winds are derived from an empirical model, the agreement is remarkably good.
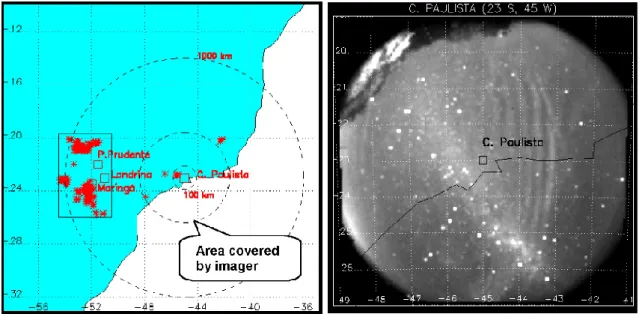
With respect to the generation of GW by convective pro-cesses it is clear that this is most likely to occur at low lat-itudes during strong tropical storms. There is some exper-imental evidence of this but little in the way of systematic studies has been done. An example is given in Fig. 11 (Taka-hashi, private communication), showing gravity waves de-tected in the OH airglow by an imaging photometer, appar-ently related to tropical storm sources located approximately 900 km to the west. It is certainly to be expected that gravity waves should be generated by such a mechanism. Walter-scheid et al. (2001) have modelled the generation of small-scale GW by deep tropical convection and show that the waves could propagate several thousand km via ducting pro-cesses. In general, for the low-latitude MLT region, it seems that theoretical modelling is ahead of experimental studies, and there is an urgent need for coordinated observations ca-pable of linking the occurrence of GW with potential sources. In this respect it should be pointed out that a surprisingly large number of MF radars operating at low-latitude sites exist, including Hawaii, Puerto Rico, Ascension Island, In-donesia, India and Christmas Island, so it is to be expected that the required data should become available in the not too distant future.
3270 B. R. Clemesha: A review of recent MLT studies at low latitudes
Fig. 11. The left-hand panel shows the location of the airglow imager and tropical storms (detected via lightning strikes), and the right-hand
panel shows the GW-modulated airglow emission (Medeiros, personal communication).
Fig. 12. Two- and 3.5-day waves seen in airglow emissions observed at S˜ao Jo˜ao do Cariri (6◦S) (Takahashi, personal communication).
3.3 Planetary waves
It is clear that planetary waves make a major contribution to the winds in the MLT region, but it is not yet clear to what ex-tent such waves might be generated in situ, or whether their main source is in the troposphere. By their very nature, plan-etary waves need to be studied on a global scale, and are thus not specifically pertinent to this review. For this reason we will restrict ourselves to showing a few recent
observa-tional results for low latitudes. Figure 12 shows the annual variation in occurrence of 2.5- and 3.5-day waves observed in airglow measured at S˜ao Jo˜ao do Cariri (6◦S). The 2-day wave is strongest in late spring and summer, whereas the 3.5-day wave is also present in winter. Figure 13, from Batista et al. (2002), shows the meridional wind spectrum at a height of 90 km measured by meteor radar at S˜ao Jos´e dos Cam-pos (23◦S) over a period of nearly 3 years. A strong 2-day
B. R. Clemesha: A review of recent MLT studies at low latitudes 3271
Fig. 13. Spectrum of the meridional wind measured by meteor radar at Cachoeira Paulista (23◦S) between April 1999 and February 2002 (after Batista et al., 2002).
planetary wave can be seen to occur between December and April of each year. It is interesting to note that the 2-day wave is at least as strong as the semidiurnal tide, and that the appearance of the 2-day wave is preceded by a sharp mini-mum in the diurnal tidal amplitude, which occurs in Novem-ber/December each year.
4 Long-term change
The long-term increases known to be occurring in the con-centration of several greenhouse gases, most notably CO2
and methane, are expected to cause a cooling of the upper at-mosphere. Model predictions, mostly based on the doubled CO2scenario, differ in the details of the height dependence
of the cooling trend. One of the earliest studies of this sort, by Roble and Dickinson (1989), found a temperature decrease of 15 K at 50 km and more than 50 K at 400 km. In recent years, a number of workers have developed more detailed at-mospheric models, allowing predictions to be made for the effect of increased greenhouse gas concentrations. Brasseur et al. (1990) presented a chemical-dynamical-radiative model which includes Rossby wave absorption and gravity wave breaking. For the doubled CO2scenario they found
maxi-mum cooling at around 50 km, with temperature changes be-tween −16 K at the winter pole to 8 K at the equator. This model gave a small increase in temperature below 20 km, and zero effect at 70 km. Akmaev and Fomichev (2000) have modeled the effects of the increase in CO2 known to have
occurred over the past 3–4 decades. For a change in CO2
concentration from 331 to 360 ppm, they found temperature
changes going from 0 at 20 km to about −10 K at 180 km. The trend did not increase monotonically with height, and was close to zero at 120 km. The trend modeled by Ak-maev and Fomichev (2000) provides a convenient basis for comparison with measured trends. Portmann et al. (1995) studied the effects of including dynamical feedbacks in the Garcia and Solomon (1985) two-dimensional model. They found that such feedbacks have a major effect, especially at the summer pole, where the doubled-CO2 scenario
pro-duced net heating of about 14 K without feedbacks, but a cooling of around 6 K with. Portmann et al. obtained typical trends, with dynamical feedbacks included, of 0 K at 20 km to −25 K at 110 km. The wide range in trends predicted by the various models is indicative of the comparatively primi-tive state of the art.
A number of workers have attempted to detect a long-term trend in experimental data pertaining to the mesosphere and lower thermosphere. Rocket measurements, for exam-ple, made over a period of around 30 years, have been ana-lyzed by various groups (Kokin and Lysenko, 1994; Keckhut et al., 1999; Dunkerton et al., 1998; L¨ubken et al., 2000). Most of these studies were for middle and high latitudes, but the measurements made at Thumba (Kokin and Lysenko, 1994; Beig and Fadnavis, 2001) are for 8◦N, and are thus relevant to this review. The trend derived by Beig and Fad-navis (2001), shown in Fig. 14, varies between 0 at 15 km to about −6 K/decade at 70 km. Most of the analyses have shown similar negative trends, but the reliability of the mea-surements is questionable in view of calibration problems and technical changes which occurred within the time
se-3272 B. R. Clemesha: A review of recent MLT studies at low latitudes
Fig. 14. Temperature trend for 8◦N based on rocketsonde data obtained between 1971 and 1993 (after Beig and Fadnavis, 2001).
ries. Other studies have been based on satellite radiometer measurements (Aikin et al., 1991), lidar (Aikin et al., 1991; Keckhut et al., 1995, 2001), the height of radio wave reflec-tion (Bremer, 1992; Jarvis, 1998; Taubenheim, 1997) and airglow measurements of rotational temperature (Golitsyn et al., 1996; Bittner and Offermann, 2000). Most, although not all, of these studies, which are all for middle or high latitudes, have shown decreasing temperatures in the mesosphere and thermosphere.
Eleven years ago we published a paper (Clemesha et al., 1992) which demonstrated the existence of a statistically sig-nificant long-term trend in the centroid height of the atmo-spheric sodium layer measured by a sodium lidar operating at
S˜ao Jos´e dos Campos (46◦W, 23◦S). We pointed out that the decrease in the centroid height, observed from 1972 to 1986, could be interpreted as evidence for a decrease in the height of isobaric levels in the atmosphere, resulting from global cooling. In a later paper (Clemesha et al., 1997), we ana-lyzed an extended data set, going up to 1994. The new anal-ysis continued to show a negative trend (although somewhat reduced in magnitude), together with a possible solar cycle variation. This study showed, however, that the decrease in height of the centroid did not result from a simple lowering of the layer, but involved a change in its shape, which we suggested might be the result of a change in the phase of the solar diurnal tide. We have recently re-analyzed our sodium
B. R. Clemesha: A review of recent MLT studies at low latitudes 3273
Fig. 15. Average Na profiles for 1972–1986 (closed circles) and 1987–2001 (open circles), respectively, measured at S˜ao Jos´e dos Campos
(23◦S) (after Clemesha et al., 2002).
data, including observations made up to the end of 2001, and find that over the past 30 years there has been no significant net linear long-term trend (Clemesha et al., 2002). This result is illustrated in Fig. 15, where the mean vertical distribution of sodium measured between 1972 and 1986 is compared with the mean profile for 1987 to 2001. There exist no other relevant long-term MLT data series for low latitudes, but it is interesting to note that the most reliable long-term series available for mid and high latitudes also show no net trend. L¨ubken (2000) found no significant difference between tem-perature profiles made by the rocket-grenade technique in the sixties and recent data from falling spheres. Bittner et al. (2000) have measured OH rotational temperature over a period of 13 years, using a carefully calibrated grating spec-trometer, and also find no linear trend. It should be noted that both of these techniques are reliable, neither involving diffi-cult absolute calibration problems. We must conclude that, at all latitudes, the reality of the predicted long-term temper-ature trend in the MLT region remains an open question.
5 Conclusions
Over the past decade significant advances have been made in our knowledge and understanding of the low-latitude MLT region. On the experimental front these advances have come from both local ground-based measurements and from global satellite-borne experiments. On the theoretical side, steady
progress has been made in understanding the behavior of the region, especially concerning the role of wave processes in transferring energy and momentum from the lower atmo-sphere to the mesoatmo-sphere-lower thermoatmo-sphere. Discrepan-cies and questions remain in a number of areas. There ap-pears to be a lack of agreement between the satellite mea-surements of the temperature structure in the mesopause re-gion and ground-based observations. On the question of long-term change, a subject of paramount importance, there is conflicting evidence: although numerous studies indi-cate long-term cooling of the MLT region, the most reli-able measurements appear to indicate no change over the past 30 years. Since frequent and accurate measurements of the mesopause temperature structure started only about 10 years ago, it will be some time yet before any definite conclusions can be drawn on this subject.
Acknowledgements. I gratefully acknowledge the financial support
of the Programa de N´ucleos de Excelˆencia – Pronex, the Funda˜ao de Amparo a Pesquisa do Estado de S˜ao Paulo – FAPESP and the Conselho Nacional de Desenvolvimento Cient´ıfico e Tecnol´ogico – CNPq.
Topical Editor U.-P. Hoppe thanks D. K. Chakravarty for his help in evaluating this paper.
3274 B. R. Clemesha: A review of recent MLT studies at low latitudes
References
Aikin, A. C., Chanin, M. L., Nash, J., and Kendig, D. J.: Temper-ature trends in the lower mesosphere, Geophys. Res. Lett., 18, 416–419, 1991.
Akmaev, R. A. and Fomichev, V. I.: A model estimate of cooling in the mesosphere and lower thermosphere due to the CO2increase
over the last 3–4 decades, Geophys. Res. Lett., 27, 2113–2116, 2000.
Batista, P. P., Clemesha, B. R., Tokumoto, A. S., and Lima, L. M.: Meteor radar measurements of the winds in the upper mesosphere-lower thermosphere region over Cachoeira Paulista, Brazil (22.7◦S, 45◦W), Third PSMOS International Symposium on Dynamics and Chemistry of the MLT Region 2002, Foz do Iguac¸u, Brazil, 4–8 October, 2002.
Beig, G. and Fadnavis, S.: In Search of Greenhouse Signals in the Equatorial Middle Atmosphere, Geophys. Res. Lett., 28, 2001. Berger, U. and v. Zahn, U.: The two-level structure of the
mesopause: a model study, J. Geophys. Res., 104, 22 083– 22 094, 1999.
Bittner, M., Offermann, D., and Graef, H. H.: Mesopause tempera-ture variability above a midlatitude station in Europe, J. Geophys. Res., 105, 2045–2058, 2000.
Brasseur, G., Hitchman, M. H., Walters, S., Dymek, M., Falise, E., and Pirre, M.: An interactive chemical dynamical radiative two-dimensional model of the middle atmosphere, J. Geophys. Res., 95, 5639–5656, 1990.
Bremer, J.: Ionospheric trends at mid-latitudes as a possible indica-tor of the atmospheric greenhouse effect, J. Atmos. Terr. Phys., 54, 1505–1512, 1992.
Clemesha, B. R., Simonich, D. M., and Batista, P. P.: A long-term trend in the height of the atmospheric sodium layer: possible evidence for global change, Geophys. Res. Lett., 19, 457–460, 1992.
Clemesha, B. R., Veselovskii, I., Batista, P. P., Jorge, M. P. P. M., and Simonich, D. M.: First mesopause temperature profiles from a fixed southern hemisphere site, Geophys. Res. Lett., 26, 1681– 1684, 1999.
Clemesha, B. R., Batista, P. P., and Simonich, D. M.: An evaluation of the evidence for ion recombination as a source of sporadic neutral layers in the lower thermosphere, Adv. Space Res., 23, (5), 547–556, 1999.
Clemesha, B. R., Batista, P. P., and Simonich, D. M.: Long-term and solar cycle changes in the atmospheric sodium layer, J. Atmos. Terr. Phys., 59, 1673–1678, 1997.
Clemesha, B. R., Batista, P. P., and Simonich, D. M.: Long-term variations in the centroid height of the atmospheric sodium layer, 34th Scientific Assembly of COSPAR, Houston, Texas, USA, 10–19 October, 2002.
Clemesha, B. R., Batista, P. P., and Simonich, D. M.: Simultaneous measurements of meteor winds and sporadic sodium layers in the 80–110 km region, Adv. Space Res., 27, 1679–1684, 2001. Clemesha, B. R., Kirchhoff, V. W. J. H., Simonich, D. M., and
Taka-hashi, H.: Evidence of an Extraterrestrial Source for the Meso-spheric Sodium Layer, Geophys. Res. Lett., 5, 873–876, 1978. Cox, R. M., Self, D. E., and Plane, J. M. C.: A study of the reaction
between NaHCO3and H: Apparent closure on the chemistry of
mesospheric Na, J. Geophys. Res., 106, 1733–1739, 2001. Dunkerton, T. J., Delisi, D. P., and Baldwin, M. P.: Middle
at-mosphere cooling trend in historical rocketsonde data, Geophys. Res. Lett., 25, 3371–3374, 1998.
Forbes, J. M., Zhang, X., Ward, W. E., and Talaat, E. R.: Climato-logical features of mesosphere and lower thermosphere station-ary planetstation-ary waves within ±40◦latitude, J. Geophys. Res., 107, doi:10.1029/2001JD001232, 2002.
Garcia, R. S. and Solomon, S.: The effect of breaking gravity waves on the dynamics and chemical composition of the mesophere and lower thermosphere, J. Geophys. Res., 90, 3850–3868, 1985. Golitsyn, G. S., Semenov, A. I., Shefov, N. N., Fishkova, L. M.,
Lysenko, E. V., and Perov, S. P.: Long-term temperature trends in the middle and upper atmosphere, Geophys. Res. Lett., 23, 1741–1744, 1996.
Hagan, M. E., Forbes, J. M., and Vidal, F.: On modeling migrating solar tides, Geophys. Res. Lett., 22, 893–896, 1995.
Hagan, M. E., Burrage, M. D., Forbes, J. M., Hackney, J., Randel, W. J. and Zhang, X.: GSWM-98: Results for migrating solar tides, J. Geophys. Res., 104, 6813–6828, 1999.
Hagan, M. E., Roble, R. G., and Hackney, J.: Migrating thermo-spheric tides, J. Geophys. Res., 106, 12 739–12 752, 2001. Hecht, J. H., Walterscheid, R. L., Roble, R. G., Lieberman, R. S.,
Talaat, E. R., Ramsay Howat, S. K., Lowe, R. P., Turnbull, D. N., Gardner, C. S., States, R., et al.: A comparison of atmo-spheric tides inferred from observations at the mesopause during ALOHA-93 with the model predictions of the TIME-GCM, J. Geophys. Res., 103, 6307–6322, 1998.
Hedin, A. E., Fleming, E. L., Manson, A. H., Schmidlin, F. J., Av-ery, S. K., Clarck, R. R., Franke, S. J., Fraser, G. J., Tsuda, T., Vial, F., and Vincent, R. A.: Empirical wind model for the upper, middle and lower atmosphere, J. Atmos. Terr. Phys., 58, 1421, 1996.
Jarvis, M. J., Jenkins, B., and Rodgers, G. A.: Southern hemisphere observations of a long-term decrease in F-region altitude and thermospheric wind providing possible evidence for global ther-mospheric cooling, J. Geophys. Res., 103, 20 774–20 788, 1998. Jonsson, A., de Grandpr´e, J., and McConnell, J. C.: A com-parison of mesospheric temperatures from the Canadian Mid-dle Atmosphere Model and HALOE observations: Zonal mean and signature of the solar diurnal tide, Geophys. Res. Lett., 29, doi:10.1029/2001GL014476, 2002.
Kane, T., Grime, B., Franke, S., Kudeki, E., Urbina, J., Kelley, M., and Collins, S.: Joint Observations of Sodium Enhancements and Field-Aligned Ionospheric Irregularities, Geophys. Res. Lett., 28, 1375–1378, 2001.
Keckhut, P., Hauchecorne, A., and Chanin, M. L.: Midlatitude long-term variability of the middle atmosphere: Trends and cyclic and episodic changes, J. Geophys. Res., 100, 18, 1995.
Keckhut, P., Schmidlin, F. J., Hauchecorne, A., and Chanin, M. L.: Stratospheric and mesospheric cooling trend estimates from U.S. rocketsondes at low latitude stations (8 S–34 N), taking into account instrumental changes and natural variability, J. Atmos. Terr. Phys., 61, 447–459, 1999.
Keckhut, P., Wild, J. D., Gelman, M., Miler, A. J., and Hauchcorne, A.: Investigations on long-term temperature changes in the upper stratosphere using lidar data and NCEP analyses, J. Geophys. Res., 106, 7937–7945, 2001.
Kokin, G. A. and Lysenko, E. V.: On temperature trends of the at-mosphere from rocket and radiosonde data, J. Atmos. Terr. Phys., 56, 1035–1040, 1994.
Leblanc, T., McDermid, I. S., and Ortland, D. A.: Lidar obser-vations of the middle atmospheric thermal tides and compari-son with the High Resolution Doppler Imager and Global-Scale Wave Model, 2, October observations at Mauna Loa (19.5 N), J. Geophys. Res., 104, 11 931–11 938, 1999.
B. R. Clemesha: A review of recent MLT studies at low latitudes 3275
L¨ubken, F.: Nearly zero temperature trend in the polar summer mesosphere, Geophys. Res. Lett., 105, 3603–3606, 2000. Medeiros, A. F., Taylor, M. J., Takahashi, H., Batista, P. P., and
Gobbi, D.: An investigation of gravity wave activity in the low-latitude upper mesosphere: Propagation direction and wind filter-ing, J. Geophys. Res., 108, doi:10.1029/2002JD002593, 2003. Pimenta, A. A., Batista, P. P., Clemesha, B. R., and Simonich, D.
M.: Morphology of the sodium layer: a study using laser and me-teor radar, Third PSMOS International Symposium on Dynamics and Chemistry of the MLT Region, Foz de Iguac¸u, Brazil, 4–8 October, 2002.
Portmann, R. W., Thomas, G. E., Solomon, S., and Garcia, R. R.: The importance of dynamical feedbacks on doubled CO2
-induced changes in the thermal structure of the mesosphere, Geo-phys. Res. Lett., 22, 1733–1736, 1995.
Roble, R. G. and Ridley, E. C.: A thermosphere-ionosphere-mesosphere-electrodynamics general circulation model (time-GCM): Equinox solar cycle minimum simulations (30–500 km), Geophys. Res. Lett., 21, 417–420, 1994.
Roble, R. G. and Dickinson, R. E.: How will changes in carbon dioxide and methane modify the mean structure of the meso-sphere and thermomeso-sphere?, Geophys. Res. Lett., 16, 1441–1444, 1989.
She, C. Y. and v. Zahn, U.: Concept of a two-level mesopause: Support through new lidar observations, J. Geophys. Res., 103, 5855–5864, 1998.
She, C. Y., Chen, S., Hu, Z., Sherman, J., Vance, J. D., Vasoli, V., White, M. A., Yu, J., and Kreger, D. A.: Eight-year climatology of nocturnal temperature and sodium density in the mesopause region (80–105 km) over Fort Collins, CO (41 N, 105 W), Geo-phys. Res. Lett., 27, 3289–3292, 2000.
Shepherd, G. G., Roble, R. G., Zhang, S. P., McLandress, C., and Weins, R. H.: Tidal influence on midlatitude airglow: Compari-son of satellite and ground-based observations with TIME-GCM predictions, J. Geophys. Res., 103, 14 741–14 752, 1998. Takahashi, H., Clemesha, B. R., and Batista, P. P.: Predominant
semi-annual oscillation of the upper mesospheric airglow inten-sities and temperatures in the equatorial region, J. Atmos. Terr. Phys., 57, 407–414, 1995.
Takahashi, H., Clemesha, B. R., Sahai, Y., and Batista, P. P.: Sea-sonal variations of the mesopause temperature observed at equa-torial (4◦S) and Low (23◦S) latitude stations, Adv. Space Res., 14, (9)97–(9)100, 1994.
Taubenheim, J., Entzian, G., and Berendorf, K.: Long-term de-crease of mesospheric temperature, 1963–1995, inferred from radiowave reflection heights, Adv. Space Res., 20, 2059–2063, 1997.
Thulasiraman, S. and Nee, J. B.: Further evidence of a two-level mesopause and its variations from UARS high-resolution Doppler imager temperature data, J. Geophys. Res., 107, doi:10.1029/2000JD000118, 2002.
v. Zahn, U., Hoffner, J., Eska, V., and Alpers, M.: The mesopause altitude: Only two distinctive levels worldwide?, Geophys. Res. Lett., 23, 3231–3234, 1996.
Walterscheid, R. L., Schubert, G., and Brinkman, D. G.: Small-scale gravity waves in the upper mesosphere and lower thermo-sphere generated by deep tropical convection, J. Geophys. Res., 106, 31 825–31 832, 2001.
Whitehead, J. D.: Recent work on mid-latitude and equatorial sporadic-E, J. Atmos. Terr. Phys., 51, 401–424, 1989.