DYNAMIC PERMEABILITY AND BOREHOLE
STONELEY WAVES: A SIMPLIFIED
BlOT-ROSENBAUM MODEL
byX.M. Tang, C.H. Cheng, and M.N. Toksoz Earth Resources Laboratory
Department of Earth, Atmospheric, and Planetary Sciences Massachusetts Institute of Technology
Cambridge, MA 02139
ABSTRACT
Stoneley waves in permeable boreholes are diagnostic of formation permeability be-cause their propagation is affected by the dynamic fluid flow at the borehole wall. We characterize this flow using the concept of dynamic permeability. We examined the applicability of the dynamic permeability to porous media by applying it to a single fracture case and found that it agrees excellently with the fracture conductivity de-rived from an exact solution. In dealing with the interaction of a Stoneley wave with a porous formation, we decompose the problem into two parts. The first is the in-teraction of the Stoneley with an equivalent elastic formation without fluid flow. The second is the interaction with the flow that is governed by the dynamic permeability. In this manner, we obtained a simple model for the Stoneley propagation in permeable boreholes. We compared the Stoneley wave attenuation and dispersion characteristics from this model with those from the complete model of the Biot-Rosenbaum theory in the case of a hard and a soft formation, respectively. We found that the results from both models agree very well for a hard formation, although they differ at higher frequencies for a soft formation because of the increased solid compressibility. The theoretical predictions from this simple model were also compared with recently pub-lished laboratory data of Stoneley wave measurements, performed at both low- and high-frequency regions of Biot theory. The simple model and experiment are in ex-cellent agreement. Because of the simplicity of the model, it can be easily applied to problems concerning Stoneley propagation in permeable boreholes, especially to an inverse problem to extract formation permeability from Stoneley wave measurements.
118 Tang et al.
INTRODUCTION
The estimation of rock permeability from borehole Stoneley waves is of considerable importance in acoustic logging studies. Field measurements clearly indicated the ef-fects of formation permeability on Stoneley waves (Bamber and Evans, 1967; Staal and Robinson, 1977; Williams et aI., 1984; Zemanek et aI., 1985). On the other hand, theoretical studies also showed the correlation between permeability and Stoneley prop-agation. White (1983) and Hsui and Toksiiz (1986) developed low frequency models to study the problem and predicted this correlation, although these models are not accu-rate at high frequencies. Rosenbaum (1974) was the first to use Biot's (1956) theory for a porous solid to model acoustic logging in a porous formation and investigated the effects of permeability on high-frequency borehole acoustic waves. This model is therefore termed the Biot-Rosenbaum model. Cheng et al. (1987) applied this model to the medium frequency range of [0-8J kHz, in which the Stoneley wave is effectively excited. They found substantial influence of permeability on Stoneley propagation and a good agreement of the theory with field observations. Schimtt et al. (1988) extended the model to study the permeability effects on the Stoneley and other borehole waves (e.g., pseudo-Rayleigh waves). Winkler et al. (1989) performed laboratory model ex-periments to measure borehole Stoneley wave propagation and found that the theory and experiment agree very well. In addition, Chang et al. (1988) and Norris (1989) de-rived low-frequency asymptotics of the Biot-Rosenbaum theory for the Stoneley wave and showed that the White (1983) and Hsui and Toksiiz (1986) models are the low-frequency representation of the theory when the frame of the solid is very rigid. In summary, it has become clear that the Biot-Rosenbaum model is the appropriate basic theory for wave propagation in a borehole penetrating a porous formation.
The notion of permeability was originally defined by Darcy (1856) to measure the ability of a porous material to transport fluid under a static pressure gradient. One would wonder how such a static quantity is related to dynamic wave propagation. The relation lies in the "slow wave" that exists in a porous solid. Basically, the Biot's theory predicts three distinct types of waves in a fluid-saturated porous medium (Biot, 1956a,b), the "fast" compressional and shear waves, and the slow compressional wave. The former waves are analogous to the P and S waves in an elastic solid, while the latter wave is a dilatational wave associated primarily with the motion of the pore fluid. The slow wave exhibits strong frequency-dependent behaviors. At low frequencies, the slow wave motion is diffusive, and the amount of fluid flow driven by this motion is well described by the static Darcy's law. At high frequencies, however, this wave is a propagational wave and the fluid flow is no longer governed by this law. To address this frequency-dependent fluid transport problem, Johnson et al. (1987) developed the theory of dynamic permeability for the general porous media; Tang and Cheng (1989) derived dynamic conductivity for fluid transport through a fracture under an oscillatory pressure gradient. The former theory was derived based on the low- and high-frequency
(
Stoneley Wave and Permeability 119 behaviors of the pore fluid motion and a simple response model that satisfies certain causality and reality conditions. The latter theory, because of the simple geometry involved, was rigorously derived by solving the Navier-Stokes equation for a viscous fluid filling the fracture. We will show that the dynamic permeability, when applied to the fracture situation, is almost identical to the exact dynamic conductivity. The success of this comparison will further demonstrate the general applicability of the dynamic permeability to porous media, whatever the pore shape and sizes.
In the case of Stoneley wave propagation in a permeable borehole, the borehole wave will excite all three types of Biot waves in the formation. The Biot-Rosenbaum model deals with the interaction between the borehole propagation and these three waves by rigorously solving a set of coupled partial differential equations in connection with boundary conditions at the borehole wall. Although such an approach is complete and accurate, the mathematics and computation involved make the model complicated. Particularly in an inverse problem to extract formation permeability from Stoneley
wave measurements, this model is not convenient to use. In this study, we take a much
simpler alternative approach to this problem. We decompose the interaction into two parts. The first is the interaction of the Stoneley with the formation shear and fast compressional waves in the absence of the slow wave. This problem is equivalent to the one with a formation having effective elastic moduli corresponding to the first two waves, for which the solutions are known. On the basis of the first step, the second step is to add the interaction between the Stoneley and the formation slow wave, for which we will apply the dynamic permeability to measure the loss of Stoneley energy that is carried away by the slow wave into the formation. Since the correlation between Stoneley attenuation and permeability is believed to be largely due to this latter interaction, the final results of our approach are expected to be consistent with those from the Biot-Rosenbaum theory, as long as the frequency dependent transport property of the porous formation is correctly accounted for. The success of this effort will not only further verify the Stoneley attenuation mechanism in permeable boreholes, but will also provide a much simplified useful model that is of sufficient accuracy in applications to both forward and inverse problems concerning borehole Stoneley wave propagation in a porous formation.
In the following, we first test the dynamic permeability with the exact dynamic conductivity in the case of a fracture. Next, we use tbe dynamic permeability to derive a governing equation for the pore fluid flow. Then we apply this equation to borehole Stoneley propagation and obtain a simple mode!. The results from this model are then compared with those from the Biot-Rosenbaum model and the experimental results available from Winkler et a!.'s (1989) article. Finally, we discuss the conditions under which the simple model is valid or inadequate.
120 Tang et aI.
DYNAMIC PERMEABILITY: A TEST OF ITS VALIDITY
For a homogeneous, isotropic, porous solid saturated with a Newtonian viscous fluid, Johnson et al. (1987) developed the theory of dynamic permeability to characterize the frequency-dependent behavior of the pore fluid flow. Assuming that the solid frame is rigid, they derived the complex permeability as
(1)
where KO is the static Darcy permeability, W is the angular frequency, a is the high-frequency limit of the dynamic tortuosity, which is a parameter describing the tortu-ous, winding pore space, Po and Jl are fluid density and viscosity, respectively, and ¢ is porosity. The symbol A is a measure of pore size and is approximately given as (Johnson et aI., 1987)
(
(
8aKO)1/2
A",
T
.
(2)
In the case of a fracture, A is the fracture aperture and the number 8 in Eq. (2) is replaced by 12. For general porous media A is difficult to characterize, we will therefore use the relation in Eq. (2) for the value of A in Eq. (1). The low- and high-frequency behaviors of K(W) are readily derived from Eq.
(1).
At low frequencies,x:(w)
-+ KO; at high frequencies, K(W) -+ iJl¢f(apow), varying inversely proportional tow. Since K(W) is a very important parameter that we will later apply to our Stoneley propagation model, we wish to test its validity and accuracy against a simple model with known results.In the study of frequency-dependent fluid transport in a single fracture filled with a Newtonian fluid, Tang and Cheng (1989) derived the fracture dynamic conductivity, which is written as ( - iwLo G(w) = k"V2 ' fPo (3) where Lois fracture aperture, Vf is sound velocity in fluid, and k is a complex wave number found from the following period equation
with 2 - Lo - Lo
k tan(J'2)+fftan(J'2)=O,
(4)f=
V2 4iwJl f - 3po k" , andf=
JiW;O -k" .Stoneley Wave and Permeability 121 By studying the low- and high-frequency asymptotic solutions of Eq. (4) (see the appendix of Tang and Cheng, 1989), it was found from Eq. (3) that
t
= Lgj(12/l)t
= iLo/(wpo)(w ->
0) ,
(w -> 00) (.5 )
To compare Eq. (1) with Eq. (3), we need to use appropriate parameters in Eq. (1). For the fracture case, '"
=
1, A=
La, 1<0=
L5/12 and ¢=
1 . By Darcy's law,the fracture conductivity and permeability are related via C = I<Lo/ /l. Therefore, the
fracture dynamic conductivity derived from Eq. (1) is
. L2 'tpQW 0 12/l
L
3 _0_ C(w)=
--"1~2/lc:.",- _ ( _ i POWL5)"
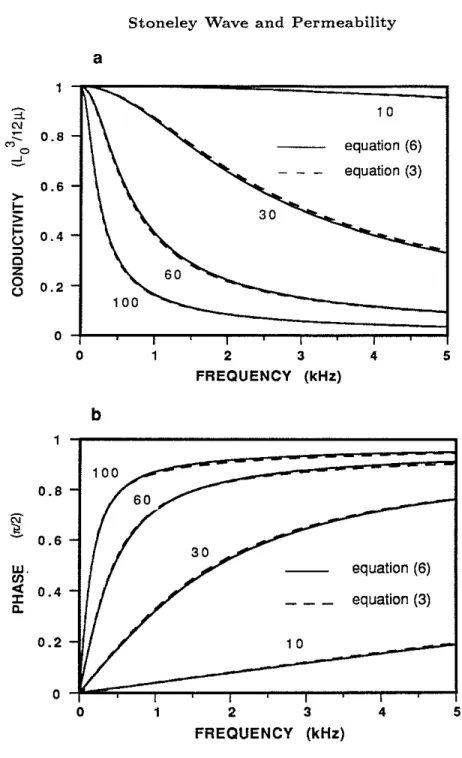
1 36/l (6)It is obvious that the low- and high-frequency behaviors of Eq. (6) are exactly those given in Eqs. (5). A complete comparison between Eqs. (3) and (6) is illustrated in figures 1a and 1b for a set of fracture apertures ranging from 10 /lm to 100 /lm. The fluid is water with /l
=
1 cpo The reason for choosing different apertures is that the fracture fluid motion is controlled by the viscous skin depth 6 = )2/l7PoW. For water, the skin depth is about 18 /lm at 1 kHz and 8 /lm at 5 kHz. For apertures which are small compared to 6 the fluid motion is dominated by diffusion. While for apertures which are large compared to 6, the motion is mostly propagational. Thus the comparison ofC(w) and trw) from small to large apertures will fully illustrate their compatibility in frequency ranges from quasi-static to dynamic regimes. Figure 1a shows the amplitudesofC(w) (solid curves) and trw) (dashed curves) in the frequency range of [0-5J kHz. The conductivities are normalized by their zero frequency value L~/(12/l)' An excellent agreement of C(w) with the exact trw) is seen from the quasi-static regime (the lower frequency part of the La = 10 /lm curves), through the transition regime (the La=
30 and 60 /lm curves), to the dynamic regime (the higher frequency part of the Lo=
100 /lm curves). Figure 1b shows that not only ~heir amplitudes but also their phases are in excellent agreement. Thus the general formula of Eq. (1), when applied to the special case of a fracture, agrees extremely well with the exact solution of Eq. (3). In fact, Eq. (1) has been successfully tested with large tube lattices with randomly varying radii (Johnson et aI., 1987). The present test, together with the previous test, further reflects the general applicability of the theory of dynamic permeability to the modeling of frequency dependent fluid flow properties122 Tang et al.
RELATION TO BlOT'S SLOW WAVE
(
In this section, we will demonstrate the relation between the dynamic permeability
and Biot's slow compressional wave and derive an equation that will later be used in
the borehole propagation problem. For a fluid-saturated porous medium, the equation of continuity for the pore fluid is
\7.(p¢ii)
+ ;/
¢p) = 0 , (7)where t is time, iiis the macroscopic fluid velocity through the porous medium. For a
small amplitude fluid motion, the density p can be written as (
p=po+P' , (8)
where p' is the density perturbation, which is related to the pressure disturbance P as
P' =
PIV] .
(9)At this stage, we ignore solid frame elasticity and consider the pore fluid flow that results from the pore pressure gradient and permeability. Therefore, we can still use Darcy's law
(10) (
However, an important modification to the conventional Darcy's law is that the static permeability 1<0 has now been replaced by the dynamic permeability I«w) given by
Eq. (1). Transforming Eq. (7) to the frequency domain, then substituting Eqs. (8), (9), and (10) into it and taking the first order perturbation terms, we obtain a linearized equation for the pore fluid pressure
where
(11)
(12) is the pore fluid diffusivity for the rigid frame case and
K
f =PoV]
is the fluid modulus. A plane wave solution to Eq. (11) has a wave numberk=
Jiwf
Do. Using the dynamic permeability given in Eq. (1) and substituting it intoDogiven in Eq. (12), we obtain the low- and high-frequency behaviors of this wave motion. At low frequencies, Do ~ const.and k ex
,;u:;,
indicating that this motion is diffusive. At high frequencies, Do ex(iw)-l
and k exw ,implying that this motion becomes a propagational wave. Therefore, based on the theory of dynamic permeability, Eq. (11) correctly predicts the general behavior of Biot's slow compressional waves.
Stoneley Wave and Permeability
Correction for Solid Frame Elasticity
123
We now relax the assumption that the solid frame is rigid and make a correction for the effects due to its elasticity. Based on Biot's theory, Chang et a!. (1988) as well as Norris (1989) showed that, at low frequencies, if the frame elasticity is taken into account, the diffusivity given in Eq. (12) should be corrected to become
with I; given by D = Do(l
+
0-
1 , (13) (14) (15) I;=
Kf4{1+
I~ [~N(1
-~~b)
- Kb - ¢(Kd~N)]}
, ¢(Kb+
3"N) , {,where K, is the solid grain bulk modulus, Kb and N are the solid frame bulk and shear moduli, respectively. It should be noted that in Chang et al.'s formula, the permeability in
Do
(Eq. 12) was the static permeability KO. Here we have replaced KO with K(W), but still use the correction termI; given in Eq. (14) for the frame elasticity. Because K(W) --> KO as W--> 0, Eq. (13) is identical to Chang et al.'s diffusivity at lowfrequencies. As frequency increases, the frequency-dependent fluid flow is accounted for by K(W), and the effects due to frame elasticity will be compensated by the correction term 1;. With this correction, Eq. (11) becomes
{
,ip+iw/DP=O,
2 .
iw¢v
k =.w/D=
()
2( ) 1 .K W cr.f 1+1;
The wavenumber given in Eq. (15) is in complete agreement with the slow wavenumber from the exact Biot formulation (for example of this formulation, see Chang et a!., 1988) in the low-frequency region of the Biot theory. In the high-frequency region, the two wavenumbers are slightly different depending on porosity and permeability. Since most field situations are relevant to the low-frequency region of Biot theory (Winkler et a!., Eq. (15) is adequate for applications to such situations. Even in the high-frequency region of Biot theory, this equation is still a good approximation. Therefore, since Eq. (15) characterizes the dynamic fluid flow through a porous medium, it will later be employed in conjunction with the problem of Stoneley wave propagation in permeable boreholes.
APPLICATION TO BOREHOLE STONELEY WAVES
For a Stoneley wave propagating in a borehole whose axis is aligned with z direction, the borehole fluid displacement potential can be written as
124 Tang et al.
(
where r is the radial variable and k z is the Stoneley wave number. In this formulation, the axial symmetry is assumed. Itfollows that the radial potential function "p satisfies the following boundary value problem (Tang et aI., 1989)
(17)
where
\7;
is the two dimensional Laplace operator and v =Jw
2/VJ - k;
is the radial wave number. The wall impedance(u/p) is the ratio of the displacementuand pressure peval uated at the borehole boundary r =R.
When the borehole wall is permeable, u includes two contributions. The first is the elastic displacement of the wall, given byu,.
The second is the fluid flow into pores that are open to the borehole wall, given by ¢uf. The first problem is equivalent to that of a borehole with an equivalent elastic formation consisting of the porous skeleton and fluid. In the first step, we only considerP and S waves in such a formation. They are analogous to Biot's fast compressional and shear waves. Whereas for the second problem, we are mainly concerned with pore fluid flow, which is Biot's slow compressional wave. Splitting the problem of Eqs. (17) into two, we can write 1./J and v2 as
(
(
(18) (19)
(20) where "p, satisfies the following boundary value problem
{
\7;"p,
+
v;"p, = 0Bt,
=
pow2(~')"p,
,at r=
R ,
and "pf andV] are perturbationsto"p, and v;, respectively. They result from the fluid flow at the borehole wall. The solution to the elastic problem (Eqs. 20) is known. The boundary condition in Eqs. (20) leads to a borehole dispersion equation (Cheng et aI., 1982). Given the effective elastic moduli or P and S wave velocities of the equivalent elastic formation, we can solve the dispersion equation to find
v;,
from which the Stoneley wave number kz , without the flow effects is obtained. The calculation of theeffective moduli and the velocities are described in the next section. To find
V],
we substitute Eqs. (18) and (19) into Eqs. (17) and obtain a boundary value problem for "pf{
\7;"pf
+
v;"pf = -V]"pBt
f =pow2(u')"pf+poW2¢('!:1.).,p ,at r=R.
r p p
Applying the two-dimensional Green's theorem
(21)
Stoneley Wave and Permeability
where
A :borehole area; S: borehole boundary r = R
to Eqs. (20) and (21) and using their respective boundary conditions, we get
125
(23 ) To evaluate
V],
we need to find the flow impedance (uf/P) and the ratio of integrals in Eq. (23). Ifwe assume that the borehole Stoneley wave does not vary significantlywith r in either the elastic or the porous case, then we have
fs'l/J'l/JedS
2
ffA 'l/J'l/JedA
~R .
(24)To find (uJlp), we need to solve Eq. (15). Under the excitation of a borehole propa-gation eik.z, the formation pore fluid pressure has the form
P(
r,
z) =p(
r
)eik•z ,r:::>:
R . (25)(26) In the previously mentioned quasi-static, low-frequency models, the term eik•z was
ignored (see White, 1983 for example). This is valid when the wavelength is large compared to the borehole radius. However, at higher frequencies, the pore fluid flow is coupled with the borehole propagation and this term should be included. Substitution of Eq. (25) into Eq. (15) results in a Bessel's equation for p
d2p 1 dp iw 2
dr2
+ ;;:
dr+
(D - k%)p=
0,r:::>:
Rfor which the solution is
Ko(rJ-iw/ D
+
k;)per) = peR) ,
Ko(RJ-iw/ D
+
k;)(2i)
(28) where peR) is the borehole pressure at the wall andK
o
is the zero order modified Bessel function. Differentiating Eq. (27) with respect to r and using the modified Darcy's law given by Eq. (10) (note that v=
-iwuf in this equation), we find the wall impedance due to flow asUf iK(W) / . K , (RV -iw/ D
+
k;)- = --V-,w/D+k2--'--7===~
p w/1<P %Ko(RV -iw/ D
+
k;) ,where K , is the first order modified Bessel function. Using Eqs. (23), (24), and (28), and a relation following from Eq. (19)
126 Tang et al.
we obtain a final expression for the Stoneley wave number
kz =
2iPOWK(W)~'W
f{I(RJ-iw/D+k':)
k2
+
-- +
k2
•
zo p.R D zf{o(RJ-iw/D+k;J (29)
Itis a very good approximation to replace kz on the right hand side of Eq. (29) byk ze ,
since the amplitude of their difference is considerably smaller than that ofkze. In this
way, we obtain a simple, explicit formula for calculating Stoneley wave propagation
in permeable boreholes. The Stoneley phase velocity and attenuation are calculated
uSIng
VST
Q-1
= w/ Re(kz ) ,
= 2Im(kz )/ Re(kz ) (30)
Eq. (29) is the central result of this study. Before we compare our simple model with the complete model of the Biot-Rosenbaum theory, we wish to point out the relevance of our model to other simple low-frequency models. At low frequencies, we have in Eq. (29) that iw / D
>
k;, K(W) ---> KO,and k;. --->POW2(1/J(f+
1/N). With these relations it can be readily seen that our simple model reduces identically to Chang et al. (1988) and Norris (1989) quasi-static models. When the solid is taken as rigid, our model reduces to the White (1983) and Hsui and Toksoz (1986) models. We emphasize that the major improvements of these quasi-static models by the present simple model are the use of the dynamic permeability and the Stoneley wave number corresponding to an equivalent elastic formation. The former parameter takes into account the frequency dependent effects of the pore fluid flow, while the latter parameter, the effects of the formation elasticity on borehole Stoneley waves. In addition, as we will show later, the use of the latter parameter can even allow us to model Stoneley propagation in the presence of intrinsic attenuation in the formation and borehole fluid.COMPARISON WITH BIOT-ROSENBAUM MODEL
In this section, we compare our simple model with the Biot-Rosenbaum model for the effects of frequency, permeability, porosity, and intrinsic attenuation. We will also study the cases of a hard and a soft formation to check the applicability and limitations of the simple model. A parameter in the Rosenbaum (1974) formulation is the borehole acoustic pressure impedance factor K. When K = 0, the borehole fluid pressure and
the formation pore fluid pressure are equal, this case being referred to as the open hole case, in which fluid flow occurs through pores that are open to the wall. With increasing K, the pressure communication between the two fluids decreases. As K, goes
to infinity there is no hydraulic exchange at the wall and this is referred to as the sealed borehole case. All exam pies in this study will assume the open hole case, except that we will briefly mention the relationship between the two models for the sealed
Stoneley Wave and Permeability 12, hole case in the following. In both models the solid frame mod uli are calculated using (Schmitt et aI., 1988; Norris, 1989)
1(b = (1-1»Ps(Vp2- 4V,2/3)
N = (1-1»PsV,2,
(31) (32) where Ps is the density of the solid frame, Vpand Vsare the compressional and shear velocities of the dry rock. For the equivalent elastic formation, the effective P and S
velocities are calculated using
v;,
= yI(1(,+
4/3N)/ PeV,
ylN/p, ,
(33) (34) where the effective density P, and bulk modulus 1(, of the formation are given by the
Gassmann equations (see White, 1983):
P,
= 1>po+
(1 -1»Ps [, (1 - Kb/1(,)2 {b+
[1>/K/ +(I-1»/K, - Kb/ K ;] (35) (36) Eq. (36) indicates that the effective bulk modulus equals the bulk modulus of the skeleton plus a fluid-dependent term. The elastic formation Stoneley wave number kz ,in Eq. (29) is calculated by substituting· the above given
17
p andV"
and P, into theborehole dispersion equation, as given by Cheng et al. (1982). Interestingly, we find that the Stoneley wavenumber kz , so obtained is almost equivalent to the wavenumber corresponding to the sealed borehole case of the Biot-Rosenbaum theory. This is not surprising since Biot's (1956a and b, 1962) theory for a porous solid is formulated on the basis of Gassmann's theory by adding fluid flow and dissipation effects (White, 1983). Without flow at the borehole wall, the Stoneley primarily interacts with the P and S waves in the formation. These fast waves are little affected by the pore fluid flow effects associated with their motions, although these effects are predicted by the Biot-Rosenbaum model (see Schmitt et aI., 1988), which yields some (negligibly small) attenuation for the Stoneley wave. Thus, for the sealed hole case, the above calculated kze is adequate to determine the borehole Stoneley propagation. In the open
hole case, we substitute kz , into Eq. (29) to calculate the Stoneley wavenumber with
the fluid flow effects. The whole procedure is straightforward and much simpler than solving the borehole dispersion equation corresponding to the Biot-Rosenbaum theory (Rosenbaum, 1974). Especially in an inversion procedure where extensive computation of the forward model is required, using the present model will be much simpler and faster than using the Biot-Rosenbaum theory.
In the following examples, the grain modulus Ks
=
3.79X10¹⁰ Pa, the solid density Ps=
2650 kg/m3, the borehole radius R=
10 em, and the borehole and formation128 Tang et aI.
pore fluid is water with Po = 1000 kg/m3, JL = 1 cp andVI = 1500 m/s. The tortuosity for both models is taken to be 3 (the a in Eq. (1) is equivalent to Morse's dynamic fluid-solid coupling factor E in the Rosenbaum (1974) formulation). Other parameters that vary from example to example are summarized in Table 1.
Hard Formation
A hard formation is the one whose shear wave velocity is greater than the borehole fluid velocity. This formation is important because many permeable reservoir rocks, such as sandstone, fall into this category. Another reason for studying this case is that in this formation, the rock is less compressible than the pore fluid, so that the fluid-solid coupling is not pronounced and the simple correction for the frame elasticity (Eq. 13) is expected to be adequate.
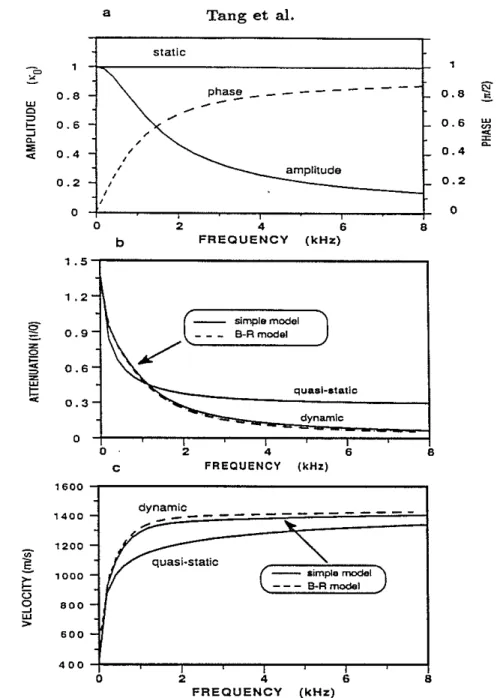
We first study the effects of the dynamic permeability in Eq. (29), since this param-eter is a major quality by which our model differs from other quasi-static, low-frequency models. These effects can be illustrated by respectively using the dynamic permeabil-ity K(W) and the static permeability KO in Eq. (29) and comparing the results against those of the Biot-Rosenbaum theory. We choose KO = 10 Darcy in our calculations. Although this value is rather high for common reservoir rocks, it serves to demonstrate the dynamic effects ofK(W) in Eq. (29). Other parameters involved are given in Table 1. For this value ofKO, Biot's critical frequency j, = JL4>/(2rrKoapo) (at j, the viscous and the dynamic effects are comparable) is only about 1.3 kHz. But the dynamic effects occur before this frequency is reached. Figure 2a shows the dynamic permeability in the frequency range of [0-8] kHz. The amplitude ofK(W) (solid curve) is normalized by KO, and its phase (dashed curve) by rr/2. The static Darcy permeability (solid line) is also plotted. As seen from this figure, the amplitude decreases, and the phase increases with frequency, this behavior ofK(W) being substantially different from the constantKO. Figure 2b shows the Stoneley wave attenuations calculated using Eq. (29) with K(W) (solid curve marked dynamic) and KO (solid curve marked 'quasi-static'), respectively. The results are compared against that of the Biot-Rosenbaum model (dashed curve). Surprisingly, the result from the simple dynamic model fits that from the complete theory very well, simply because of the use of K(W). Whereas the result from using Ko agrees with the theory only at the low-frequency limit. Itlargely over-predicts the attenuation at frequencies above 2 kHz. The difference between the dynamic and quasi-static results can be qualitatively explained by the behavior ofK(W) shown in figure 2a. That is, because of the decrease ofK(W) with frequency, the formation is less permeable under high-frequency excitations than it is under low-frequency excitations. Figure 2c shows the Stoneley wave dispersions associated with figure 2b. To our satisfaction, the simple dynamic model (solid curve marked dynamic) agrees with the complete theory (dashed curve) fairly well, the velocity of the simple model being slightly lower than that of the Biot-Rosenbaum model. The velocity from using KO is significantly lower
Stoneley Wave and Permeability 129 than that of the dynamic models. This difference can be explained as follows: For the high permeability used, the dynamic (or inertial) effects of pore fl uid flow are increased, which tends to decouple the borehole propagation from the formation (Schmitt et aI., 1988) and the Stoneley wave velocity tends to reach the free space fluid velocity. Since these effects are accounted for by the dynamic permeability, the simple dynamic model correctly shows this tendency (i.e., the increase of Stoneley velocity). However, the use of"0 assumes that the pore fluid flow is still governed by viscous forces and therefore maintains significant borehole formation coupling, resulting in lower Stoneley velocity than that of the dynamic models.
Next, we compare the two models versus frequency for a representative range of permeabilities and porosities found from typical reservoir rocks (Table 1). Note that the permeability here refers to the static Darcy permeability (i.e., "0 in Eq. (1)). Figure 3a shows the Stoneley wave attenuations predicted by our simple model (solid curve) and the Biot-Rosenbaum model (dashed curve). The frequency range is [0-10] kHz. This is a range in which most field Stoneley wave measurements are made. A general good agreement between the two models is achieved for formations ranging from low (curve A), medium (curve B), to high (curve C) permeabilities and porosities. Figure 3b shows the Stoneley wave phase velocities predicted by the two models. Again, the agreement is quite good between the two models. For low and medium permeability (porosity) cases A and B, the agreement is excellent. For the high permeability (porosity) case C, the simple model predicts slightly lower velocity at higher frequencies than the Biot-Rosenbaum model does. This difference should be expected since the effect of fluid-solid coupling due to the relative motion of the two phases may become significant when permeability and porosity are increased. But this effect is not taken into account in our simple model. However, these differences, as well as those shown in figure 3a for the attenuation, are only of academic importance because in practice they are well within the error of Stoneley wave measurements made in the field or even in the laboratory.
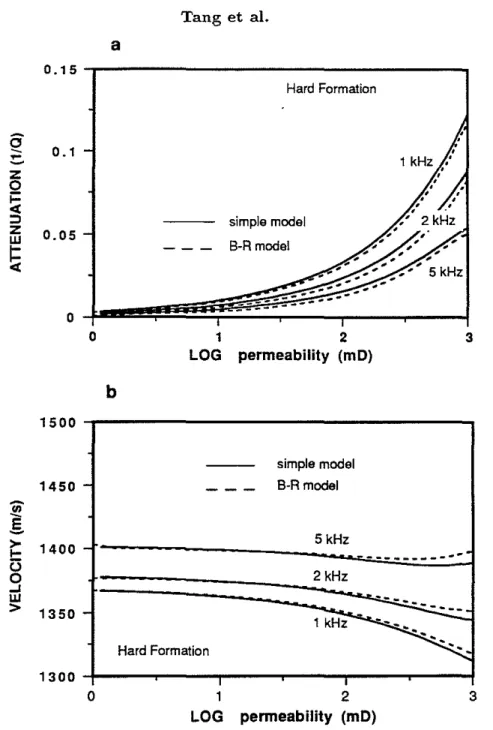
As the third example, we compare the Stoneley wave attenuations and dispersions from the two models versus permeability. Figure 4 shows the results at 1, 2, and 5 kHz for a sandstone with 15 percent porosity. In figure 4a, the agreement between the two models is quite good throughout the permeability range of [0-1000] mD for the three frequencies. The attenuations from the simple model (solid curve) and from the Biot-Rosenbaum model (dashed curve) are fairly close and show the same increasing tendency with permeability. In figure 4b, the velocities from the two models are almost identical in the low permeability range up to 100 mD. This range corresponds to curves A and B in figure 3b. As permeability further increases, they begin to show some differences because of the increase of the inertia coupling effect between fluid and solid in the Biot-Rosenbaum model. These differences can also be reflected in curve C of figure 3b. However, as expl.ained above, the differences of this kind are of little practical importance. What is interesting in figure 4b is that the simple model even shows a complex feature of the Biot-Rosenbaum model, i.e., the increase of Stoneley velocity
130 Tang et al.
with permeability (an effect due to the increased pore fluid mobility, as explained above). This feature can be seen from the high permeability end of the 2 and 5 kHz curves. Although we only showed the comparisons for the permeability range of common reservoir rocks, the agreement between the two models will continue at higher permeabilities. This has been demonstrated by the agreement shown in figure 2, where "0 = 104 mD was used. Again, in complement to figures. 2 and 3, the comparison shown in figure 4 confirms the validity of the simple model.
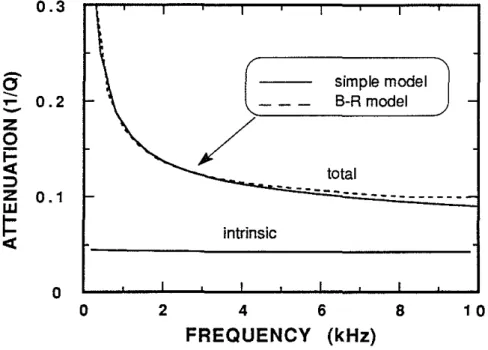
As a last example for the hard formation case, we demonstrate the validity of our simple model in the presence of intrinsic body-wave attenuation in the fluid acoustic wave and the formation shear and compressional waves. Because in the field the measured Stoneley wave attenuation is coupled with the intrinsic attenuation (Cheng et aI., 1987), the latter effect must be considered for our model to be applicable under field conditions. In the Biot-Rosenbaum model, the effects of intrinsic attenuation are taken into account by using the complex body-wave velocities. In our model, this problem can treated in much the same way. In calculating the elastic formation Stoneley wave number kze in Eq. (29), we can simply introduce the effect of intrinsic attenuation by using the transformation
v.,
-+ V.,/(l+
i/2Q.,) ,where subscript I can be each one of the subscripts p,s, and
f,
and V., and Q., cor-respond to Vp , V" Vf and their respective Q's. The anelastic body-wave dispersioncan also be added as necessary. Here we neglect this minor effect. Figure 5 shows the comparison between the two models for the intrinsic attenuation effect. Formation and borehole fluid quality factors are taken to be
Qp
=
100,Q.
=
50, andQf
=
20. Other parameters involved are the same as those of curve C in figure 3a, given in Ta-ble 1. The Stoneley attenuation due to intrinsic effects is also shown, which is nearly constant throughout the frequency range, consistent with the results of analyzing par-tition coefficients (Cheng et aI., 1982). The total attenuation curves from the simple model (solid curve) and the Biot-Rosenbaum model (dashed curve) are seen to agree quite well, showing only slight difference in the higher frequency range. In fact, the total attenuations are almost equal to the respective sums of the attenuations due to flow (curves C of figure 3a) with the intrinsic attenuation in figure 5. From this exam-ple, we see that the effects of intrinsic attenuation are properly handled by using the complex-valued wavenumber k" in our simple model.Soft Formation
A soft formation has a shear wave velocity smaller than the fluid acoustic velocity. Because of this, the solid may have a compressibility comparable to that of the pore fluid and the dynamic coupling between the two phases becomes strong, especially at
Stoneley Wave and Permeability 131 high frequencies. As a result, the simple model that ignores this coupling effect may not be adequate under such conditions. We choose to study this case in order to show the differences between the simple model and the Biot-Rosenbaum model in the soft formation case, so that one will be aware of these differences when applying the simple model to such conditions.
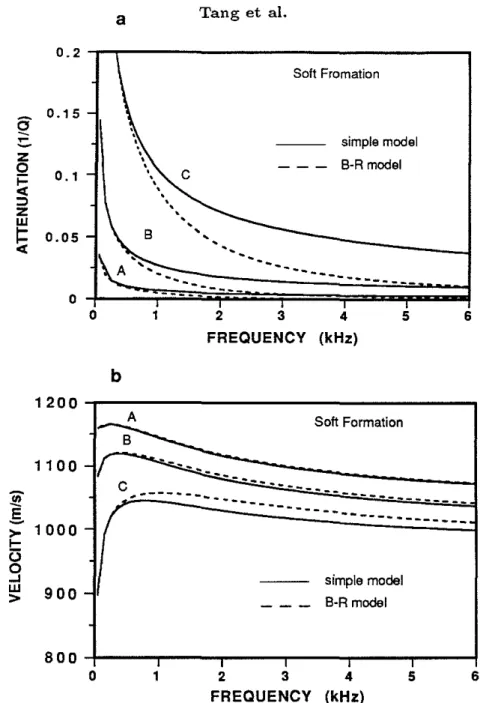
Figure 6 shows the comparison between the simple model (solid curves) and Biot-Rosenbaum model (dashed curves) for three different soft formations given in Table 1. The permeabilities and porosities are the same as those used in figure 3 and the curves A, B, and C have the same correspondence as in figure 3. Because the effective Stoneley excitation will be shifted to a lower frequency range in the soft formation case, the results in Figure 6 are shown only in the frequency range of [0-6] kHz. Although the attenuations in figure 6a predicted by the two models are identical at low frequencies and all decrease with increasing frequency, the attenuation from the simple model is significantly over-predicted at high frequencies, compared to the attenuation from the Biot-Rosenbaum model. This indicates that the fiuid flow effects are less pronounced for the soft formation case, than they are for the hard formation case. Figure 6b shows the Stoneley wave phase velocity from the two models. Compared to the attenuation in figure 6a, the difference between the two models is less apparent from the velocities. Only the high-permeability curves C show some meaningful difference. Despite these differences, the simple dynamic model may still be a reasonably good model if one applies it to the low-frequency range (e.g.,
<
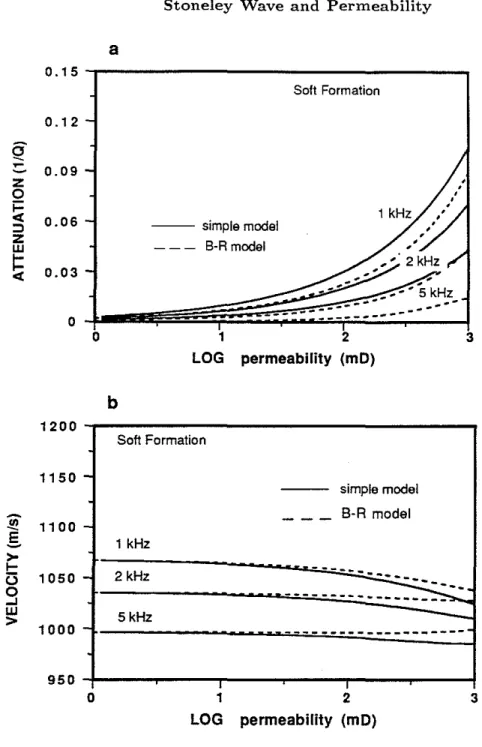
2 kHz in this particular case), because in the soft formation case the Stoneley wave energy is located in a narrower low-frequency range than it is in the presence of a hard formation.We now compare the two models versus permeability for three different frequencies of 1, 2, and 5 kHz. The porosity of the formation is 30 percent. Figure 7a shows the attenuations from the simple model (solid curves) and from the Blot-Rosenbaum model (dashed curves). Both attenuations increase with increasing permeability, with the simple model results higher than those of the other model. For the 1 kHz case, both results are in reasonably good agreement. As frequency increases, they begin to differ significantly. These effects can also be seen from figure 6a. Figure 7b shows the velocities associated with figure 7a. The velocities from the two models are very close at low permeabilities. They begin to differ as permeability increases. This difference also appears on curves C of figure 6b. Again, the comparison in figure 6 shows the applicability of the simple model at low frequencies. At higher frequencies, this model over-predicts the Stoneley attenuation, especially at high permeabilities.
132 Tang et al.
COMPARISON WITH LABORATORY EXPERIMENTAL
RESULTS
In a recently published paper, Winkler et al. (1989) showed the experimental results on the Stoneley wave propagation in permeable materials. These experiments were performed to evaluate the applicability of Biot's theory to acoustic logging in porous formation using Stoneley wave measurements. Excellent agreement was found between theory and experiment. In their experiments, they used formation materials with dif-ferent permeabilities, velocities, and porosities, and fluids with high and low viscosities. By varying these parameters, they were able to conduct the experiments in both low-and high-frequency regions of Biot's theory, as well as in the intermediate transition zone. Thus, in addition to the comparison with Biot-Rosenbaum theory in the previous section, these experiments provide a further test of our simple model and its validity in different frequency regions of Biot theory, as well as its applicability to porous ma-terials with different properties. Four samples were measured in their experiments. Three were synthetic materials made of resin-cemented glass beads. One was a rock sample made of Berea sandstone. All these samples were cylindrical in shape, having a diameter of 21.6 cm. A borehole was drilled along the sample axis, the diameter of the hole was 0.95 cm for the synthetic samples and 0.93 cm for the rock sample, respectively. The sample and fluid properties are given in Table 1 of Winkler et al. (1989), and are summarized in Table 2 of this paper for reference. One can see from the properties given in Table 2 that all the samples belong to the hard formation case because their shear velocities are higher than fluid velocities. Our simple model has been shown to be applicable to such a formation. In Winkler et al.'s (1989) paper, the experimental results were given for the Stoneley phase velocity and attenuation, which can be directly compared with our theoretical results calculated from Eqs. (29) and (30). In the experiments, P and S velocities and density of the fluid-saturated sam-ples were also measured, as listed in Table 2. We can therefore use these parameters as the effective elastic formation properties to directly calculate the elastic Stoneley wavenumber kze in Eq. (29). In addition, although our model is for the borehole with a
formation of infinite radial extent, the results still hold true for the laboratory models of finite size. This comes from the fact that the Stoneley wave is a guided wave trapped in the borehole, so that it is not sensitive to the large outer boundary of the samples, as long as the radius of this boundary (10.8 cm) is much bigger than the borehole radius (0.47 cm).
We begin the comparison with sample A, saturated with high-viscosity silicon oil with J1. = 96 cp (Table 2, sample A). With this high viscosity, the pore fluid motion is controlled by viscous effects. This puts us in the low-frequency region of Biot theory. Figure 8a shows Stoneley velocity versus frequency. The experimental data were digi-tized from the published figures of Winkler et al. (1989). The theoretical curve (solid curve) is calculated using Eq. (29). The theory fits the data extremely well. A copy of
(
Stoneley Wave and Permeability 133 \Ninkler et aL's (1989) results is shown in figure 8c and d. The theoretical curve shown in figure 8c goes slightly above the data points, although this is not significant for the confirmation of the theory. The dashed curve in figure 8a is the Stoneley velocity corresponding to the sealed borehole case, which is calculated from the given param-eters of the fluid-saturated sample (Table 2). This curve fits almost exactly with the original curve shown in figure 8c which is calculated with a non-permeable borehole wall. This is also the case for the remaining three examples. This fit indicates that, when the borehole wall is sealed, the formation acts like an equivalent elastic formation with effective properties given by Eqs. (33) through (36). The corresponding Stoneley attenuation data as l/Q versus frequency are shown in figure 8b. Again, the theory fits the experimental data excellently.
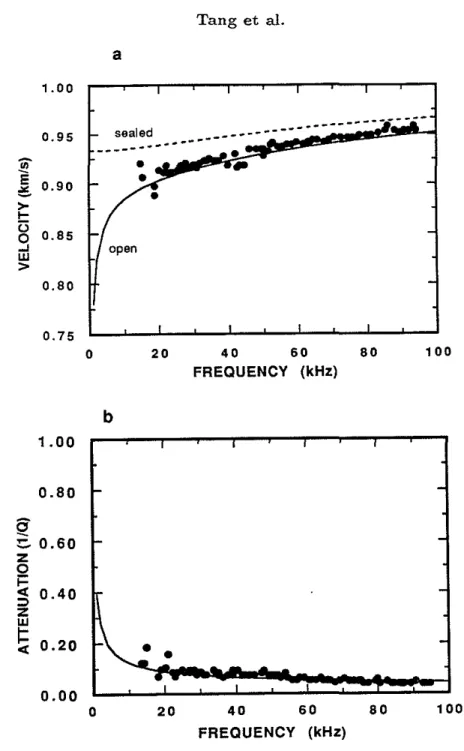
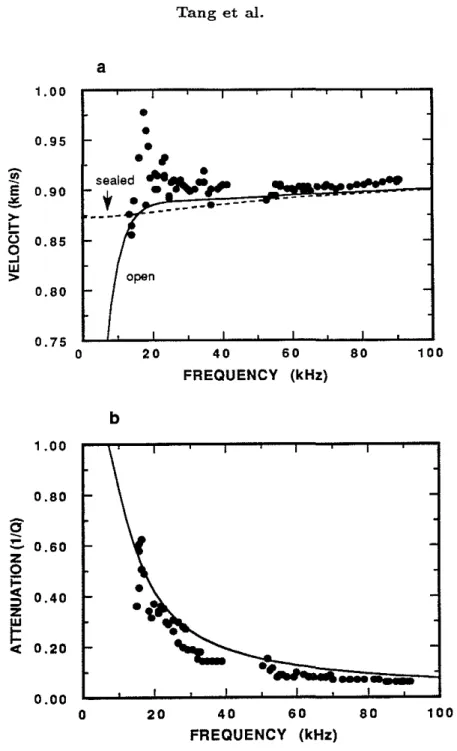
For the next example, we compare the theory and experiment for a sample saturated with low-viscosity fluid (Table 2, sample C). This low viscosity (0.818 cp) puts the experimental bandwidth in the high-frequency region of Biot theory. As seen from figure 9a, the open hole Stoneley velocity crosses the sealed hole velocity at about 17 kHz. This high-frequency behavior due to the permeability effects, as predicted by Biot-Rosenbaum theory, is seen to be also predicted by our simple model, although this crossing is less significant than what is shown on Winkler et aL's (1989) theoretical curve (figure 9c), and the high-frequency portion of our curve goes slightly below the measured data, while the curve of Winkler et al. (figure 9c) goes slightly above the measured data in the high-frequency range. The scatter of the data around 20 kHz was attributed to the mode interference due to the finite size of the sample (Winkler et aI., 1989). In spite of the scatter, the theory fits the experiment very well. For the Stoneley attenuation shown in figure 8b, both theory and experiment show the strong increase of attenuation as frequency decreases. The simple model predicts slightly higher attenuation than the theory of Winkler et aL (1989) shown in figure 9d. However, the agreement between the simple theory and experiment is still very good. The third case (Table 2, sample B) is a sample having an intermediate viscosity. This places the experimental bandwidth in the intermediate transition region of Biot theory. The velocity and attenuation data are shown in figure 10. In this case, the agreement between the theory and experiment is not as good as in the previous two examples, the same as what is shown in Winkler et aL's (1989) results (figure 10a,b). In their case, the theoretical velocity (figure 10c) crosses the data at about 35 kHz and the sealed velocity at 50 kHz. Thus it is not able to fit the data. Our simple model fits the high-frequency portion of the data, although the misfit in the low-frequ.ency portion persists. The theoretical attenuation shown in figure lOb is very close to that of Winkler et aL (1989) shown in figure 10d. But the discrepancy between the theory and experiment is significant. The discrepancies of figure 10 were attributed by \Vinkler et aL as due to the undetected heterogeneities in the sample .or perhaps due to the behaviors of the porous material in the transition region that are not well defined in Biot theory.
134 Tang et al.
The last example (Table 2, sample Berea S.S.) is a Berea sandstone saturated with silicone oil (11 = 9.34 cp). Since this is the only case where a reservoir rock was mea-sured, the results for this case are especially important, because a useful theory must eventually work in rocks. The properties of the sample given in Table 2 put the exper-imental bandwidth in the low-frequency range of Biot theory (Winkler et aI., 1989), which is relevant to most field situations. The theoretical velocity and attenuation predicted by the simple model (shown in figure lIa,b) are very close to Winkler et al.'s (1989) results (shown in figure lIc,d). For both velocity and attenuation, there is an excellent agreement between theory and experiment .
. The above examples sbow that, in general, the laboratory experimental results are m excellent agreement with the simple Stoneley propagation theory derived in this study. These examples substantially confirm the validity of the simple theory and its general applicability to porous media with different properties.
DISCUSSION
In this section, we further explore the cause of disagreement between the simple model and the Biot-Rosenbaum model in the presence of a soft formation. We will also discuss how to incorporate the effects of a borehole logging tool into our model.
In the formulation of our simple model, we split the interaction between the bore-hole propagation and the porous formation into two parts, Le., the one due to formation elasticity and the other due to pore fluid flow. By this separation, it was implied that the motion of the pore fluid flow is not strongly coupled with that of the solid. Strictly speaking, this is true only if the latter motion is small compared to the former motion. In fact, in a Biot solid, the effective moving fluid volume is proportional to the relative motion between the two phases
voc<p(Uf- U,) ,
where u. is the displacement of the solid associated with the slow wave motion. In a hard formation, or in the very low frequency range in which viscous fluid flow domi-nates (for either a hard and a soft formation case), u. is small compared touf' so that the moving volume v is dominated by the contribution from ufo This point has been demonstrated by the agreement of our model with the Biot-Rosenbaum model in the presence of a hard formation and in the low-frequency range of a soft formation case. However, in the presence of a soft formation, the increased compressibility results in a larger u" hence the relative motion Uf - u, is reduced and the effective flow volume
v decreased. In terms of borehole Stoneley waves, this means that less energy will be carried away and that the attenuation will be less severe. In the Biot-Rosenbaum theory, this coupling process is modeled in the form of coupled partial differential equa-tions. Therefore, for given porosity, permeability and pore fluid, the high-frequency
(
(
Stoneley Wave and Permeability 135 Stoneley wave attenuation for a soft formation will be less pronounced than that for a hard formation (for example, one can compare the Biot-Rosenbaum results shown on figure 3a and figure 6a). However, in our simple model, the relative motion uJ - Us is
still taken as UJ. Although the frequency dependent behavior ofUJ is accounted for by
using the dynamic permeability, which is independent of the solid elasticity (Johnson et aI., 1987), and the effects of solid elasticity on UJ have been corrected (Eq. 13), the
resulting flow volumev is still larger than it actually is because of the missing term Us'
As a result, the predicted Stoneley wave attenuation is higher than the correct result. This is indeed what we have seen in figure 6a.
In the presence of a logging tool of radius a in the borehole, our model needs two sim pie modifications. The first is the ratio of the boundary integral of"I/J"I/J, to the area integral of "I/J"I/J, in Eq. (23). Without the tool, this ratio is approximately the ratio of bore perimeter to bore area (i.e., 2/
R
in Eq. 24). With the tool, the area becomes that of the fluid annulus and Eq. (24) is now written as§s"I/J"I/J,dS 2R
ff
A"I/J"I/J,dA ~ R2 - a2Thus the resulting correction is to replace the term 2/Rin Eq. (29) with2R/(R2 - a2). Another modification is calculating the elastic formation Stoneley wave number kz ,
in conjunction with the logging tool. This procedure has been described by Cheng and Toksoz (1981). It is worthwhile to note that in a soft formation, the presence of a logging tool will push the agreement between the simple model and the Biot-Rosenbaum model to a higher frequency range, simply because the tool reduces the effective borehole area and the wave propagation is approximately similar to that of a borehole with smaller radius (Cheng and Toksoz, 1981).
CONCLUSIONS
In this study, we have applied the concept of dynamic permeability to the important problem of acoustic logging in a porous formation. We further examined the validity of the dynamic permeability using the exact dynamic conductivity in the case of a fracture and found they agree excellently. We showed that when the solid is less compressible than the fluid, the dynamic permeability, together with a simple correction for the solid elasticity, is an adequate description of the frequency-dependent pore fluid flow. Using the dynamic permeability, we have obtained a simple dynamic model for Stoneley wave propagation in permeable boreholes. We compared the model with the exact model of the Biot-Rosenbaum theory for the effects frequency, porosity, permeability, intrinsic attenuation, and formation type (hard or soft), and found that they yield practically the same result in the hard formation case. While in a soft formation, the simple model over-predicts the Stoneley wave attenuation at higher frequencies, because the
136 Tang et al.
increa.sed coupling between the solid and fluid is not fully accounted for. However, since
many important permeable reservoir rocks belong to the hard formation category, this model will be of significant applicability to the estimation of formation permeability using Stoneley wave measurements, because of its simplicity and validity in the hard formation case. Comparison with the available experimental data showed the excellent agreement between the simple model and the data and further confirmed this simple theory. A further study on this theory is perhaps the application of it to formulate an inverse problem, analyze its sensitivity to each model parameter, and finally invert for the parameters using available Stoneley measurement data.
ACKNOWLEDGEMENTS
This research was supported by the Full Waveform Acoustic Logging Consortium at M.LT. and by Department of Energy grant No. DE-FG02-86ER13636.
REFERENCES
Bamber, C. L.,and J. R. Evans, ,1967, ¢-k log (permeability definition from acoustic amplitude and porosity): Am. Inst. Min. Metalurg., Petro Eng.,Midway U.S.A. Oil and Gas Symp., Paper SPE 1971.
Biot, M.A., 1956a, Theory of propagation of elastic waves in a fluid-saturated porous solid, I: Low frequency range, J. Appl. Phys., 33, 1482-1498.
Biot, M.A., 1956b, Theory of propagation of elastic waves in a fluid-saturated porous solid, II: Higher frequency range, J. Acoust. Soc. Am., 28, 168-178.
Biot, M.A., 1962, Mechanics of deformation and acoustic wave propagation in porous media, J. Appl. Phys., 33, 1482-1498.
Chang, S. K., H. L. Liu, and D. L. Johnson, 1988, Low-frequency tube waves in per-meable rocks, Geophysics, 53, 519-527.
Cheng, C. H., and M. N. Toksoz, 1981, Elastic wave propagation in a fluid-filled bore-hole and synthetic acoustic logs, Geophysics,
46,
1042-1053.Cheng, C.H., M.N. Toksoz, and M. E. Willis, 1982, Determination ofin-situ attenuation from full-waveform acoustic logs, J. Geophys. Res., 87, 5447-5484.
Cheng, C.H., J. Z. Zhang, and D. R. Burns, 1987, Effects of in-situ permeability on the propagation of Stoneley (tube) waves in a borehole, Geophysics, 52,1297-1289.
Stoneley Wave and Permeability Darcy, R., 1856, Les fontaines publiques de la ville de Dijon.
137
Rsui, A. T., and M. N. Toksoz, 1986, Application of an acoustic model to determine in-situ permeability, J. Acoust. Soc. Am., 79,2055-2059.
Johnson, D. L., J. Koplik, and R. Dashen, 1987, Theory of dynamic permeability and tortuosity in fluid-saturated porous media, J. Fluid Mech., 176, 379-400.
Norris, A. N., 1989, Stoneley-wave attenuation and dispersion in permeable formations,
Geophysics, 54, 330-341.
Rosenbaum, J. R., 1974, Synthetic microseismograms: logging in porous formations, Geophysics, 39, 14-32.
Staal, J. J., and J. D. Robinson, 1977, Permeability profiles from acoustic logging: Presented at the 52th Ann. Fall Conf., Soc. Petro Engr. of the Am. Inst. Min. Metalurg., paper SPE 6821.
Schmitt, D. P., M. Bouchon, and G. Bonnet, 1988, Full-waveform synthetic acoustic logs in radially semiinfinite saturated porous media, Geophysics, 53, 807-823. Tang, X. M., and C. H. Cheng, 1989, A dynamic model for fluid flow in open borehole
fractures, J. Geophys. Res., 94, 7567-7576.
Tang, X. M., C. R. Cheng, and M. N.Toksoz, 1989, Stoneley wave propagation in fluid borehole with a vertical fracture, submitted to Geophysics.
White, J. E., 1983, Underground sound, Elsevier Science Pub/. Co., Inc.
Williams, D. M., J. Zemanek, F. A. Angona, C. L. Denis, and R. L. Caldwell, 1984, The long space acoustic logging tool, Trans., Soc. Prof. Well Log Analysts, 25th Ann. Log. Symp., paper T.
Winkler,K.W., R. L. Liu, and D. L. Johnson, 1989, Permeability and borehole Stoneley waves: Comparison between experiment and theory, Geophysics, 54, 66-75.
Zemanek, J., D. M. Williams, R. L. Caldwell, C. L. Denis, and F. A. Angona, 1985, New developments in acoustic logging, presented at the Indonesian Petro Assoc. 14th Ann. Conv.
r
138 Tang et al.r
Vp Vs 1> "0 Figure (m/s) (m/s) (%) (mD) 2 3800 2200 25 104 3 3800 2200 5,15,25 10, 102 , 103 4 3800 2200 15 5 3800 2200 25 103 6 2300 1200 5,15,25 10,102, 103 7 2300 1200 30Table 1: Parameters used for comparison with Biot-Rosenbaum model. Biot's struc-tural constant is
)8,
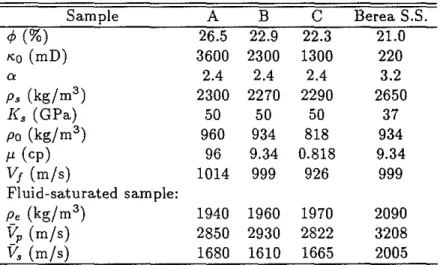
and tortuosity" is 3. Borehole and pore-fluid is water with Po = 1000 kg/m3, Vj = 1500 mis, and J1. = 0.001 Pa·s. The solid grain density Ps =2650 kg/m3 and modulus K, =37.9 GPa. The borehole radius is 10 em.Sample A B C Berea S.S. 1> (%) 26.5 22.9 22.3 21.0 "0 (mD) 3600 2300 1300 220
"
2.4 2.4 2.4 3.2 P, (kg/m3) 2300 2270 2290 2650 K s(GPa) 50 50 50 37 Po (kg/m3 ) 960 934 818 934 J1. (cp) 96 9.34 0.818 9.34 Vj (m/s) 1014 999 926 999 Fluid-saturated sample: P, (kg/m3) 1940 1960 1970 2090il
p (m/s) 2850 2930 2822 3208ii,
(m/s) 1680 1610 1665 2005Table 2: Physical properties of the samples and fluids in Winkler et al.'s (1989)
exper-iment.
Stoneley Wave and Permeability
a
139 0.2 1 0.8 0.6 >-!::>
t5
0.4 ::;)o
z
o
t.l 1 0.81:
0.6 UJ.en
:2
0.4 Coo
b
1 2 3 FREQUENCY (kHz) 10 equation (6) equation (3) 4 equation (6) equation (3) 50.:
J~:::::::;:::::::;:::=::=:=1=O:=:=:==J
o
1 2 3 FREQUENCY (kHz) 4 5Figure 1: Comparison between the complex fracture conductivities from Eq.(5) (solid curve) and Eq. (3) (dashed curve) for fracture aperture
La
equals 10,30,50, and 100 microns, as indicated on the curves. The amplitudes in (a) are normalized by their zero frequency value L5!12J1. and phases in (b) by 7r/2. Both amplitudes (a) and phases (b) of the two conductivities are in excellent agreement for all apertures and frequencies.( 140 a Tang et aI. static - 0
,
~ @ 0.8 p h a s 2 . _ - - - --
-
-
--
0.8 w--
I- E.'"
-:::>--
0.6 w >- 0.6 :::J / ~-< a. / ~'"
-
/ 0.4 ~..
0.4,
I-,
amplitude,
0.2,
I- 0.2,
,
a a a 2 4 6 8 b FREQUENCY (kHz) l.S ( , .2-~ 0 . 9 - (::-=-::-simple model)
B-A modol z/
~
0.6 -:::> z wS
~
quasi-static 0.3 dynamic a 0 2 4 6 8 c FREQUENCY (kHz) 1600 1400 - dynamic...,
---"'
1200~
g
quasi~statlc ( - - simplo model ) ~ 1000 13 - - - B-R modol ( 0 800 -... w > 600 -400 I a 2 4 6 8 FREQUENCY (kHz) ZFigure 2: Test of effects of dynamic permeability. (a) The dynamic permeability ,,(w) as a function of frequency. Its static value 1<0
=
104 mD. The amplitudeof ,,(w) (normalized by 1(0) decreases and its phase (normalized by 7r/2) increases with frequency. (b) Stoneley wave attenuations calculated using Eq. (29) .. The solid curve marked dynamic calculated usingI«w) agrees with the Biot-Rosenbaum theory, while the one marked quasi-static calculated using 1<0 significantly differs
from the theory at higher frequencies. (c) Stoneley phase velocities associated with (b). This figure shows also the agreement of the simple dynamic model with the full theory and the disagreement of the quasi-static results.
Stoneley Wave and Permeability 141
a
0.2 Hard Formation 0.156"
-:=.
simple model Z 0 0.1- - -
B-R model~
::l Z----
..
..._---W
--
..._--
---
...1=
0.05«
--
.
..
-..
_-
---0 0 2 4 6 8 10 FREQUENCY (kHz)
b
1500 Hard Formation 1400 A ... ...-_
..
.---
.,
..
,-
E-
>-
1300 !:: U simple model 0 ...J w B-R model>
1200 11 00+-.,...,r--...
- " ' T ' " -...-,...,.-..,...--r---!
o
2 4 6 FREQUENCY (kHz) 8 10Figure 3: Comparison between the simple dynamic model (solid curves) and the Biot-Rosenbaum model (dashed curves) for three different (hard) formations (see Table 1) in the frequency range of [0-10] kHz. In both (a) and (b), curves A are for a formation with ¢
=
0.05 and 1<0=
10 mD, curves B are for ¢=
0.15 and 1<0=
100 mD, and curves C are for ¢=
0.25 and 1<0=
1000 mD. Both the Stoneley attenuation (a) and phase velocity (b) show the good agreement of the two models.142 Tang et al.
a
0.1 S . .- - - . . . . , Hard Formationz
o
~
::J Z w5
0.1 O.OSo
o
b
1 LOG simple model B-R model=-::::---2 permeability (mOl 3 1S00 , . . - - - , simple model 14S0 -
- - -
B·R modal (ij'-
E-
5kHz>
1400l-e:;
--...---0 2 kHz -I
w
~
>
1350-'~
Hard Formation 1300 I I 0,
2 3LOG permeability (mOl
Figure 4: Comparison of the simple model with the Biot-Rosenbaum model versus permeability "0 for different frequencies. The formation is a sandstone with
1>
= 0.15. (a) Stoneley wave attenuation as a function of frequency. (b) Stoneley wave phase velocity as a function of frequency. In both (a) and (b), the two models agree quite well. Note that in (b) the simple model can even model the the slight increase of velocity with permeability (see 5 kHz curve), a complex feature predicted by the Biot-Rosenbaum theory.I I I I simple model f-
---
B-R model-/
total---
--- f-intrinsic I I I I 0.3--0
-
0.2...
-Z0
!;:
;:) Z 0.1 W1=
«
0o
Stoneley Wave and Permeability
2
4 6 8
FREQUENCY (kHz)
10
143
Figure 5: Comparison between the two models in the presence of intrinsic attenuation for a hard formation with </> = 0.25 and KO = 1000 mD. Intrinsic Q values are
Qp
=
100,Qs
=
50, andQf
=
20. The total attenuation of the simple model (solid curve) and that of the Biot- Rosenbaum model (dashed curve) are the sum of the intrinsic attenuation curve and their respective predicted attenuations due to fluid flow. The two results agree well.144
a
Tang et al. 0.2 Soft FromationQ
0.15.
:!:. • simple model Z •• B-R model 0..
-i= 0.1.
«
•• ::l..
Z •.
w.
,
S
0.05 B,
,
, '. " , ...-
-..--- ..
' " -" 0 ----0 1 2 3 4 5 6 FREQUENCY (kHz)b
1200 1100 ~§.
>-
1000fo-13
0 ..J W 900>
800 _A Soft Formation B--If
".
-'.
C".--- -"'-...----
-"'--..._-
---
---
..._--
...f
--. -'-----
.. -
---
...-simple model
--
- -
B-R model I I I I Io
1 2 3 4 FREQUENCY (kHz) 5 6Figure 6: Comparison of the two models versus frequency for three different soft for-mations (properties given in Table 1). In both (a) and (b), curves A are for a formation with 4>
=
0.05 and 1<0=
10 mD, curves B are for 4>=
0.15 and 1<0=
100 mD, and curves C are for 4> = 0.25 and 1<0 = 1000 mD. In (a), the attenuations from the simple model (solid curves) coincide with those from the Biot-Rosenbaum model at low frequencies, but differ from them at higher frequencies. In (b), the velocities from the two models agree fairly well for low permeability Cases A and B. For high permeability case C, two models differ at higher frequencies.Stoneley Wave and Permeability 145 Soft Formation - - - simple model - - - B-R model
a
0.15 0.12 Q:::.
0.09 Z 0 i= <I: 0.06 ::::l Z W~
0.03 0 0b
1 LOG---:.---2 permeability (mO) 3 1200 1150 ~ 1100
.§.
>-f0-e:;
1050 0 - l W>
1000 950 Soft Formation-
simple model-
- -
B-R model -1 kHz-
2 kHz-
..
- -...---~---5kHz
-
---I I
o
1 LOG 2 permeability (mO) 3Figure 7: Comparison of the two models versus permeability for a soft formation case. The formation has a porosity of 30 percent. In (a), the Stoneley attenuations from the simple model (solid curves) differ from those from the Biot-Rosenbaum model, especially at higher permeabilities and frequencies. In (b), the Stoneley velocities from the two models fit at low permeabilities, but begin to differ as permeability Increases.
146 Tang et al.
a
1.00 I I I 0.95 f- sealed.-
..
-- --_.---_._---~-~-...---
••
:@'•
_.
..
c
-
•
-:!!S 0.90
•
> l-t) 0.85 -0 ..J open W > 0.80 -I I I 0.75 0 20 40 60 80 100FREQUENCY
(kHz) (b
1.00 I,
I,
0.80-
-
(§
-::. 0.60-z
0 f=-c( 0.40 ::>
z
w1=
0.20r~
-c(•
•
-0.00 I 0 20 40 60 80 100FREQUENCY
(kHz)Figure 8: Stoneley velocity (a) and attenuation (b) versus frequency for sample A. Dots are experimental results. Solid curves are theoretical predictions from the simple model. The dashed curve (a) is Stoneley velocity corresponding to a sealed borehole wall. Original results of Winkler et al. (1989) are also given in (c) and (d) of this figure.
Stoneley Wave and Permeability
c
---nonpermeable ---0.95 -----~
----a
e-
0.90 >- f0-G 0.85 permeable 0'"'
r<l>
0.80 0.75,-O~---2T"O----~T"o----eTo---~6:rO:----:-jl00
FREQUENCY (kHz)d
oJO---=~2~O~~::::~~o~~=:e;O=:::=:B~'O===::=I100
FREQUENCY (kHz) 117148 Tang et al.
a
1.00,
I I•
•
0.95 l-•
-•
# ~ _ sealed~~:~
-
,,'c"
E 0.90 ,;£"
.
..-_.--
'.
-..
----
...
--->..
- --I-13
0.85 I- -0 -'W > open 0.80 I- -0.75 I I 1 1 0 20 40 60 80 100FREQUENCY
(kHz) b 1.00 0.80Q
-
0.60-
Z 0~
0.40 ~ Z w~
0.20<
••
-0.00 0 20 40 60 80 100FREQUENCY
(kHz)Figure 9: Stoneley velocity (a) and attenuation (b) versus frequency for sample C. Dots are experimental results and solid curves are theoretical predictions. The dashed curve is the sealed-hole Stoneley velocity. Winkler et a!.'s (1989) results are shown in (c) and (d).
c
Stoneley Wave and Permeability 140
0.95
-..,.
•
j
:\""',
..:.
0.90:-
A.
~------~
---~--->-
---
.---.---- nonpermeable!::
to>0.85-8
""l>
0.80 permeable 0.75 0 20 40 80 80 100 FREQUENCY(kHz)
d
1 ~ 0.8~
-~i15
0.8-~
• 0 0.4 • Z ""l~
0.2 0 0 20 40 80 80 100 FREQUENCY(kHz)
Figure 10: Stoneley velocity (a) and attenuation (b) versus frequency for sample B. Dots are experimental results and solid curves are theoretical predictions. The dashed curve is the sealed-hole Stoneley velocity. The data are in the transition region of Biot theory. Winkler et a!.'s (1989) results are shown in (c) and (d).
Stoneley Wave and Permeability 1.51
![Figure 3: Comparison between the simple dynamic model (solid curves) and the Biot- Biot-Rosenbaum model (dashed curves) for three different (hard) formations (see Table 1) in the frequency range of [0-10] kHz](https://thumb-eu.123doks.com/thumbv2/123doknet/14754340.581765/25.918.187.670.107.868/figure-comparison-simple-dynamic-rosenbaum-different-formations-frequency.webp)