HAL Id: insu-01636632
https://hal-insu.archives-ouvertes.fr/insu-01636632
Submitted on 7 Sep 2020
HAL is a multi-disciplinary open access
archive for the deposit and dissemination of
sci-entific research documents, whether they are
pub-lished or not. The documents may come from
teaching and research institutions in France or
abroad, or from public or private research centers.
L’archive ouverte pluridisciplinaire HAL, est
destinée au dépôt et à la diffusion de documents
scientifiques de niveau recherche, publiés ou non,
émanant des établissements d’enseignement et de
recherche français ou étrangers, des laboratoires
publics ou privés.
Seasonal Changes In Hydrogen Escape From Mars
through Analysis of HST Observations of the Martian
Exosphere Near Perihelion
D. Bhattacharyya, J. T. Clarke, Jean-Yves Chaufray, M. Mayyasi, Jean-Loup
Bertaux, M. S. Chaffin, N. M. Schneider, G. L. Villanueva
To cite this version:
D. Bhattacharyya, J. T. Clarke, Jean-Yves Chaufray, M. Mayyasi, Jean-Loup Bertaux, et al.. Seasonal
Changes In Hydrogen Escape From Mars through Analysis of HST Observations of the Martian
Exosphere Near Perihelion. Journal of Geophysical Research Space Physics, American Geophysical
Union/Wiley, 2017, 122 (11), pp.11,756-11,764. �10.1002/2017JA024572�. �insu-01636632�
Seasonal Changes in Hydrogen Escape From Mars Through
Analysis of HST Observations of the Martian
Exosphere Near Perihelion
D. Bhattacharyya1 , J. T. Clarke1 , J. Y. Chaufray2, M. Mayyasi1 , J. L. Bertaux2, M. S. Chaffin3, N. M. Schneider3, and G. L. Villanueva4
1
Center for Space Physics, Boston University, Boston, MA, USA,2LATMOS, Guyancourt, France,3LASP, University of Colorado Boulder, Boulder, CO, USA,4Goddard Space Flight Center, Greenbelt, MD, USA
Abstract
Hubble Space Telescope (HST) observations of the Martian hydrogen exosphere in Lymanα are presented in this paper for a period when Mars passed perihelion and southern summer solstice in its orbit. The peak intensity in the exospheric Lymanα brightness was recorded after Mars went past its perihelion, slightly after southern summer solstice. The increase in brightness as Mars approached perihelion was found to not be symmetric around the peak, making it impossible tofit the H escape flux trend with a single sinusoidal curve with the peak at perihelion. While the short-term (~30 Earth days) changes were not directly correlated with changes in the solar Lymanα flux, the long-term (~10 Earth years) trend in the data does show some correlation with solar activity. This suggests that the short-term changes brought about in the exosphere could be due to intrinsic changes occurring within the lower atmosphere. For example, thermospheric heating by dust can alter the cold-trapping mechanism for water vapor resulting in it being present in large quantities at higher altitudes (60–80 km), possibly enhancing the escape flux of H. Therefore, it is important to understand the drivers of atmospheric dynamics in the Martian atmosphere, which produce the yearly enhanced seasonal changes observed at Mars around periapsis and southern summer solstice in order to accurately determine the total amount of water lost over its history.1. Introduction
The Martian hydrogen exosphere is much more dynamic than was thought after the era of Mariner explora-tion in the early 1970s (Bhattacharyya et al., 2015; Chaffin et al., 2014; Clarke et al., 2014). Seasonal changes in the escape of hydrogen from Mars have been discovered in the last decade, adding another dimension to reconstructing the timeline of water escape through Mars’ history of evolution. It is imperative to understand the underlying factors triggering the seasonal trends observed in the hydrogen escapeflux to determine the total amount of water on Mars nearly 4.2 billion years ago. Tracing the history of water on Mars would help understand the conditions required to sustain the presence of liquid water on planets in general.
Hunten (1973) first calculated that the escape of hydrogen atoms from the Martian exobase (altitude ~200 km) is diffusion limited. In this view the density of hydrogen at the exobase adjusts such that the escape flux from the exobase is consistent with the upward flux from lower altitudes. Krasnopolsky (2002) combined this theoretical interpretation with the fact that most of the H is transported into the exosphere from lower altitudes in the form of H2, which has a slow diffusion rate as well as a longer lifetime, to suggest that the escapeflux of H from the atmosphere of Mars should almost be a constant, without much seasonal variation. Therefore, once this“constant” number has been determined it could be used to extrapolate back in time to calculate the total amount of water that Mars has lost over time.
Observations of Mars conducted in the past decade to constrain H escape found that the theoretical scenario of a constant escapeflux of H from Mars is no longer valid (Bhattacharyya et al., 2015; Chaffin et al., 2014; Clarke et al., 2014). Thefirst reported observations of Mars that disproved the diffusion-limited flux scenario were conducted by the Hubble Space Telescope (HST) in the far ultraviolet (FUV) during October–November 2007, during which a ~40% decrease in Lymanα brightness was seen within a period of ~4 weeks (Clarke et al., 2009, 2014). The Lymanα emission consists of solar photons resonantly scattered by the H atoms pre-sent in the exosphere of Mars. Over a longer period (July–December 2007) overlapping with the HST obser-vations, the SPICAM instrument on board Mars Express (MEX) also observed a steady decrease in Lymanα brightness from the exosphere of Mars (Chaffin et al., 2014). It was difficult to distinguish if this observed
Journal of Geophysical Research: Space Physics
RESEARCH ARTICLE
10.1002/2017JA024572
Special Section:
Mars Aeronomy
Key Points:
• HST observations conducted as Mars passed perihelion and southern summer solstice
• Peak hydrogen escape flux detected at or after southern summer solstice • Hydrogen escape dependent on solar
activity, atmospheric dynamics, and velocity distribution of hot atoms
Correspondence to:
D. Bhattacharyya, dolonb@bu.edu
Citation:
Bhattacharyya, D., Clarke, J. T., Chaufray, J. Y., Mayyasi, M., Bertaux, J. L., Chaffin, M. S., … Villanueva, G. L. (2017). Seasonal changes in hydrogen escape from mars through analysis of HST observations of the Martian exosphere near perihelion. Journal of Geophysical Research: Space Physics, 122, 11,756–11,764. https://doi.org/10.1002/ 2017JA024572
Received 7 JUL 2017 Accepted 8 NOV 2017
Accepted article online 13 NOV 2017 Published online 22 NOV 2017
©2017. American Geophysical Union. All Rights Reserved.
change in Lymanα brightness from the Martian exosphere was a result of seasonal changes or changes in the atmospheric temperature and density due to a global dust storm that took place in June 2007. Further modeling efforts and more HST observations conducted in the year 2014 pointed toward the trends being seasonal in nature (Bhattacharyya et al., 2015; Chaufray et al., 2015).
At present multiple direct and indirect observations of the hydrogen population present in the exosphere of Mars have found density changes associated with seasonal effects. The Ion Mass Analyzer on MEX found the distribution of pickup ions outside the bow shock to be quite different between perihelion and aphelion of Mars’ orbit (Yamauchi et al., 2015). Analysis of pickup ions measured by the Solar Wind Ion Analyzer (SWIA) and Supra-Thermal and Thermal Ion Composition instruments on board the Mars Atmosphere and Volatile EvolutioN (MAVEN) spacecraft revealed an order magnitude change in the neutral hydrogen density profile with seasons (Rahmati et al., 2017). Halekas et al. (2017) also found an order of magnitude seasonal change in exospheric hydrogen column density by analyzing SWIA measured penetrating protons. Other observations of proton cyclotron waves excited by hydrogen pickup ions upstream from Mars by the magnetometer and their relationship with the solar extreme ultraviolet (EUV)flux measured by the Extreme Ultraviolet Monitor (EUVM) on board MAVEN show higher occurrence rates when Mars is close to perihelion than at other times of the year (Romanelli et al., 2016). Direct observations of the Lymanα emission by the IUVS on board MAVEN both in the FUV imaging mode and the echelle mode (Mayyasi et al., 2017; McClintock et al., 2015) also showed substantial temporal and spatial variability as Mars moved around the Sun (Chaffin et al., 2015; Clarke et al., 2017).
Several models have been developed to chart out the seasonal variations in the hydrogen escapeflux at Mars and to understand the contributing factors behind these observed changes. The optically thick Lymanα emission measurements of the Martian hydrogen corona have been modeled using a radiative transfer model (Anderson & Hord, 1971; Bhattacharyya et al., 2017; Chaffin et al., 2014; Chaufray et al., 2008) in order to calculate the escapeflux of H from Mars with seasons. Modeling the SPICAM observations taken over a per-iod of 6 months in the later half of 2007 (July–December) revealed almost roughly an order magnitude decrease in hydrogen escapeflux due to seasonal changes, as Mars moved away from the Sun (Chaffin et al., 2014). Similar changes were also observed with HST in 2014 when the hydrogen escapeflux steadily increased in magnitude as Mars moved toward its perihelion position (Bhattacharyya et al., 2015). Simulations with the Mars Global Circulation Model from Laboratoire de Météorologie Dynamique (MGCM-LMD) concluded that changes in extreme ultraviolet (EUV)flux from the Sun due to changing Mars-Sun dis-tance coupled with upper atmospheric dynamics would result in seasonal changes resembling a sinusoid in logarithmic space for the escapeflux of H from Mars, with the peak at perihelion (Ls= 251°) (Chaufray et al., 2015). The MGCM-LMD model predicts seasonal changes of a factor of 5 due to EUV heating of the thermo-sphere. However, the variations in H escapeflux predicted by the model were lower than that observed by HST in 2014 (Ls= 138°–232°) (Bhattacharyya et al., 2015), suggesting that changing EUV flux might not be the only contributor toward the observed seasonal behavior of H escape from Mars.
The substantial changes in Lyman intensityα intensity observed over short period of time of ~1 month by MEX, HST, and MAVEN have been thought to be associated with the presence of large amounts of water vapor at high altitudes, detected by Mars Express, especially when Mars is approaching perihelion and south-ern summer solstice (Fedorova et al., 2009; Maltagliati et al., 2013). The effect of introducing considerable amount of water vapor at high altitudes on the escapeflux of H from the exosphere of Mars has been recently studied using a one-dimensional time-dependent photochemical model by Chaffin et al. (2017). They find that water vapor at high altitudes can produce a large increase in H escape rate on a time scale of weeks prompting the conclusion that H escape from Mars may be dominated by this process. The HST observations (Bhattacharyya et al., 2015), SPICAM observations (Chaufray et al., 2008), and MAVEN observations during orbit insertion (Chaffin et al., 2015) of the Martian exosphere also hinted at the possibility of the existence of a nonthermal population of hydrogen at Mars. This population seems to display a seasonal behavior, with increased density near perihelion (Bhattacharyya et al., 2017).
The observations of the Martian hydrogen exosphere conducted in the past decade do not cover the full range of the seasonal trend in hydrogen escape with numerous gaps in the temporal coverage over a Martian year. This makes it difficult to determine the total amount of water that has escaped from Mars, which is the main goal for studying Martian hydrogen escape. Therefore, it is essential to characterize the seasonal
behavior over different solar longitudes for different solar conditions to fully understand the factors that cause seasonal changes in the hydrogen corona at Mars. This, in turn, will help trace the timeline for water loss from Mars over its evolution history and allow a more accurate determination of total amount of water harbored by Mars ~4.2 billion years 160 ago.
In this paper we present HST observations of the Martian exosphere during a period when Mars passed peri-helion (Ls= 251°) as well as southern summer solstice (Ls= 270°) in its orbit. Earlier observations with HST in 2014 indicated a steady increase in intensity as Mars approached perihelion, but there were no observations after Ls= 232° to determine the time of peak intensity in the Lymanα brightness of the Martian exosphere or the shape of the brightness curve with time. The current observations cover that gap in data as Mars passed perihelion and southern summer solstice coverage and provide an insight into the behavior of the Martian exosphere during this time. One advantage of using HST over Mars-orbiting satellites is that it presents a more comprehensive view of the global structure, with coverage up to altitudes of ~30,000 km favoring the study of the high-energy population dominant at the higher altitudes. We model the observations with a radiative transfer model (Bhattacharyya et al., 2017) in order to trace the hydrogen escapeflux over this time period as Mars passed through the distance of closest approach to the Sun. Section 2 describes the observations presented in this paper. Section 3 briefly summarizes the modeling procedure. Section 4 discusses the results of the data analysis, and section 5 discusses the implications of thefindings inferred from this dataset.
2. HST Observations of Mars
The Hubble Space Telescope’s (HST) Advanced Camera for Surveys instrument was used to observe the Lymanα emission from the hydrogen atoms present in the exosphere of Mars. These observations were con-ducted in a series offive separate visits starting in September 2016 and ending in January 2017. The gap between each pair of visits was ~1 month. During this time Mars moved from Ls~ 226.3° to 302.1° and the Earth-Mars distance varied from 1 AU to 1.76 AU. The details of the observations are listed in Table 1. With the Mars disc placed in one corner of thefield of view, a large portion of the dayside exosphere was imaged during the HST observing campaign (Figure 1). An earlier observation of Mars conducted with HST on 3 December 2015 with Mars close to its aphelion position (Ls~ 76.4°) has also been included in this paper. The HST data reduction process has been described extensively in earlier publications about studies of the Martian exosphere with the same type of HST data (Bhattacharyya et al., 2015, 2017; Clarke et al., 2014). The calibration factor used for the HST data presented in this paper is 0.002633 counts pixel 1s 1kR 1 for consistency with prior observations (Bhattacharyya et al., 2017). The main goal of these observations is to trace the seasonal behavior of the hydrogen exosphere as Mars passed perihelion (Ls~ 251°) and southern summer solstice (Ls~ 270°).
Table 1
Observational Conditions and H Escape Flux Values for All HST Observations
Date/day of observation
Earth-Mars distance
(AU) Ls F10.7index
One componentϕJeans
(×108cm 2s 1)
Two componentϕJeans
(×108cm 2s 1) 1 October 2007/288 0.87 331° 68.1 2.99 ± 0.12 5.98 ± 0.3 27 October 2007/300 0.80 337.6° 67.1 1.94 ± 0.08 4.25 ± 0.1 9 November 2007/313 0.72 344.7° 68.1 1.6 ± 0.06 3.77 ± 0.07 30 May 2014/150 0.78 138° 103.3 1.28 ± 0.2 2.35 ± 0.22 15 September 2014/258 1.46 196.8° 121.5 3.36 ± 0.25 6.06 ± 0.55 5 October 2014/278 1.56 208.5° 112 5.23 ± 0.37 9.36 ± 0.84 20 October 2014/293 1.63 217.7° 208 6.6 ± 0.37 12.2 ± 1.0 12 November 2014/316 1.74 232° 169.6 8.35 ± 0.37 15.0 ± 1.0 3 December 2015/337 1.95 76.4° 103.9 1.56 ± 0.25 2.73 ± 0.95 20 September 2016/264 1.0 226.3° 84.7 4.15 ± 0.34 8.43 ± 0.77 21 October 2016/295 1.19 246.1° 77.9 4.30 ± 0.12 9.23 ± 0.71 19 November 2016/324 1.37 264.6° 79 6.10 ± 0. 5 14.19 ± 1.72 19 December 2016/354 1.57 283° 72.5 8.84 ± 0.63 21.59 ± 2.3 19 January 2017/019 1.77 302.1° 83.1 6.85 ± 0.5 15.81 ± 1.71
Figure 2 shows the radial intensity profiles of the Lyman α emission with altitude of the Martian hydrogen exosphere. These profiles have been constructed by averaging all the pixels located at similar radial distances from the center of the planet over a range of ±45° around the subsolar point (Figure 1). This angle of ±45° has been chosen for good signal-to-noise ratio in the data. As is seen in Figure 2, the inten-sity increased and reached its peak value somewhere between November 2016 and January 2017. It should also be noted that the increase in intensity of the Lymanα emission from the Martian exo-sphere was not symmetric about the maximum in time, as the intensity profile from the first two observations in 2016 (20 September and 21 October) lie almost on top of each other (Figure 2). There is also signif-icant variation in the slope of the curves. For example, as shown in Figure 2, the slope of the intensity profile for 19 November 2016 is higher than the slope of the 19 December 2016. The difference between the two curves is much smaller at lower altitudes (<5,000 km) and gradually grows at higher altitudes (>8,000 km). The shape of the profile provides information about the thermal (dominant at lower altitudes) and the superthermal component (dominant at higher altitudes) and their density changes due to seasonal variations. It is highly likely that the superthermal population is a mixture of more than one Maxwellian or has a completely non-Maxwellian distribution altogether (Gröller et al., 2015; Shematovich, 2013).
3. Calculating the H Escape Flux at Mars
The intensity profiles of the Lyman α emission from the distribution of hydrogen atoms in the Martian exosphere were modeled using a radia-tive transfer model (Bhattacharyya et al., 2017). The Lymanα emission is optically thick and multiple scatter-ing effects within the corona have to be accounted for in order to model the observed intensity accurately (Anderson, 1974; Anderson & Hord, 1971). Two types of models were used to simulate the data, one with only a single thermal population of hydrogen (one-component model) and another with a thermal and a super-thermal population of hydrogen (two-component model) in the exo-sphere of Mars. These models have been discussed in detail in Bhattacharyya et al. (2015, 2017). The bestfit model results to the data determined by minimizingχ2deviations between data and model, put constraints on the temperature and density of the hydrogen atoms at the exobase of Mars, taken to be at an altitude of 200 km in the model. These temperature and density values have then been used to calcu-late the Jeans escapeflux of hydrogen, which is considered to be the primary process of escape for H from Mars (Hunten, 1973, 1982). The uncertainty in the hydrogen escapeflux for each observation has been calculated by determining all the model runs that producefits which lie withinχ2min+ 1. The bestfit temperature and density values for the most recent HST observations presented in this paper are listed in Table 2 along with the corresponding Jeans escapeflux of H from the exobase of Mars in Table 1. Figure 3 shows the modelfits to the HST data. As is seen in the figure, for the September, October, and the November 2016 data, both the one-component and the two-component models do not provide goodfits. This is likely because the physics driving the superthermal population (Gröller et al., 2015; Shematovich, 2013) is not well represented within the model, which assumes a single Maxwellian distribution at a temperature of 800 K for the energetic atoms. This temperature of 800 K for the
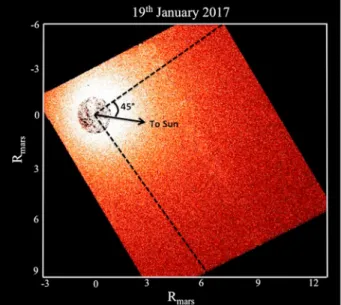
Figure 1. A reduced HST image of Mars taken on 19 January 2017, mapping the Lymanα emission from the hydrogen atoms present in the exosphere of Mars. The Sun is located on the right in this image. The dark circle in the top left of the image is the disk of Mars. It appears noisy as the reduction method involves the difference of twofiltered images, one that allows Lyman α (121.567 nm) and one that does not. Since the disk of Mars has other emissions, the small difference between two large values results in noise at the disk. However, above 1.2 Rmarsall the emission is Lymanα. The Lyman α intensity profile from this
image is created by averaging pixels at same radial distances within the ±45° angle around the subsolar point as shown in thisfigure.
Figure 2. Radial intensity profiles of the Lyman α emission with altitude for the exosphere of Mars. Notice that the brightness increase is not symmetric with time as seen in the overlapping intensity profiles observed at solar longitudes Ls= 226° (20 September 2016) and Ls= 246° (21 October 2016). The peak
brightness is somewhere between Ls= 264° (19 November 2016) and Ls= 302°
(19 January 2017), as indicated by the decrease in intensity after Ls= 283° (19
December 2016). The observation at Ls= 76° (3 December 2015) was conducted
when Mars was close to its aphelion, just past northern summer solstice.
Table 2
Model Fit Parameters for HST 2015–2017 Observations
Date/day of observation
F0× 1011
(photons/cm2/s/Å)
One component Two component
Texo(K) Nexo(cm 3) Tcold(K) Ncold(cm 3) Nhot(cm 3)
3 December 2015/337 1.356 435 13,000 ± 2,000 210 33,000 ± 3,000 5,400 ± 2,000 20 September 2016/264 1.740 425 37,000 ± 3,000 200 79,000 ± 4,000 17,100 ± 1,600 21 October 2016/295 1.646 430 37,000 ± 2,000 200 75,000 ± 3,000 18,800 ± 1,500 19 November 2016/324 1.652 440 49,000 ± 4,000 220 88,000 ± 7,000 28,600 ± 3,600 19 December 2016/354 1.612 440 71,000 ± 5,000 210 137,000 ± 13,000 43,900 ± 4,800 19 January 2017/019 1.592 440 55,000 ± 4,000 200 101,000 ± 12,000 32,400 ± 2,900
Figure 3. The best one-component and two-component modelfits to the data for all the HST 2015–2017 observations. The model profiles lie almost on top of each other when Mars was far away from the Sun (3 December 2015). The two-component model does a better jobfitting the data as Mars moved closer to the Sun but is unable to fit the data perfectly. This could be because there is more than one superthermal population, depending on the source processes that generate them with a non-Maxwellian velocity distribution. The model assumes a single Maxwellian distribution of 800 K for the nonthermal population, which is not a completely accurate description of the physics.
superthermal population has been chosen to maintain the consistency with the analysis of previous HST observations (Bhattacharyya et al., 2015, 2017), so that the seasonal trend in the escapeflux of H could be established using the entire HST data set. This temperature is well within the range of possible temperatures derived for the superthermal population using Mars Express observations (Chaufray et al., 2008). More sophis-ticatedfits to the hot component are being pursued outside the scope of this paper.
There are several factors that increase the uncertainty in determining the escapeflux of H from Mars. These include the potential presence of a nonthermal population whose characteristics are unknown at this time and which is the largest contributor to the uncertainty in the H escapeflux from Mars (Bhattacharyya et al., 2017), degeneracy between the temperature and density values obtained from the radiative transfer model (line of sight intensity can be increased by either increasing the number of scatterers, that is, density, or increasing the temperature of the population which scatters more of the solar Lymanα line due to a broa-dened line profile) for both the thermal and the nonthermal population, uncertainty in the absolute calibra-tion of the observing instrument, and various assumpcalibra-tions that have been made about the intrinsic characteristics of the Martian exosphere in the modeling process. These factors have been discussed in detail in Bhattacharyya et al. (2017), an analysis that is not repeated here. In this paper we focused on the trends in the data, which is significant enough to be detectable above the noise, and which will help us to better understand the driving forces behind the seasonal changes in the Martian hydrogen exo-sphere, as well as steer the direction of future modeling efforts.
4. Variability of Hydrogen Escape From the Exosphere of Mars
The biggest motivation for studying hydrogen escape from the Martian exosphere is to determine the total amount of water lost by Mars throughout its history of evolution. One-dimensional (1-D) photochemical models show that most of the hydrogen present in the Martian corona comes from the photodissociation of water vapor near the surface of Mars (Hunten & McElroy, 1970; McElroy & Donahue, 1972; Parkinson & Hunten, 1972). These models predicted that the escape of H from the exosphere of Mars should be diffusion limited (Hunten, 1973; Krasnopolsky, 2002). However, seasonal variations in H escape were observed at Mars thereby disproving the diffusion-limited theory (Bhattacharyya et al., 2015; Chaffin et al., 2014; Clarke et al., 2014). It is important to characterize this seasonal behavior in H escape and understand the factors in fluen-cing it in order to accurately calculate the total amount of water lost from Mars.
The HST observations of the Martian corona presented in this paper have been helpful toward tracing the seasonal behavior of the hydrogen exosphere at Mars. These observations were conducted when Mars was moving between Ls~ 226.3° to 302.1° passing perihelion (Ls~ 251°) and southern summer solstice (Ls~ 270°), a section of the orbit which lacked coverage in the earlier data sets.
The HST observations show that the peak intensity in the Martian exospheric Lyman α emission was achieved after southern summer solstice rather than at perihelion (Figure 2), a trend also mimicked by the hydrogen escapeflux (Figure 4) determined from the single and the two-component analysis of the data. The peak in H escapeflux was also observed to be around southern summer solstice using data from the SWIA instrument on board the MAVEN spacecraft (Halekas, 2017). MGCM-LMD model, on the other hand, predicted peak H escapeflux at perihelion based on atmospheric dynamics driven by variations in EUVflux due to changing Mars-Sun distance (Chaufray et al., 2015). The model includes a “classic” dust scenario corresponding to Mars Global Surveyor (MGS) observations of dust opacity during Martian year 27 and does not consider dust storm conditions, which are prevalent during the onset of southern summer at Mars. The introduction of water vapor at high altitudes could result in an enhanced escape of water over a time scale of weeks because water vapor at high altitudes can be directly photodissociated by EUV light creating H atoms, which can then escape (Chaffin et al., 2017). SPICAM observations conducted during the 2007 global dust storm found a good correlation between aerosol vertical extension and increased water vapor content (4 to 5 times) at altitudes between 60 and 80 km between Ls= 268° and 285° for the south-ern hemisphere (Fedorova et al., 2017).
During the 20 September and 21 October 2016 observations, the intensity of the Martian exospheric Lymanα emission varied by less than 1%, with the corresponding H escapeflux values remaining almost the same (Figure 4). This breaks the symmetry of a sinusoidal variation from seasonal changes as reported earlier in Bhattacharyya et al. (2015). From Tables 1 and 2 it is evident that the solar Lymanα flux was almost a
constant (changes less than 9%) between 20 September 2016 and 19 January 2017, whereas the H escapeflux varied by a factor of ~2.5 over that time period. This indicates that the seasonal variation in H escape works on a much shorter time scale than the variation of Lymanα flux from the Sun. Therefore, there are other intrinsic factors at play, one of them being the presence of water vapor at high altitudes, which could shorten the time scale of seasonal changes in H escape as observed. The increased water vapor content (2–3 times) at high altitudes (50–80 km) detected by SPICAM on Mars Express (Fedorova et al., 2009; Maltagliati et al., 2013) even in the absence of a dust storm (Fedorova et al., 2017) would bypass the slow and long transport of H via H2and support the short-term changes in the quantity of H avail-able for escape from the exobase (Chaffin et al., 2014; Clarke et al., 2014). The viability of this process has been demonstrated in a photo-chemical model (Chaffin et al., 2017). Recently predicted water density profiles through photochemical modeling using data on protonated species (OH+, H2O+, and H3O+) present in the atmosphere of Mars mea-sured by the Neutral Gas and Ion Mass Spectrometer (NGIMS) on board MAVEN quote values for the mixing ratio of water vapor at 80 km to be ~0.4 parts per billion (Fox et al., 2015), which is much lesser than mea-surements by MEX which go up to few tens of parts per million at those altitudes (Maltagliati et al., 2013). However, the photochemical model study suggests that the amount of water vapor that could be present at high altitudes cannot be very high due to the presence of substantial amounts of HCO+in the same region of thermosphere as detected by NGIMS, which would otherwise be destroyed by H2O through proton transfer reactions (Fox et al., 2015). Therefore, the amount of H2O is bracketed by the quantity of H3O+and HCO+present in the Martian thermosphere (Fox et al., 2015).
Mars Global Circulation Modeling (MGCM) suggests that the density of hydrogen at the exobase could vary up to an order of magnitude throughout a Martian year due to variations in the incident solar EUV flux from the changing Mars-Sun distance because of atmospheric dynamics (Chaufray et al., 2015). Changes in solar EUVflux are much larger and more variable than the changes recorded for the solar Lymanα flux at line center. The MGCM modeling study also indicated that there could be diurnal variations in hydrogen density with a peak in the dawn region during equinoxes and a peak on the nightside during solstices. Therefore, atmospheric dynamics driven by solar EUV activity could play a major role in facilitating the short-term seasonal trend in H escape found in the data.
A study on the effect of solar activity on H escape is also presented in this paper by combining all the derived H escapefluxes from all the HST observations of the Martian corona to date (Figure 4). The HST observations were conducted over different solar activity periods. Two of the observations almost overlap in solar longitudes but were conducted during different solar activity conditions. The HST observation of Mars conducted on 12 November 2014 (Ls~ 232°, Martian year 32) was during high solar activity with an F10.7~ 170, whereas the HST observation of Mars conducted on 20 September 2016 (Ls~2 26.3°, Martian year 33) was during low solar activity with an F10.7~ 85. The Martian exospheric Lymanα intensity was much brighter (38%) and the corresponding H escapeflux greater (101% for the one-component model and 77% for the two-component model) for the 2014 observation at high solar activity than the 2016 obser-vation at low solar activity, even though Mars was almost at the same position in its orbit around the Sun for both the observations as shown in Figure 4. This suggests that the observed seasonal changes in the hydrogen exosphere of Mars have some correlation with solar activity with regard to long-term changes in the hydrogen exosphere. However, the short-term seasonal changes are more likely driven by lower atmospheric dynamics.
Figure 4. The escapeflux of H calculated from the one-component model (top) and two-component model (bottom) analysis of the HST data. Both thesefigures show that the peak in escape was after Mars passed the perihelion position in its orbit. Also, the H escapeflux at Ls~ 226° for low solar activity was different
from the H escapeflux obtained at Ls~ 232° for high solar activity. The escape flux values derived at Ls~ 226° and Ls~ 246° for low solar activity are almost at
the same level on account of the overlapping intensity profiles for those observations (20 September and 21 October 2016) as shown in Figure 2.
5. Summary and Discussion
HST observations of the Martian hydrogen exosphere in the FUV were conducted between September 2016 and January 2017 to document the seasonal changes in the escape of hydrogen as Mars passed perihelion and southern summer solstice. These observations were analyzed using a radiative transfer model to deter-mine the bestfit density and temperature at the exobase of Mars (200 km), which were then used to provide constraints on the escapeflux of hydrogen from the exosphere of Mars. It was found that the Lyman α bright-ness of the Martian exosphere reached its peak intensity around or after southern summer solstice rather than near perihelion. The changes in intensity were not steady and symmetric and showed some depen-dence with solar activity in the long run. The trends in the data also agree well with observations made by the SWIA instrument on board the MAVEN spacecraft (Halekas, 2017).
The absolute values of hydrogen escapeflux reported here have significant uncertainties associated with them due to several contributing factors as discussed in Bhattacharyya et al. (2017). However, the observed trends in seasonal variation and variation with solar activity are quite significant, and the trend is indepen-dent of the uncertainties in instrumental absolute calibration. The observed long-term (~10 years) variations in H escapeflux, as shown in Figure 4, is not inconsistent with changes in solar activity. However, for the short-term changes (~1 month) observed during a single Martian year as Mars moved over different solar longi-tudes, the changes do not seem to be directly affected by the differences in solar EUV activity recorded at Mars during that time. This implies that there are internal processes, such as upwardflux of water into the middle atmosphere (Chaffin et al., 2017), that contribute to the short-term seasonal changes in the escape of hydrogen from Mars. Until the underlying drivers of the changes have been clearly understood, it will be difficult to accurately determine the total amount of water lost by Mars over its history.
References
Anderson, D. E. (1974). Mariner 6, 7 and 9 ultraviolet spectrometer experiment: Analysis of hydrogen Lyman alpha data. Journal of Geophysical Research, 79(10), 1513–1518. https://doi.org/10.1029/JA079i010p01513
Anderson, D. E., & Hord, C. W. (1971). Mariner 6 and 7 ultraviolet spectrometer experiment: Analysis of hydrogen Lyman-alpha data. Journal of Geophysical Research, 76(28), 6666–6673. https://doi.org/10.1029/JA076i028p06666
Bhattacharyya, D., Clarke, J. T., Bertaux, J. L., Chaufray, J. Y., & Mayyasi, M. (2015). A strong seasonal dependence in the Martian hydrogen exosphere. Geophysical Research Letters, 42(20), 8678–8685. https://doi.org/10.1002/2015GL065804
Bhattacharyya, D., Clarke, J. T., Bertaux, J. L., Chaufray, J. Y., & Mayyasi, M. (2017). Analysis and modeling of remote observations of the Martian hydrogen exosphere. Icarus, 281, 264–280. https://doi.org/10.1016/j.icarus.2016.08.034
Chaffin, M. S., Chaufray, J. Y., Deighan, J., Schneider, N. M., McClintock, W. E., Stewart, A. I. F., … Jakosky, B. M. (2015). Three-dimensional structure in the Mars H corona revealed by IUVS on MAVEN. Geophysical Research Letters, 42(21), 9001–9008. https://doi.org/10.1002/ 2015GL065287
Chaffin, M. S., Chaufray, J. Y., Stewart, I., Montmessin, F., Schneider, N., & Bertaux, J. L. (2014). Unexpected variability of Martian hydrogen escape. Geophysical Research Letters, 41(2), 314–320. https://doi.org/10.1002/2013GL058578
Chaffin, M. S., Deighan, J., Schneider, N., & Stewart, A. I. F. (2017). Elevated atmospheric escape of atomic hydrogen from Mars induced by high-altitude water. Nature Geoscience, 10(3), 174–178. https://doi.org/10.1038/ngeo2887
Chaufray, J. Y., Bertaux, J. L., Leblanc, F., & Quemerais, E. (2008). Observation of the hydrogen corona with SPICAM on Mars Express. Icarus, 195, 598–613. https://doi.org/10.1016/j.icarus.2008.01.009
Chaufray, J. Y., Gonzalez-Galindo, F., Forget, F., Lopez-Valverde, M. A., Leblanc, F., Modolo, R., & Hess, S. (2015). Variability of the hydrogen in the Martian upper atmosphere as simulated by a 3D atmosphere-exosphere coupling. Icarus, 245, 282–294. https://doi.org/10.1016/ j.icarus.2014.08.038
Clarke, J. T., Bertaux, J. L., Chaufray, J. Y., Gladstone, R., Quemerais, E., & Wilson, J. K. (2009). HST observations of the extended hydrogen corona of Mars, AAS DPS meeting #41, id. 49.11.
Clarke, J. T., Bertaux, J. L., Chaufray, J. Y., Gladstone, G. R., Quemerais, E., Wilson, J. K., & Bhattacharyya, D. (2014). A rapid decrease of the hydrogen corona of Mars. Geophysical Research Letters, 41(22), 8013–8020. https://doi.org/10.1002/2014GL061803
Clarke, J. T., Mayyasi, M., Bhattacharyya, D., Schneider, N. M., McClintock, W. E., Deighan, J. I.,… Jakosky, B. M. (2017). Variability of D and H in the Martian upper atmosphere observed with the MAVEN IUVS echelle channel. Journal of Geophysical Research: Space Physics, 122, 2336–2344. https://doi.org/10.1002/2016JA023479
Fedorova, A., Betsis, D., Korablev, O., Bertaux, J. L., Montmessin, F., Maltagliati, L., & Clarke, J. (2017). Water vapor in the middle atmosphere of Mars during the southern summer season by SPICAM/MEX. In The sixth international workshop on the Mars atmosphere: Modeling and observation, Jan 7-20, Granada, Spain.
Fedorova, A., Korablev, O. I., Bertaux, J.-L., Rodin, A. V., Montmessin, F., Belyaev, D. A., & Reberac, A. (2009). Solar infrared occultation observations by SPICAM experiment on Mars Express: Simultaneous measurements of the vertical distributions of H2O, CO2and aerosol.
Icarus, 200, 96–117. https://doi.org/10.1016/j.icarus.2008.11.006
Fox, J. L., Benna, M., Mahaffy, P. R., & Jakosky, B. M. (2015). Water and water ions in the Martian thermosphere/ionosphere. Geophysical Research Letters, 42(21), 8977–8985. https://doi.org/10.1002/2015GL065465
Gröller, H., Amerstorfer, U. V., Lichtenegger, H., Lammer, H., & Shematovich, A. I. (2015). Hydrogen coronae around Mars and Venus, EPSC Abstracts, Nantes, France.
Halekas, J. S. (2017). Seasonal variability of the hydrogen exosphere of Mars. Journal of Geophysical Research: Planets, 122, 901–911. https:// doi.org/10.1002/2017JE005306
Journal of Geophysical Research: Space Physics
10.1002/2017JA024572
Acknowledgments
This work is based on observations with the NASA/ESA Hubble Space Telescope, obtained at the Space Telescope Science Institute (STScI), which is operated by AURA for NASA. These observations were supported by STScI grant GO-14752 to Boston University. All the HST data can be downloaded from the Space Telescope Science Institute at http://archive.stsci.edu/hst/search.php.
Halekas, J. S., Ruhunusiri, S., Harada, Y., Collinson, G., Mitchell, D. L., Mazelle, C.,… Jakosky, B. M. (2017). Structure, dynamics and seasonal variability of the Mars-solar wind interaction: MAVEN Solar Wind Ion Analyzer in-flight performance and science results. Journal of Geophysical Research: Space Physics, 122, 547–578. https://doi.org/10.1002/2016JA023167
Hunten, D. M. (1973). The escape of light gases from planetary atmospheres. Journal of the Atmospheric Sciences, 30(8), 1481–1494. https:// doi.org/10.1175/1520-0469(1973)030%3C1481:TEOLGF%3E2.0.CO;2
Hunten, D. M. (1982). Thermal and non-thermal escape mechanisms for terrestrial bodies. Planetary and Space Science, 30(8), 773–783. https://doi.org/10.1016/0032-0633(82)90110-6
Hunten, D. M., & McElroy, M. B. (1970). Production and escape of hydrogen on Mars. Journal of the Atmospheric Sciences, 8, 5989. Krasnopolsky, V. A. (2002). Mars’ upper atmosphere and ionosphere at low, medium and high solar activities: Implications for evolution of
water, Journal of Geophysical Research, 107(E12), 5128. https://doi.org/10.1029/2001JE001809
Maltagliati, L., Montmessin, F., Korablev, O., Fedorova, A., Forget, F., Määttänen, A.,… Bertaux, J.-L. (2013). Annual survey of water vapor vertical distribution and water aerosol coupling in the Martian atmosphere observed by SPICAM/MEX solar occultations. Icarus, 223, 862–942.
Mayyasi, M., Clarke, J., Quémerais, E., Katushkina, O., Bhattacharyya, D., Chaufray, J.-Y.,… Jakosky, B. (2017). IUVS echelle-mode observations of interplanetary hydrogen: Standard for calibration and reference for cavity variations between Earth and Mars during MAVEN cruise. Journal of Geophysical Research: Space Physics, 122, 2089–2105. https://doi.org/10.1002/2016JA023466
McClintock, W. E., Schneider, N. M., Holsclaw, G. M., Clarke, J. T., Hoskins, A. C., Stewart, I.,… Deighan, J. (2015). The Imaging Ultraviolet Spectrograph (IUVS) for the MAVEN mission. Space Science Review, 195(1-4), 75–124. https://doi.org/10.1007/s11214-014-0098-7 McElroy, M. B., & Donahue, T. M. (1972). Stability of the Martian atmosphere. Science, 177(4053), 986–988. https://doi.org/10.1126/
science.177.4053.986
Parkinson, T. D., & Hunten, D. M. (1972). Spectroscopy and aeronomy of O2on Mars. Journal of the Atmospheric Sciences, 29(7), 1380–1390.
https://doi.org/10.1175/1520-0469(1972)029%3C1380:SAAOOO%3E2.0.CO;2
Rahmati, A., Larson, D. E., Cravens, T., Halekas, J. S., Lillis, R. J., McFadden, J. P.,… Jakosky, B. M. (2017). MAVEN measured oxygen and hydrogen pickup ions: Probing the Martian exosphere and neutral escape. Journal of Geophysical Research: Space Physics, 122, 3689–3706. https://doi.org/10.1002/2016JA023371
Romanelli, N., Mazelle, C., Chaufray, J.-Y., Meziane, K., Shan, L., Ruhunusiri, S.,… Jakosky, B. M. (2016). Proton cyclotron waves occurrence rate upstream from Mars observed by MAVEN: Associated variability of the Martian upper atmosphere. Journal of Geophysical Research: Space Physics, 121, 11,113–11,128. https://doi.org/10.1002/2016JA023270
Shematovich, V. I. (2013). Suprathermal oxygen and hydrogen atoms in the upper Martian atmosphere. Solar System Research, 47(6), 437–445. https://doi.org/10.1134/S0038094613060087
Yamauchi, M., Hara, T., Lundin, R., Dubinin, E., Fedorov, A., Sauvaud, J.-A.,… Barabash, S. (2015). Seasonal variation of Martian pick-up ions: Evidence of breathing exosphere. Planetary and Space Science, 119, 54–61. https://doi.org/10.1016/j.pss.2015.09.013