HAL Id: hal-00318117
https://hal.archives-ouvertes.fr/hal-00318117
Submitted on 9 Aug 2006
HAL is a multi-disciplinary open access
archive for the deposit and dissemination of
sci-entific research documents, whether they are
pub-lished or not. The documents may come from
teaching and research institutions in France or
abroad, or from public or private research centers.
L’archive ouverte pluridisciplinaire HAL, est
destinée au dépôt et à la diffusion de documents
scientifiques de niveau recherche, publiés ou non,
émanant des établissements d’enseignement et de
recherche français ou étrangers, des laboratoires
publics ou privés.
Parallel electric fields inferred during a pulsating aurora
J. D. Williams, E. Macdonald, M. Mccarthy, L. Peticolas, G. K. Parks
To cite this version:
J. D. Williams, E. Macdonald, M. Mccarthy, L. Peticolas, G. K. Parks. Parallel electric fields inferred
during a pulsating aurora. Annales Geophysicae, European Geosciences Union, 2006, 24 (7),
pp.1829-1837. �hal-00318117�
www.ann-geophys.net/24/1829/2006/ © European Geosciences Union 2006
Annales
Geophysicae
Parallel electric fields inferred during a pulsating aurora
J. D. Williams1, E. MacDonald2, M. McCarthy3, L. Peticolas4, and G. K. Parks4
1Dept. of Physics and Astronomy, University of Montana, Missoula, Montana 59812, USA
2Los Alamos National Laboratory, Los Alamos, NM 87545, USA
3Dept. of Earth and Space Sciences, University of Washington, Seattle, Wa. 98195, USA
4University of California, Berkeley Space Science Laboratory, Berkeley, CA 94720-7450, USA
Received: 18 September 2005 – Revised: 13 April 2006 – Accepted: 6 June 2006 – Published: 9 August 2006
Abstract. A sounding rocket, equipped to study pulsat-ing aurora launched from Poker Flat, Alaska on 13 March 1997 at 10:20:31 UT, measured electron precipitation over the range ∼10 eV to 500 keV covering pitch-angles from 0 to
180◦. Data show electrons with energies <1 keV are mostly
secondaries produced below the rocket altitude by the higher
energy precipitated electrons. We observed nearly equal
fluxes of up and down going electrons for energies <1 keV at altitudes from 265 to 380 km. Electron transport simulation results indicate the secondaries produced by the more ener-getic electrons will have two times higher flux in the upward direction as compared to the downward direction. Our obser-vations of nearly equal fluxes of up and downgoing electrons over a large range of altitudes is consistent with the presence of an electric potential above the rocket that reflects the upgo-ing electrons back toward the rocket where they are detected as downward going electrons. The strength of the potential is estimated to be 1.5±0.5 kV and its location is no greater than 5000 km above the rocket. Finally, the inferred potential drop exists independently of the presence of pulsations.
Keywords. Magnetospheric Physics (Auroral phenomena;
Energetic particles, precipitating; Energetic particles,
trapped)
1 Introduction
Pulsating aurora is a post-breakup (midnight to morning-side) phenomena in which patches of illumination in the sky are seen to turn on and off in a quasiperiodic fashion
(Røyvrik and Davis, 1977; Johnstone, 1978, 1983). The
temporal change in emission is not well understood but is assumed to be caused by wave–particle interactions which cause the electrons to be rapidly moved into the loss cone Correspondence to: J. D. Williams
where they then precipitate into the ionosphere. While the rise and fall time is less than 0.5 s, the period of a pulsation can range from seconds to 10’s of seconds. A leading wave candidate for this interaction is the whistler mode wave. (See Davidson (1990); Vorobjev et al. (1999) for a review and fur-ther references.) The temporal behavior of the pulsations does not appear to be related to auroral activity, magneto-spheric domain or latitude (Røyvrik and Davis, 1977).
The location of the modulation region has been tied to the equatorial region of the magnetosphere. This has been ac-complished by a two-step process. The first step is based on rocket observations that higher energy pulsations arrive before lower energy pulsations (Bryant et al., 1967, 1969, 1971, 1975; Lepine et al., 1980; Smith et al., 1980). The sec-ond step is to assume that the electrons which cause the pul-sations are simultaneously produced in the same region and extrapolating backward along the magnetic field line, the lo-cation of the modulation region is generally found to be in the equatorial region (Bryant et al., 1975; Smith et al., 1980). More recently, Sato et al. (2002, 2004) using the same tech-nique of extrapolating backward have estimated the
modu-lation region to be within 2 RE to 6 RE of the FAST
satel-lite. Previously, Stenbaek-Nielsen (1980) has shown that the ionosphere can either cause or modify some pulsating auroral events.
Observations of pulsating aurora (Sandahl, 1984) have shown the energy range in which pulsations are observed is approximately 2–140 keV. Coincident with these higher en-ergy electrons is the precipitation of low enen-ergy (E<1 keV) electrons which are not temporally modulated (Evans et al., 1987). Current understanding of low energy (<1 keV) elec-tron precipitation commonly observed during pulsating auro-ral events is that these electrons are secondary electrons pro-duced by collisions with atmospheric species in the conjugate hemisphere (Prasad et al., 1983; Evans et al., 1987). Sec-ondary electrons are produced by energetic incoming elec-trons which collide with and ionize ionospheric species. This
1830 J. D. Williams et al.: Low energy electrons in pulsating aurora conclusion is corroborated by a computer model which
in-corporated observed energy spectra and pitch-angle distri-butions and used realistic secondary and backscattered pro-duction rates (Evans et al., 1987). Backscattered electrons are primary electrons which, after colliding with ionospheric constituents, travel back along the original trajectory.
Evans (1974) postulated that low energy precipitating electrons could be observed as a result of an electric potential which reflected outgoing electrons back into the ionosphere. A characteristic of the energy spectra for instances of paral-lel electric fields is a local intensity maxima or knee at the energy of the potential drop. When the energy spectra lack a local intensity maxima, Evans and Moore (1979) concluded that the electric field could not account for the observations of the low energy electrons. While these results were not de-veloped with pulsating aurora in mind they are likely to be applicable to the low energy electrons associated with pul-sating aurora. Recently Sato et al. (2002) have observed an inverted V structure over a pulsating aurora using instrumen-tation from the FAST satellite. The peak downward electron intensity was found to vary between ∼0.1–1.0 keV. Thus, pulsating aurora have been seen in conjunction with a par-allel electric field.
On 13 March 1997, at 10:20:31 UT (22:53 MLT) a sound-ing rocket experiment was launched into the late recovery phase of a substorm in which pulsating aurora was observed. The rocket instrumentation allowed us to look at both up-going and downup-going electrons with high energy and time resolution. Our observations of downgoing precipitating low energy (15–500 eV) electrons show, coincident with precipi-tating high energy (>5 keV) electrons, a definite modulation of the low energy electrons for three out of the nine pulsa-tions observed during the rocket flight. Pulsation modula-tions at these low energies have not been seen previously. This observation leads to the question of whether the mod-ulation is due to the primary source or a result of secondary interaction. If the electrons are secondaries then there are three possible alternatives, that the low energy electrons are produced above and around the rocket or they are produced in the conjugate hemisphere or finally that they are produced in the ionosphere below the rocket. Detailed examination of the data favor the explanation that these electrons are, in fact, secondaries produced in the ionosphere below the rocket which then travel up the magnetic field until they encounter a parallel electric field and then reflect back toward the rocket to be measured as precipitating electrons.
While our observations support current understanding of low energy electrons as being secondaries, we suggest a dif-ferent process which leads to the presence of these down-going secondaries. Low energy pulsations produced in the conjugate ionosphere as reported by Evans et al. (1987) and Prasad et al. (1983) would not be coincident with high en-ergy electron pulsations as observed. While our enen-ergy spec-tra lack a local intensity maxima, which caused Evans and Moore (1979) to reject a parallel electric field as low energy
electron reflection mechanism, our results of similar upgo-ing and downgoupgo-ing energy spectra and slightly anisotropic pitch-angle distributions show that the parallel electric field is the most likely mechanism which can explain the obser-vations. This leads to the result, that parallel electric fields, which may explain the observations of the low energy elec-trons typically seen in pulsating aurora, have been inferred in association with pulsating aurora.
2 Instrumentation
The rocket was equipped with a suite of instruments designed to measure as completely as possible the geophysical envi-ronment over a pulsating aurora. The rocket was field aligned to within a few degrees of the ambient magnetic field with a revolution rate of 1 Hz. The data were despun on the ground so that all of the results presented here are given with respect to the Earth’s magnetic field. This report uses data from an electrostatic analyzer (ESA) and five solid state telescopes (SST’s).
The ESA had 16 pitch-angle bins and was oriented such
that the 0◦ anode detected electrons which were traveling
straight down the magnetic field line and the 180◦anode
de-tected electrons which were traveling up the magnetic field line and out of the ionosphere. As the rocket spun a full 4π steradian sample of the distribution function was taken every
second. The angular resolution was approximately 13◦in
az-imuth by 11.5◦ in pitch-angle with a total geometric factor
of 0.041 cm2−sr−4E/E. The ESA detected electrons from
10 eV to 25 keV, with a 4E/E of 7% in 32 noncontiguous, logarithmically spaced energy channels and obtained a full energy spectrum every 50 ms.
The SST’s were arrayed in five pitch-angle directions (90◦,
67.5◦, 45◦, 22.5◦, 0◦) where the 0◦detector looked upward along the magnetic field line. The geometric factors of the
SST’s were approximately 0.02 cm2sr. The SST’s detected
electrons from 30–400 keV in 32 noncontiguous energy bins and obtained a full energy spectrum every 10 ms.
Also on-board the rocket were three-axis electric and mag-netic field antennas which were located at the end of booms on the rocket body. These instruments were operated in the ELF/VLF range of frequencies with a sample rate of 16 kHz. During the course of the flight these instruments showed no electric or magnetic field power coincident with the detection of pulsations by the particle and optical instruments.
3 Observations
The rocket was launched approximately 20 min into the re-covery phase of a small substorm which occurred over north-ern Alaska. Ground based magnetometers showed a negative bay of approximately 30 nT prior to launch. During the time that pulsations were observed the rocket traversed magnetic
(A)
(B)
Fig. 1. Ft. Yukon all-sky camera video frames. Panel (A) shows the rocket position during a pulsation event at 10:22:59 UT. Panel (B) shows the rocket position at 10:22:50 UT, just prior to the pulsation event in panel (A).
L-shells from 5.9–6.5. The pulsating auroral event was com-plex, the patches showed evidence of streaming (Cresswell, 1968), in which the patch grows in area of illumination dur-ing the switchdur-ing-on phase, followed by a shrinkdur-ing in area during the switching-off phase. There was a general diffuse background precipitation across the entire field of view of the all-sky cameras. UVI images from the Polar spacecraft and the all-sky camera images from Poker Flat showed that toward the end of the rocket flight a weak auroral arc started forming to the south of the rocket. This arc was well out of the field of view of both the ESA and the SST’s.
Two frames taken from the all-sky camera located at Ft. Yukon are shown in Fig. 1. The all-sky camera is ori-ented such that the north direction is located at the bottom of the image. Panel (A) shows the pulsating patch, corre-sponding to the pulsation observed at 10:22:59 UT (∼146 s after launch), encircled by a white oval. The position of the rocket, mapped down to 100 km, is also located on the figure
1.0 101 102 103 104 105 106 107
Relative Intensity (for All-Sky Cameras) and Particle Flux (for rocket)
33 - 40 keV 40 - 47 keV 54 - 61 keV 18.3 - 20.7 keV 14.4 - 16.2 keV 6.9 - 7.8 keV 2.0 - 2.3 keV 0.12 - 0.18 keV 0.02 - 0.03 keV 115 155 195 235 275 315 355 395 435 475 515 Ft. Yukon Poker Flat 200 265 316 353 375 384 379 360 327 280 220 Seconds after launch Altitude (km)
Fig. 2. Summary plot of electron flux for the field aligned (0–12◦) electrons for selected energies. The data are 1-s averages which have been smoothed with a 3-point filter. Nine pulsations are ev-ident as large abrupt changes in the flux and are indicated by the arrows. Three of the pulsations, marked by the solid arrows, show pulsation signatures down to 10 eV. These higher energy electrons are not shown here but rather in Figures 5–7. The all–sky camera intensity, in relative units, is plotted below the particle flux.
and is marked by the red dot. (A movie of the all-sky camera video for the entire flight from both Poker Flat and Ft. Yukon
can be viewed at: http://www.physics.umt.edu/∼jdw/all-sky/
all-sky.html.) Panel (B) shows the rocket at almost the same position just 9 s before the pulsation (10:22:50 UT).
We first ascertained that the electron flux observations are temporal changes rather than spatial changes caused by rocket motion through a physical structure. This was done by examining the all-sky camera images obtained from Poker Flat and Ft. Yukon, Alaska. The images were digitized and the position of the rocket mapped down to a 100 km light emission height using a dipole magnetic field model. The pixel located at the rocket footprint and the surrounding square of seven pixels on a side was averaged to create a sin-gle point of white light intensity. As the rocket moved along its trajectory a new position was calculated and the resulting intensity was determined. This process gives a time series of white light intensity as measured by the all-sky camera at the location of the rocket. The resulting time series was then compared to the electron precipitation time series as shown in Fig. 2. As can be seen, the all-sky camera time series closely matches the traces showing the electron precipitation. Since
1832 J. D. Williams et al.: Low energy electrons in pulsating aurora 0.01 0.1 1.0 10.0 100.0 Energy (keV) 101 102 103 104 105 106 107 108
Flux (particles/sec ster cm
2 keV)
Time : 146 - 151 s
67.5°
6°
Fig. 3. Energy spectra for electrons at 0◦–11◦(circles) and 62◦–73◦ (squares) pitch angle electrons for the pulsation starting at 146 s.
the all-sky camera time series is determined from a stationary point in space we can assume that the rocket was measuring temporal changes in electron flux and not moving through regions of varying precipitation. Furthermore, the horizon-tal path traveled by the rocket during a 50 ms sample time is
∼50 m. This distance is small compared to the scale size of
the pulsating patches (∼ 50 km) and any changes as a func-tion of time are most likely to be the results of temporal vari-ations in the electron precipitation.
Figure 2 shows a running average of the downward
elec-tron flux at 6◦±6◦ pitch-angles as measured on the rocket
along with the all-sky intensity traces The pulsations are identified by a sudden rapid (<0.5 s for energies >6 keV) rise in electron flux which lasts for several seconds and are marked by the triangles at the top of the figure. For the six time intervals marked by the open triangles, the pulsations are seen over energies from 6–61 keV. For the three time in-tervals marked by the solid triangles, the pulsations were also seen at energies between 10 eV–500 eV, which are not shown in this figure but are discussed in further detail below. As the rocket spent much of its flight time out of the zenith view of the camera located at Poker Flat, this trace suffers a greater distortion and is not as a good a match to the the electron precipitation as is the Ft. Yukon camera. Since the features between the electron precipitation as measured on the rocket and the Ft. Yukon all-sky camera were so closely correlated and the all-sky intensity variations are temporal in nature, we
115 118 121 124 127 130
Time (seconds after launch) 103 104 105 106 107 108
Flux (particles/sec ster cm
2 keV) 0°− 90° Downgoing 24.8 keV 11.9 keV 5.75 keV 2.73 keV 272 eV 43 eV 14 eV 115 118 121 124 127 130
Time (seconds after launch)
90°−180° Upgoing 24.8 keV 11.9 keV 5.75 keV 2.7 keV 272 eV 43 eV 14 eV
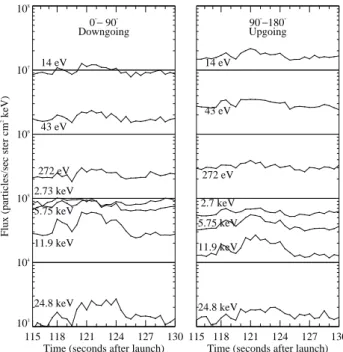
Fig. 4. Flux for the pulsation observed at 119 s after launch for selected energies at 0◦–90◦and 90◦–180◦pitch-angle electrons.
are further convinced that the variations in the electron fluxes identified as pulsations are temporal.
To verify that these low energy electrons are not contribu-tions from bremsstrahlung radiation produced by the colli-sion of electrons with energies >60 keV with the aluminum rocket housing, a calculation of the production rate of X-rays was made. The results indicate that the X-X-rays pro-duced would account for <10% of the measured low energy electron flux (not shown). Furthermore, X-rays would af-fect all detectors equally, but the observed increase in tron flux was pitch-angle dependent with perpendicular trons showing smaller changes than more field aligned elec-trons (not shown). Also elecelec-trons with energies >1 keV and
<5 keV showed no pulsation modulation as would be
ex-pected if part of the flux were produced by X-rays. We have therefore concluded the counts appearing in the low energy channels are due to low energy electrons.
Figure 3 shows the energy spectra from 6◦and 67.5◦for
the pulsation at 146 s after launch. The Poisson counting un-certainties are indicated for each measurement, with the
cir-cles indicating the 67.5◦measurements and the squares
in-dicating 6◦. The spectra are similar in shape for energies
below 1 keV but differ markedly for higher energies. The
spectrum at 67.5◦shows a broad plateau region between 1.4
and ∼10 keV. Thus, we are unable to distinguish a local
in-tensity maximum. For the 6◦spectrum the plateau region is
not nearly so well defined and this spectrum also lacks any energy range which could be interpreted as having a positive slope.
138 142 146 150 154 158 Time (seconds after launch) 105 106 107 108 109 1010
Flux (particles/sec ster cm
2 keV) 0°− 90° Downgoing 24.8 keV 11.9 keV 5.75 keV 2.73 keV 272 eV 80 eV 24 eV 138 142 146 150 154 158
Time (seconds after launch)
90°−180° Upgoing 24.8 keV 11.9 keV 5.75 keV 2.7 keV 272 eV 80 eV 24 eV
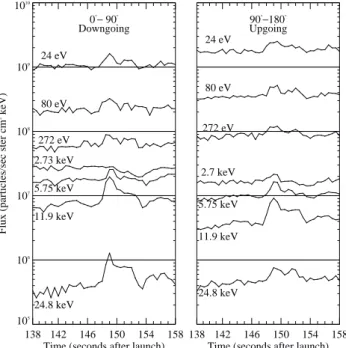
Fig. 5. Flux for the pulsation observed at 146 s after launch for selected energies at 0◦–90◦and 90◦–180◦pitch-angle electrons.
To better understand the origin of the low energy
pulsations (10 eV–1 keV), the integrated downgoing (0◦–90◦
pitch angle) and upgoing (90◦–180◦pitch angle) particle flux
for selected energies for the pulsations which showed low energy fluctuations at 119 s (10:22:32 UT, 12:56:32 MTL), 146 s (10:22:59 UT, 12:56:59 MLT) and 285 s (10:25:18 UT, 12:59:18 MTL) are shown in Figs. 4, 5 and 6. At the times of these pulsations the rocket was at heights of 207 km, 260 km and 380 km, respectively. There is a clear pulsation signature in both the upgoing and downgoing field aligned electrons for all energies less than 1 keV.
The flux of electrons during 13 March 1997 pulsating event was very low. In order to get better counting statistics two techniques were applied. First, the flux for all downgo-ing or upgodowngo-ing pitch angles was added together. Secondly, time samples were also added together. This decreased the time resolution but increased our ability to see the pulsations at the lowest energies. Thus, there was a tradeoff between high time resolution and better counting statistics. For the pulsations at 119 eV and 146 eV, 10 time samples were added together giving a time resolution of 0.5 s. For the pulsation at 285 eV, 20 time samples were added together giving a time resolution of 1.0 s. The one sigma Poisson variations in the flux traces are too small to be seen in the figures. In this way we can be assured that the changes in flux, which indicate the pulsation signature, are significant.
We also note that pulsations are absent at 2.73 keV for the downward electrons while the upgoing pitch-angles shows a pulsation at 2.73 keV (although the pulsation is weak). The upgoing electron flux is higher (∼50% near 15 eV) than the
270 275 280 285 290 295 300 Time (seconds after launch) 103 104 105 106 107 108
Flux (particles/sec ster cm
2 keV) 0°− 90° Downgoing 24.8 keV 11.9 keV 5.75 keV 2.73 keV 272 eV 80 eV 24 eV 270 275 280 285 290 295 300 Time (seconds after launch)
90°−180° Upgoing 24.8 keV 11.9 keV 5.75 keV 2.7 keV 272 eV 80 eV 24 eV
Fig. 6. Flux for the pulsation observed at 285 s after launch for selected energies at 0◦–90◦and 90◦–180◦pitch-angle electrons.
downgoing flux for all energies below ∼1 keV, while for electrons with energies above 3 keV, the fluxes are higher in the downgoing direction. This behavior was consistently seen throughout the flight. Finally, for the low energy elec-trons, the rise time of the pulsation signatures is always less than the fall time.
In order to check the separation in time between up and downgoing electrons a cross-correlation integral between the up and downgoing electrons of the same energy was per-formed. The results showed that for the pulsations at 119 eV and 146 eV the up and downgoing electrons arrived at the rocket within 0.5 s of each other which is consistent with the visual examination of the traces of the electron flux. Like-wise, the results for the pulsation at 285 s showed that the up and downgoing electrons arrived at the rocket within ≈1.0 s of each other.
Of the nine pulsations only three had clear signatures in the 0.02–0.75 keV range. For the remaining six pulsation events we do not report low energy pulsations. This does not mean that there were no low energy pulsations. In fact, some energy channels indicated that low energy pulsations were present. However, we could not determine these sig-natures for all of the energies so conservatively we state only three pulsations showed low energy pulsation signa-tures. One characteristic that separates the three low energy pulsation events from the six which did not was the change in flux between the background precipitation and the pulsation itself. The three which showed low energy pulsation signa-tures had large enhancements (factors of 3 or more) in the flux while the six which didn’t had smaller changes in flux
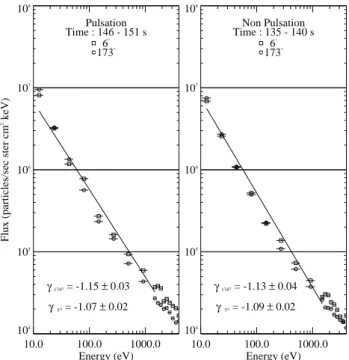
1834 J. D. Williams et al.: Low energy electrons in pulsating aurora 10.0 100.0 1000.0 Energy (eV) 104 105 106 107 108
Flux (particles/sec ster cm
2 keV) Pulsation Time : 146 - 151 s 6° 173° γ 5° = -1.07 ± 0.02 γ 174° = -1.15 ± 0.03 10.0 100.0 1000.0 Energy (eV) 104 105 106 107 108 Non Pulsation Time : 135 - 140 s 6° 173° γ 5° = -1.09 ± 0.02 γ 174° = -1.13 ± 0.04
Fig. 7. Low energy (E < 1 keV) spectra of the time intervals of 148– 151 s (pulsation) and 135–140 s (background). The electrons are from 6◦and 174◦pitch angles. Power law fits show that the up- and downgoing spectra are identical for both pulsation and background time intervals.
(relative to the background) during the pulsation. This seems to indicate that we were unable to distinguish the signal out of the “noise” of normal low energy electron precipitation.
Figure 7 shows energy spectra of up- and downgoing elec-trons for energies below 1 keV for the pulsation at 146 eV. The spectra for events at 119 eV and 285 eV were similar enough not to have to be shown. Except for the difference in the fluxes, the spectra are nearly identical. Power law fits near −1.1 describe both the up- and downgoing spectra for both the pulsation and non-pulsation time intervals. The spectra do not change in their shape with the increased flux of a pulsation event. The similarity in the up- and downgoing low energy spectra was observed from time 115 s–350 s cor-responding to an L-shell range of 5.9–7 during both times of pulsation events and unstructured background precipitation.
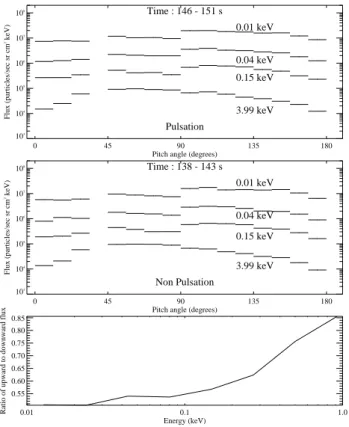
Figures 8, 9 and 10 examine the pitch-angle distributions of the electrons for the pulsations which show low energy modulation. These distributions have been integrated in time as shown by the plot labels. The upper panels show the pulsa-tion pitch angle distribupulsa-tion and the middle panels show the non-pulsation pitch angle distribution. Three energy chan-nels with E<200 eV are shown as well as electrons near 4 keV. (The point at which the distribution becomes more anisotropic.) In all three figures the low energy electrons are weakly anisotropic for both time intervals with the fluxes
of 90◦–180◦pitch-angles being slightly higher. The bottom
panel shows the pitch-angle integrated upward to downward
0 45 90 135 180
Pitch angle (degrees) 103 104 105 106 107 108 Flux (particles/sec sr cm 2 keV) 3.99 keV 0.15 keV 0.04 keV 0.01 keV Time : 119 - 124 s Pulsation 0 45 90 135 180
Pitch angle (degrees) 103 104 105 106 107 108 Flux (particles/sec sr cm 2 keV) 3.99 keV 0.15 keV 0.04 keV 0.01 keV Time : 127- 130 s Non Pulsation 0.01 0.1 1.0 Energy (keV) 0.50 0.55 0.60 0.65 0.70 0.75
Ratio of upward to downward flux
Fig. 8. Pitch angle distributions for selected energies for 119 s and 127 s. Electrons with energies below 200 eV are shown as well as electrons at 4 keV. The low energy electrons show a slightly anisotropic distribution. The higher energy electrons begin to show a loss cone at near 50◦pitch angle. The ratio of upward to down-ward pitch angle integrated electrons is shown in the bottom panel.
electron flux ratio for energies less than 1 keV. These values will be later compared to an electron transport code output. Observed values are less than one, indicating that the flux of downward electrons is greater than the flux of upward elec-trons for these energies. We are interested in these energies because these are the ones which are trapped by the parallel electric field above the rocket (further discussed below). The uncertainties are shown on the plot but are too small to be seen due to the integration of so many pitch angles.
4 Discussion
There are two possible sources for the downgoing low energy (10 eV–1 keV) electrons: they are either primaries from the magnetosphere associated with the pulsation precipitation or secondaries produced in the ionosphere by the more ener-getic precipitated electrons. Evans and Moore (1979) have shown that they can account for the low energy (E<1 keV) electrons as secondaries associated with diffuse aurora. Even though our observations occurred during a pulsating aurora, we also favor the interpretation that the low energy electrons are secondaries which were produced by more energetic
0 45 90 135 180 Pitch angle (degrees)
103 104 105 106 107 108 Flux (particles/sec sr cm 2 keV) 3.99 keV 0.15 keV 0.04 keV 0.01 keV Time : 146 - 151 s Pulsation 0 45 90 135 180
Pitch angle (degrees) 103 104 105 106 107 108 Flux (particles/sec sr cm 2 keV) 3.99 keV 0.15 keV 0.04 keV 0.01 keV Time : 138 - 143 s Non Pulsation 0.01 0.1 1.0 Energy (keV) 0.55 0.60 0.65 0.70 0.75 0.80 0.85
Ratio of upward to downward flux
Fig. 9. Pitch angle distributions for selected energies for 146 s and 135 s. Electrons with energies below 200 eV are shown as well as electrons at 4 keV. The low energy electrons show a slightly anisotropic distribution. The higher energy electrons begin to show a loss cone at near 50◦pitch angle. The ratio of upward to down-ward pitch angle integrated electrons is shown in the bottom panel.
primaries during both unstructured background times as well as pulsation events. During pulsation intervals the higher energy primaries impressed the pulsation signature onto the atmosphere, ionizing it and causing low energy upward di-rected electrons which have the same temporal variations as the downward pulsations.
The examination of the low energy differential energy spectra are key to drawing our conclusion. We note that the low energy up- and downgoing spectra are nearly identical, as shown in Fig. 7. The energy spectra of the upgoing elec-trons fit a power law form (γ = –1.1) which is characteris-tic of secondary electrons that have been scattered off a dif-fuse gas (ionosphere) and travel upward (Evans and Moore, 1979; Evans et al., 1987; Prasad et al., 1983). Measure-ments of low energy power law parameters in high latitudes range from γ = –0.9 to γ = –1.46 (Evans and Moore, 1979). The similar energy spectra strongly suggest that the up- and downgoing electrons are sampled from the same population. Since the upward directed electrons must be secondaries that come from the ionosphere we conclude that the downgoing low energy electrons are also secondaries which come from the ionosphere. Now we must decide whether the
downgo-0 45 90 135 180
Pitch angle (degrees) 103 104 105 106 107 108 Flux (particles/sec sr cm 2 keV) 3.99 keV 0.15 keV 0.04 keV 0.01 keV Time : 285 - 290 s Pulsation 0 45 90 135 180
Pitch angle (degrees) 103 104 105 106 107 108 Flux (particles/sec sr cm 2 keV) 3.99 keV 0.15 keV 0.04 keV 0.01 keV Time : 275 - 280 s Non Pulsation 0.01 0.1 1.0 Energy (keV) 0.5 0.6 0.7 0.8
Ratio of upward to downward flux
Fig. 10. Pitch angle distributions for selected energies for 275 s and 285 s. Electrons with energies below 200 eV are shown as well as electrons at 4 keV. The low energy electrons show a slightly anisotropic distribution. The higher energy electrons begin to show a loss cone at near 50◦pitch angle. The ratio of upward to down-ward pitch angle integrated electrons is shown in the bottom panel.
ing electrons come from the conjugate hemisphere or from the ionosphere below the rocket. Another factor that helped make this conclusion is that there is a lack of pulsations in the 1–5 keV electrons as shown by the 2.72 keV electron traces in Figs. 4, 5 and 6.
Evans and Moore (1979) suggest that the upgoing sec-ondaries produced in the conjugate hemisphere can travel to the opposite hemisphere and appear as downgoing elec-trons. The downgoing electrons we observe could not have originated in the Southern Hemisphere because the pulsation structures in the low energies are detected at the same time (to within 1 s) as the electrons with energies greater than a few keV. For 20 eV electrons, the bounce period for L=6, where the observations were made, is nearly 40 eV and if the electrons came from the Southern Hemisphere, one would have observed time dispersion in the arrival of different en-ergies, which was not observed.
To learn more about the origin of these low energy elec-trons, we have applied the electron transport simulation code Lummerzheim and Lilensten (1994) to the MSIS-83 model atmosphere using the observed energetic electron fluxes with energies greater than 1 keV as an input. The transport code
1836 J. D. Williams et al.: Low energy electrons in pulsating aurora precision is given to be approximately 20%. The limit on the
precision is determined by the collisional cross sections of the various constituents as measured in the laboratory. The electron transport equation was solved numerically for elec-tron intensity as a function of altitude, pitch-angle and en-ergy. The input pitch-angle dependence comes from the elec-trostatic analyzer and was interpolated to get 32 pitch-angles of roughly 5.6 deg. The output pitch-angle dependence was also given in 5.6 deg increments. There was no pitch-angle scattering incorporated into the simulation, nor was a parallel electric field incorporated into the model.
The pitch-angle integrated electron flux results predict that most of the secondary electrons are generated below the rocket, with maximum fluxes produced at heights between 90–110 km. The simulation results do predict heating of the ambient atmosphere and subsequent collisions will
re-distribute these secondary fluxes. The simulation results
also predict that the resulting upgoing fluxes will exceed the downgoing fluxes by a factor of two (2±0.4) at the rocket al-titude of 285 km and by a factor of 10 (10±1) at 400 km. Our observations from the bottom panel of Fig. 9 give a factor of ∼0.65 for the pulsation at 146 eV (altitude of ≈260 km). Figure 10 shows a ratio of ∼0.7 for the pulsation at 285 eV (altitude of ∼400 km). Both of these ratios are significantly smaller than those predicted by the model. We account for the difference between observations and model by postu-lating a parallel electric field which causes upward moving electrons to reflect and be measured as downward moving electrons, thereby lowering the ratio of upward to downward electrons. The ratio of upgoing to downgoing fluxes for the pulsation at 119 s is a little more difficult to interpret. At this time the rocket was still near the bottom of the ionosphere (≈200 km) and the differences between the transport code and the observations are not as large as for higher rocket al-titudes.
We propose that the downgoing secondary electron fluxes we detected are due to a potential structure above the rocket that is reversing the trajectories of upgoing electrons which then travel back toward the ionosphere where they are de-tected as downgoing electrons. While the modeling is sug-gestive of a larger flux of electrons it is still possible that the downgoing electrons are actually produced at or above the rocket. Since the rocket launch occurred shortly after an auroral breakup in which it is assumed that parallel fields were present it seems likely that some sort of remnant par-allel electric field could cause the low energy electron signa-tures we observed. As shown by Sato et al. (2002) parallel electric fields can be present during pulsating auroral events and it is our contention that such a parallel field is responsi-ble for producing the low energy pulsations which are seen in Fig. 5.
Having hypothesized that a potential is present above the rocket, we can estimate the strength of this potential. First note that the pitch-angle distributions of electrons with ergies <1 keV are slightly anisotropic whereas higher
en-ergy electrons (E>4 keV) show a loss cone type distribution. Secondly, the similarity between the upgoing and downgoing energy spectra only occurs for energies less than 1–2 keV. (This is also consistent with the transport code results.) These features suggest that the potential is 1.5±0.5 kV.
We mainly base this assertion on the similarity of the low energy up- and downgoing electron spectra. This is a depar-ture from the interpretation of Evans (1974) and Evans and Moore (1979). Our data show no evidence of a localized in-tensity maxima but the 1.5±0.5 kV potential is smaller than typically seen in inverted V structures and is small enough to be indistinguishable from the rising flux of low energy elec-trons and is consistent with the observations of Sato et al. (2002).
An estimate of the farthest distance from the parallel po-tential drop to the rocket is given as
2x = vt , (1)
where x is the one-way distance to the electric field, v is the velocity of the electron and t is the time difference be-tween arrival times for the low energy upgoing pulsation signature and the low energy down going pulsations. The non-relativistic velocity is replaced with the energy, E, using
v=√2E/me, where meis the electron mass. This gives
x = t s
E 2me
. (2)
Now the choice of energies is driven by the need to be certain that the electrons are reflected by the electric field and not precipitating from a source region. Since the potential is hy-pothesized to be approximately 1 kV the highest energies to be chosen are just below 1 keV. These energies will have the shortest up and down trip time and will give an outer bound to the distance. Likewise, the lowest energies will have the longest trip time and will give a low bound to the distance. From Figures 4, 5 and 6 we can see that the up and down going pulsation electrons arrive at the rocket within the same time sample. We now choose one half the minimum resolved time for t . For the pulsations at 119 and 146 s this gives
t=0.25 and for the pulsation at 285 s this gives t =0.5.
Choos-ing energies of 1 keV and 20 eV will give a range of where the electric potential structure is located. For the pulsations at 119 and 146 s the shortest distance is roughly 350 km and the longest distance is 2300 km. For the pulsation at 285 eV the range is between 1300 km and 4700 km.
Figures 4, 5 and 6 show that the fall time for the low en-ergy pulsations was always less rapid than the fall time for the higher energy electrons which is consistent with a reflec-tion mechanism. Given that the potential is at this altitude, the fall time of the low energy electrons is consistent with the idea that the low energy electrons travel only a few round trips between the potential drop and their ionospheric mir-ror points before the pulsation signal becomes indistinguish-able from the background precipitation. This is a qualitative
consistency. The way to make this more quantitative is to develop an ionospheric electron trasport model and incorpo-rate a parallel electric field.
Although evidence of a potential drop was observed dur-ing pulsation events, it is unlikely to be associated with the pulsation precipitation mechanism itself for two reasons. The first is because the energy spectra of both up- and downgo-ing electrons are similar for pulsation times as well as for non-pulsation times. Secondly, the low energy spectra do not change shape, only magnitude during a pulsation event. The potential is possibly associated with the weak auroral struc-ture (As seen in the UVI images.) which persisted during the time pulsations were detected. Possibly the potential may be the remnant electric field associated with the breakup just prior to lauch of the rocket.
This observation is somewhat different than that reported by Sato et al. (2002, 2004). In that case the pulsating shapes were more like bands aligned in an east-west direction, while the observations reported here were for streaming patches, an environment likely to be different enough to make quan-titative comparison with Sato et al. (2004) impossible. Sato et al. (2004) showed that the form of the auroral bands was tied to the inverted-V structure observed by the FAST satel-lite. Our observations allow us to infer a parallel electric field which has a much smaller potential drop associated with it than those typically measured for an inverted-V event. How-ever, it seems that both Sato et al. (2004) and our obser-vations point to something in the ionosphere causing or at least affecting the pulsations. During this pulsating event we observed no energy dispersed electron arrival, see the first columns of Figs. 4, 5 and 6 as well as Fig. 2. This seems to indicate that the precipitating mechanism would most prob-ably be located somewhere close to the rocket, maybe inside the ionosphere. We intend to publish an analysis of this as-pect of our observations shortly.
Acknowledgements. We thank R. Skoug, A. Meadows, B. Schulz,
J. Chin and the rocket personnel at NASA Wallops Flight Facility for invaluable help in the successful launch of the rocket. We thank T. Hallinan for all-sky camera analysis guidance and discussions and D. Lummerzheim for electron transport discussions. This re-search is funded in part by NASA grant NAG5–677.
Topical Editor M. Pinnock thanks R. Nemzek and N. Sato for their help in evaluating this paper.
References
Bryant, D. A., Collin, H. L., Courtier, G. M., and Johnstone, A. D.: Evidence for Velocity Dispersion in Auroral Electrons, Nature, 215, 45–46, 1967.
Bryant, D. A., Courtier, G. M., and Johnstone, A. D.: Modulation of auroral electrons at large distances from the Earth, J. Atmos. and Terr. Phys., 31, 579–592, 1969.
Bryant, D. A., Courtier, G. M., and Bennett, B.: Equatorial modula-tion of electrons in a pulsating aurora, J. Atmos. and Terr. Phys., 33, 859–867, 1971.
Bryant, D. A., Smith, M. J., and Courtier, G. M.: Distant Modu-lation of Electron Intensity During the Expansion Phase of an Auroral Substorm, Planet. Space Sci., 23, 867–878, 1975. Cresswell, G.: Fast temporal and spatial changes in auroras, Tech.
Rep. Rep. UAG–R206, Geophysical Institute, University of Alaska, Fairbanks, 63-68, 1968.
Davidson, G. T.: Pitch-Angle Diffusion and the Origin of Temporal and Spatial Structures in Morningside Aurorae, Space Sci. Rev., 53, 45–82, 1990.
Evans, D. S.: Precipitating Electron Fluxes Formed by a Magnetic Field Aligned Potential Difference, J. Geophys. Res., 79, 22 853– 22 858, 1974.
Evans, D. S. and Moore, T. E.: Precipitation Electrons Associated With the Diffuse Aurora: Evidence for Electrons of Atmospheric Origin in the Plasma Sheet, J. Geophys. Res., 84, 6451–6457, 1979.
Evans, D. S., Davidson, G. T., Voss, H. D., Imhof, W. L., Mobilia, J., and Chiu, Y. T.: Interpretation of Electron Spectra in Morn-ingside Pulsating Aurorae, J. Geophys. Res., 92, 12 295–12 306, 1987.
Johnstone, A. D.: Pulsating Aurora, Nature, 274, 119–126, 1978. Johnstone, A. D.: The Mechanism of Pulsating Aurora, Ann.
Geo-phys., 1, 397–410, 1983.
Lepine, D. R., Bryant, D. A., and Hall, D. S.: A 2.2 Hz modulation of auroral electrons imposed at the geomagnetic equator, Nature, 286, 469–471, 1980.
Lummerzheim, D. and Lilensten, J.: Electron transport and energy degradation in the ionosphere: evaluation of the numerical solu-tion, comparison with laboratory experiments and auroral obser-vations, Ann. Geophys., 12, 1039–1051, 1994.
Prasad, S. S., Strickland, D. J., and Chiu, Y. T.: Auroral Electron Interaction With The Atmosphere In The Presence of Conju-gate Field-Aligned Electrostatic Potentials, J. Geophys. Res., 88, 4123–4130, 1983.
Røyvrik, O. and Davis, T. N.: Pulsating Aurora: Local and Global Morphology, J. Geophys. Res., 82, 4720–4740, 1977.
Sandahl, I.: Pitch Angle Scattering and Particle Precipitation in a Pulsating Aurora – An Experimental Study, Ph.D. thesis, Kiruna Geophysical Institute, Kiruna, Sweden, 1984.
Sato, N., Wright, D. M., Ebihara, Y., Sato, M., Murata, Y., Doi, H., Saemundsson, T., Milan, S. E., Lester, M., and Carlson, C. W.: Direct comparison of pulsating aurora observed simultaneously by the FAST satellite and from the ground at Syowa, Geophys. Res. Lett., 29, 2041, doi:10.1029/2002GL015615, 2002. Sato, N., Wright, D. M., Carlson, C. W., Ebihara, Y., Sato, M.,
Saemundsson, T., Milan, S. E., and Lester, M.: Generation Re-gion of Pulsating Aurora Obtained Simultaneously by the FAST satellite and a Syowa-Iceland Conjugate Pair of Observatories, J. Geophys. Res., 109, 15, doi:10.1029/2004JA010419, 2004. Smith, M. J., Bryant, D. A., and Edwards, T.: Pulsations in Auroral
electrons and Positive Ions, J. Atmos. and Terr. Physics, 42, 167– 178, 1980.
Stenbaek-Nielsen, H. C.: Pulsating Aurora: The Importance of the Ionosphere, Geophys. Res. Lett., 7, 353–356, 1980.
Vorobjev, V. G., Yagodkina, O. I., Sibeck, D. G., and Newell, P.: Daytime high-latitude auroral pulsations: some morphological features and the region of the magnetospheric source, J. Geo-phys. Res., 104, 10 135–10 144, 1999.