HAL Id: hal-00304751
https://hal.archives-ouvertes.fr/hal-00304751
Submitted on 1 Jan 2003HAL is a multi-disciplinary open access archive for the deposit and dissemination of sci-entific research documents, whether they are pub-lished or not. The documents may come from teaching and research institutions in France or abroad, or from public or private research centers.
L’archive ouverte pluridisciplinaire HAL, est destinée au dépôt et à la diffusion de documents scientifiques de niveau recherche, publiés ou non, émanant des établissements d’enseignement et de recherche français ou étrangers, des laboratoires publics ou privés.
Evaluating the reliability of point estimates of wetland
reference evaporation
H. Gavin, C. T. Agnew
To cite this version:
H. Gavin, C. T. Agnew. Evaluating the reliability of point estimates of wetland reference evaporation. Hydrology and Earth System Sciences Discussions, European Geosciences Union, 2003, 7 (1), pp.3-10. �hal-00304751�
Evaluating the reliability of point estimates of wetland reference
evaporation
H. Gavin and C.T. Agnew
School of Geography, University of Manchester, Mansfield Cooper Building, Oxford Road, M13 9PL, UK Email for corresponding author: [email protected]
Abstract
The Penman-Monteith formulation of evaporation has been criticised for its reliance upon point estimates so that areal estimates of wetland evaporation based upon single weather stations may be misleading. Typically, wetlands comprise a complex mosaic of land cover types from each of which evaporative rates may differ. The need to account for wetland patches when monitoring hydrological fluxes has been noted. This paper presents work carried out over a wet grassland in Southern England. The significance of fetch on actual evaporation was examined using the approach adopted by Gash (1986) based upon surface roughness to estimate the fraction of evaporation sensed from a specified distance upwind of the monitoring station. This theoretical analysis (assuming near-neutral conditions) reveals that the fraction of evaporation contributed by the surrounding area increases steadily to a value of 77% at a distance of 224 m and thereafter declines rapidly. Thus, point climate observations may not reflect surface conditions at greater distances. This result was tested through the deployment of four weather stations on the wetland. The resultant data suggested that homogeneous conditions prevailed so that the central weather station provided reliable areal estimates of reference evaporation during the observation period March–April 1999. This may be a result of not accounting for high wind speeds and roughness found in wetlands that lead to widespread atmospheric mixing. It should be noted this analysis was based upon data collected during the period March-April when wind direction was constant (westerly) and the land surface was moist. There could be more variation at other times of the year that would lead to greater heterogeneity in actual evaporation.
Keywords: evaporation, Penman-Monteith, automatic weather station, fetch, wetland
Introduction
Evaporation is frequently the most significant loss of water from a wetland but investigation of this variable suffers from a lack of reliable measurements as noted by Ibanez et al. (1999) and Tagaki et al. (1998). Of significance for this paper is the paucity of specific work on evaporation from wet grasslands leading calls from Cain (1998), Jensen et al. (1990) and Wessel and Rouse (1994) for more studies of grassland evaporation. The application of evaporation models based upon single land cover types, e.g. the Penman-Monteith extensive leaf approach (Allen et al., 1989), to wetlands encounters potential theoretical problems related to the spatial scale of measurements (Dunin, 1991, Lafleur and Rouse, 1988). Wetlands are typically small hetero-geneous landscape features, characteristically wetter than the surrounding land. In practice, wetlands often comprise a complex mosaic of wet and dry patches and, for such spatially inhomogeneous sites, advection may lead to point
estimates of evaporation based on a single monitoring station being unrepresentative.
For wetlands, advection has two effects:
z The fetch effect, i.e. air moving from dry to wet surfaces.
Thus point meteorological observations may misrepresent atmospheric conditions over the wetland. A certain fetch upwind is necessary for air from the non-wetland surface adjust to the characteristics of the wetland.
z. Thermal gradients are modified across a mosaic of
wetter and drier surfaces. Areas outside and within the wetlands with different thermal characteristics can cause temperature and evaporation changes. For example, a ditch adjacent to drier land can be influenced by the higher temperatures of the adjacent land in summer, which can affect the evaporation rate.
H. Gavin and C.T. Agnew
As climatic data are not collected routinely from wetland areas, data from nearby stations in non-wetland areas may not be representative of the wetland for the computation of evaporation. For example, what is a representative surface, where should the monitoring station be placed, what is the variability of climatic variables over the wetland, and are point measures of evaporation reliable?
This research investigated the variability of reference evaporation by monitoring temperature, humidity and windspeed at four locations over the wet grassland.
Study site
The research presented here was undertaken at Elmley Marshes National Nature Reserve, within the North Kent Marshes wetland complex in Southeast England, UK (Fig. 1). The North Kent Marshes are a site of international importance as defined by the Ramsar Convention on Wetlands and a Special Protection Area under the European Union Directive 79/409/EEC on the conservation of wild birds (Briscoe, 1988). Elmley Marshes have been the focus of recent studies (e.g. Milsom et al., 2002; Al-Khudhairy et
al., 1999, 2001; Agnew and Gavin, 2000; Gavin and Agnew,
2000a, b).
The wet grassland comprises a series of fields, intersected by ditches, managed to achieve conservation objectives. Grazing produces a short to medium length sward, with mixtures of Agrostis capillaris, Festuca rubra, Lolium
perenne, Hordeum secalinum, and Cynosurus cristatus
(Harpley, 1999). The topography of the site is very flat (<2 m OD) with complex relief on a micro scale caused by its reclamation from saltmarsh. The irregular micro-topographical differences create a mosaic of grass and water patches that vary in size seasonally according to the degree of surface flooding. An analysis of soil moisture variability (Gavin, 2001) indicated changes on a small spatial scale (approximately 10 m). The soil series covering the marsh is Wallasea, a non-calcareous clayey alluvial gley (Fordham and Green, 1980), overlain by a highly organic surface layer. Soil salinity increases with depth from non-saline topsoil to moderately saline subsoil at depths greater than 1 m (Gavin, 2001; Hazelden et al., 1986). The hydrology of the site is dominated by vertical fluxes of precipitation and evaporation, and the wetland surface is characterised by temporal changes in wetness with saturation over winter and spring and soil moisture and ditch water depletion during summer (Gavin, 2001; Gavin and Agnew, 2000b).
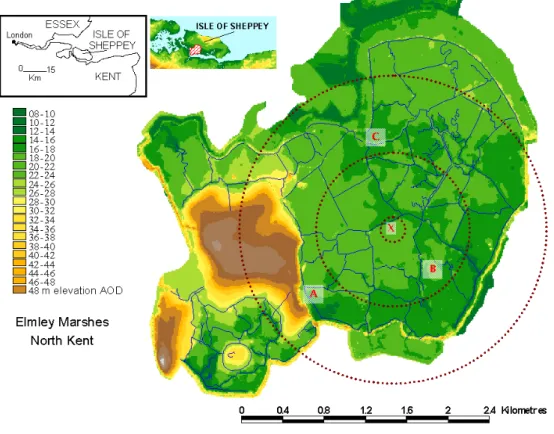
Fig. 1. The location of the study site relative to London is shown and the position of the Elmley marsh on the Isle of Sheppey is shaded on the
insert map. Point x on the map represents the location of the central AWS; A, B and C mark the positions of the micrometeorological stations. The elevation of the site is low with most of the land under 2 m OD. The concentric circles upon the map of the study site represents the fetch distance from the central AWS that ‘sources’ 95% (inner ring), 98% (middle ring) and 99% (outer ring) of the evaporation stream. It can be seen some evaporation can be ‘sourced’ from the surrounding sea (to the south) and urban areas (to the north) outside the wetland area.
Data collection
An Automatic Weather Station (AWS) (site X, Fig. 1) was installed at the study site and three micro-meteorological stations (sites A, B and C) were located adjacent to wet ditches at the edge of fields so that they could not be reached by cattle. Their locations recognised the need to monitor conditions around the boundaries of the wetland and near the sea; to contrast ditch and grass environments, accessibility and to sample the climate around the AWS. The instruments were operated according to the manufacturer’s recommendations, with fortnightly visits for routine maintenance. The three micro-met stations comprised MP100A humidity (± 1%) and temperature (± 0.5oC) sensors at a height of 1 m; and a Young wind monitor
(± 0.3 m s–1,± 3o) at a height of 2 m.
The investigation reported here uses data collected over the period March to mid April 1999, from 0800 to 1900 hours. The data will be analysed by comparing firstly the variables measured from micro-meteorological stations against the AWS and secondly the rates of evaporation computed for each station (on the assumption that net radiation is constant, taken from the central AWS) using the Penman-Monteith formula with standard surface resistance of 70 s m–1.
Theory
FETCHBrutsaert (1982) developed a method for determining the fetch requirements based on a consideration of surface roughness. With the common assumption that the lower 10% of an internal boundary layer downwind of a surface discontinuity has reached a new equilibrium, the minimum fetch can be determined as (for near-neutral conditions):
(
)
(
)
14 . 1 125 . 0 30 − = om f Z d z x (1)See Table 1 for nomenclature.
Equation 1 was employed to compute the minimum fetch requirements for the AWS at site X (Fig. 1). The height of the grass sward of the study field, monitored on field visits, ranged between 0.02 and 0.09 m with an average value of 0.04 m over the period. The fetch was determined for all grass heights and a value for water was also computed using a value of Zom= 0.0001 (after ASCE, 1996).
An estimate of the fraction of λE sensed from a specific distance of upwind fetch as ‘seen’ at a specific instrument height can be calculated after Gash (1986) and Schuepp et
al. (1990):
(
)
(
)
(
)
− − − − − − = d z Z x k Z Z d z d z F om f om om 1 ln 1 exp 2 (2)Equation 2 represents F for conditions of neutral stability, with a tendency to over-predict F for stable conditions and under-predict for unstable conditions. It is a useful simple method to generate an estimation of the quality of point meteorological observations. The value of F indicates the fraction of evaporation (or H) sourced by the surface cover over which the sensors were located (see Fig. 1). F should be close to 1 for measurements to be completely representative of the measurement surface.
REFERENCE EVAPORATION: THE PENMAN-MONTEITH APPROACH
The term evaporation is used here for the diffusion of water vapour into the atmosphere to avoid confusion associated with the term evapotranspiration following the advice of Monteith (1981).
Evaporation from a vegetated surface can be described by the Penman-Monteith model (Monteith, 1981, 1965), which has been widely reviewed and employed. Investigations of evaporation from grass commonly utilise the concept of the ‘reference grass surface’, an actively growing uniform stand, with an adequate water supply and a grass height of between 0.08-0.15 cm completely shading the ground, with a fixed surface resistance of 70 s m–1 (Smith
et al., 1992; Jensen et al., 1990; Doorenbos and Pruitt, 1977).
The computation of the Penman-Monteith formula is outlined by Allen et al. (1989):
) 1 ( ) ( ) ( ra rsra ed ea c G Rn E p + + ∆ − + − ∆ = γ ρ λ (3) where z oh h om m U k Z d Z Z d Z ra 2 ln ln − − = (4) c h d 3 2 = (5) c om h Z =0.123 (6) om oh Z Z =0.1 (7)
The aerodynamic resistance (ra) represents the effect of the physical roughness of the vegetation affecting the upward transfer of energy and water vapour away from the evaporating surface; the surface resistance (rs) represents
H. Gavin and C.T. Agnew
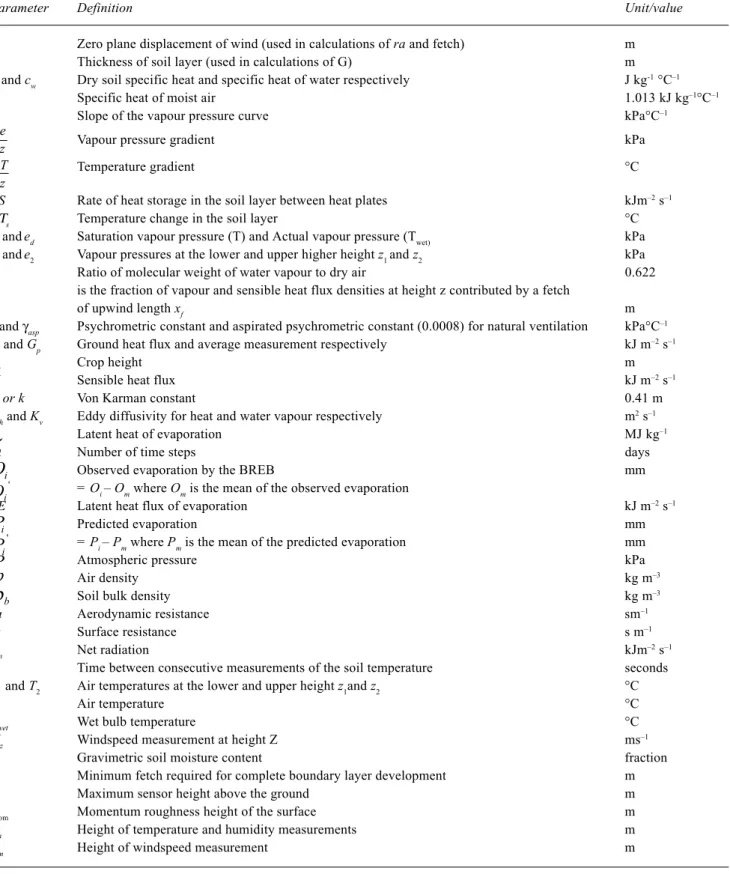
Table 1. Units of measurements or values of parameters.
Parameter Definition Unit/value
d Zero plane displacement of wind (used in calculations of ra and fetch) m
d Thickness of soil layer (used in calculations of G) m
cs and cw Dry soil specific heat and specific heat of water respectively J kg-1 °C–1
cp Specific heat of moist air 1.013 kJ kg–1°C–1
∆ Slope of the vapour pressure curve kPa°C–1
Vapour pressure gradient kPa
Temperature gradient °C
∆S Rate of heat storage in the soil layer between heat plates kJm–2 s–1
∆Τs Temperature change in the soil layer °C
ea anded Saturation vapour pressure (T) and Actual vapour pressure (Twet) kPa
e1 ande2 Vapour pressures at the lower and upper higher height z1 and z2 kPa
ε Ratio of molecular weight of water vapour to dry air 0.622
F is the fraction of vapour and sensible heat flux densities at height z contributed by a fetch
of upwind length xf m
γ and γasp Psychrometric constant and aspirated psychrometric constant (0.0008) for natural ventilation kPa°C–1
G and Gp Ground heat flux and average measurement respectively kJ m–2 s–1
hc Crop height m
H Sensible heat flux kJ m–2 s–1
K or k Von Karman constant 0.41 m
Kh and Kv Eddy diffusivity for heat and water vapour respectively m2 s–1
λ
Latent heat of evaporation MJ kg–1n
Number of time steps daysi
O
Observed evaporation by the BREB mm' i
O = Oi – Om where Om is the mean of the observed evaporation
λE Latent heat flux of evaporation kJ m–2 s–1
i
P
Predicted evaporation mm'
i
P
= Pi – Pm where Pm is the mean of the predicted evaporation mmP
Atmospheric pressure kPap
Air density kg m–3b
ρ
Soil bulk density kg m–3ra Aerodynamic resistance sm–1
rs Surface resistance s m–1
Rn Net radiation kJm–2 s–1
t
Time between consecutive measurements of the soil temperature secondsT1 and T2 Air temperatures at the lower and upper height z1and z2 °C
T Air temperature °C
Twet Wet bulb temperature °C
Uz Windspeed measurement at height Z ms–1
w Gravimetric soil moisture content fraction
xf Minimum fetch required for complete boundary layer development m
z Maximum sensor height above the ground m
Zom Momentum roughness height of the surface m
Zh Height of temperature and humidity measurements m
Zm Height of windspeed measurement m
plant control of transpiration via its stomata. Aerodynamic resistance values were computed using Eqn. 4 with average
grass sward heights of the marshland and windspeed data from the meteorological stations.
∆e ∆z ∆T ∆z
Results and discussion
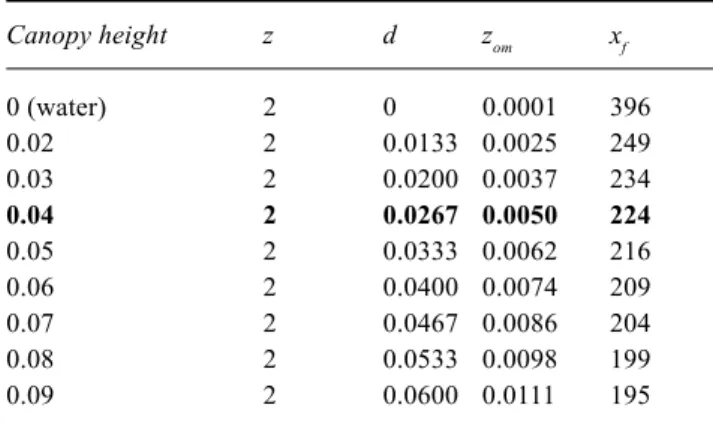
Results for the analysis of fetch are presented in Table 2; as surface roughness increases, i.e. with an increase in canopy height, the fetch requirement decreases due to the greater turbulence and associated convective mixing. The minimum fetch requirements under stable conditions for the grass surface ranges between 249 and 195 m depending upon sward height. For the average sward height of 0.04 m, the required upwind fetch length is 224 m which is fulfilled in all directions from the location of the meteorological instrumentation at site X except for 250–260°, where at 200 m distance there is a paved area and small farm building. Therefore, data when the wind direction was 250–260° have been rejected due to insufficient fetch; however, this was on only one day over the study period.
Equation 2 was applied to determine F for the study field using the range of values of xf generated by the different sward heights. Results presented in Table 3 indicate that there is little sensitivity over this narrow range of heights with 0.76-0.77 of λE generated from the computed fetch using Eqn. 1. It appears that a longer fetch is required to ensure that evaporation measurements are representative of the surface. The effect of increasing the fetch upon F was examined by increasing the xf term in Eqn. 2, using the average sward height of 0.04 m and keeping other factors constant. Figure 2 shows that the relationship between xf and F follows an inverse exponential curve with a fetch far greater than 224 m to attain a value of F close to 1. Figure 1 represents the fetch distance from the central AWS that ‘sources’ 95%, 98% and 99% of the evaporation stream. The three micro-meteorological stations lie outside the minimum fetch computed for the AWS at X, but lie within the source area for evaporation. Their data should, therefore, provide an adequate basis for an examination of evaporation variability based on a comparison of different climate conditions.
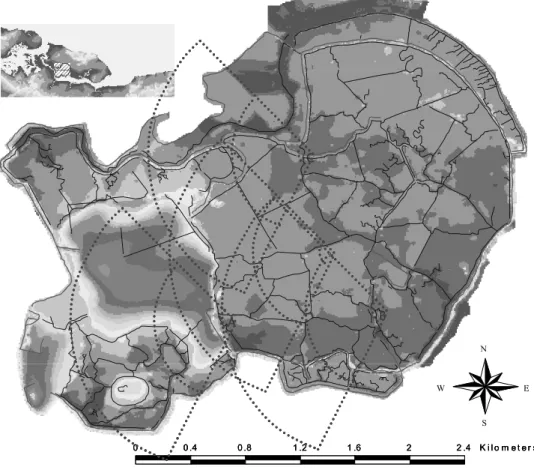
Wind direction (Fig. 3) is predominantly in the SW–NW for all stations; 65% of wind received is in this direction. Hardly any air arrives from the east, so the air monitored at the AWS has travelled mainly over adjacent western wetland areas (Fig. 4).
Wind run was observed over 20-minute intervals at sites A, B and C and then averaged over hourly periods for all sites. Figure 5 shows that up to windspeeds of 5.5 m s–1,
values for all stations are similar. Windspeeds up to 13 m s–1 are registered on the AWS; however, the micro
station combined windspeed and direction sensor has a maximum of 5.5 m s–1 because of data storage constraints,
Table 3. Estimation of the fraction F of λE (Eqn. 2) sensed at certain upwind fetch distances (m) (Eqn. 1). Fetch is expressed over the range of grass sward height (m). Results using the average grass height (0.04 m) over the period are italicised. Canopy height m z xf F 0.02 2 249 0.763 0.03 2 234 0.766 0.04 2 224 0.769 0.05 2 216 0.771 0.06 2 209 0.774 0.07 2 204 0.776 0.08 2 199 0.778 0.09 2 195 0.780
Table 2. Minimum upwind fetch distances for the range of
canopy heights experienced over the study field 1999 (Eqn. 1). Results using the average grass height (0.04 m) over the period are in bold. All parameters have units in m.
Canopy height z d zom xf 0 (water) 2 0 0.0001 396 0.02 2 0.0133 0.0025 249 0.03 2 0.0200 0.0037 234 0.04 2 0.0267 0.0050 224 0.05 2 0.0333 0.0062 216 0.06 2 0.0400 0.0074 209 0.07 2 0.0467 0.0086 204 0.08 2 0.0533 0.0098 199 0.09 2 0.0600 0.0111 195 0 0.1 0.2 0.3 0.4 0.5 0.6 0.7 0.8 0.9 1 0.0 0.2 0.4 0.6 0.8 1.0 1.2 1.4 1.6 1.8 2.0 2.2 2.4 Distance km F
Fig. 2. The change in the fraction F of λE with increasing fetch
distance for the conditions at the study site (z=2 m, mean grass height = 0.04 m). The data point represents the fetch distance for the mean grass height = 0.04 m.
H. Gavin and C.T. Agnew
so the occasions where the highest wind speeds were not recorded by the micro stations have been filtered out in the comparative analysis of evaporation below.
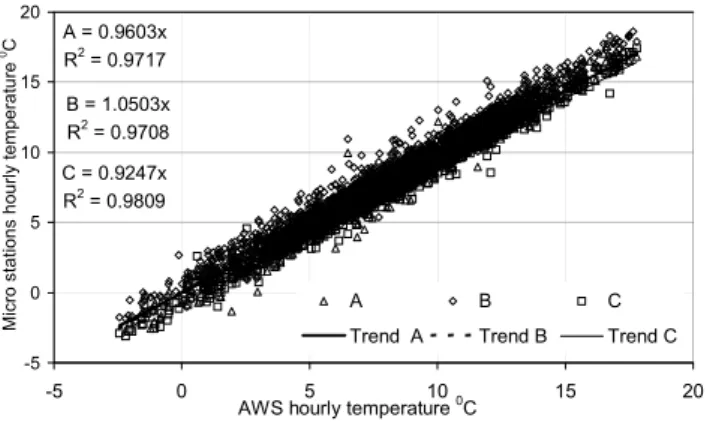
Hourly temperature data (Fig. 6) show a very close trend with all sensors despite location differences, i.e. exposures adjacent to water filled ditches (A, B and C) and open grassland (X). Regression values are very high between the stations and the gradient of the regression lines are close to unity.
Hourly relative humidity data (Fig. 7) are very similar despite location and sensor differences (the AWS uses wetbulb temperature depression, the MP100A are solid state instruments). Figure 4 shows that while stations at sites B, C and X source the wetland, station A is adjacent to land of a higher elevation but there is no apparent difference. The humidity data display more scatter than temperature but again gradients are close to unity.
Figure 8 displays daily reference evaporation (Eqn. 3) for the period 6 March to 14 April with data filtered (1-5 March and 15th April) for periods when the wind speed
measurements were unreliable. The reference evaporation calculated from the AWS data agrees closely with that 0 5 10 15 20 25 30N NE E SE S SW W NW A B C
Fig. 3. The predominant wind direction over the wetland recorded
by the micrometeorological station over March to mid April 1999. There is a close trend of wind direction predominantly in the SW-NW for all stations; 65% of wind received is in this direction.
* . 0 0 .4 0 .8 1 .2 1 .6 2 2 .4 K i l o m e t e r s N E W S C A B * . 0 0 .4 0 .8 1 .2 1 .6 2 2 .4 K i l o m e t e r s 0 0 .4 0 .8 1 .2 1 .6 2 2 .4 K i l o m e t e r s N E W S C A B
Fig. 4. This shows the direction of the predominant wind over the time period monitored for each of the monitoring sites. The source areas for
A = 0.8626x R2 = 0.8244 B = 0.9229x R2 = 0.8189 C = 0.886x R2 = 0.8937 0 1 2 3 4 5 6 7 8 0 1 2 3 4 5 6 7 8
AWS hourly windspeed ms-1
Micro Stations hourly windspeed ms
-1
A B
C Trend A Trend B Trend C
Fig. 5. Contrast of hourly windspeed data from the micro stations
against the AWS.
A = 0.9603x R2 = 0.9717 B = 1.0503x R2 = 0.9708 C = 0.9247x R2 = 0.9809 -5 0 5 10 15 20 -5 0 5 10 15 20
AWS hourly temperature 0C
Micro stations hourly temperature
0C
A B C
Trend A Trend B Trend C
Fig. 6. Contrast of hourly temperature data from the micro stations
against the AWS.
A = 1.011x R2 = 0.829 B = 1.066x R2 = 0.6924 C = 1.0016x R2 = 0.7905 30 40 50 60 70 80 90 100 30 40 50 60 70 80 90 100 AWS hourly relative humidity %
Micro stations hourly relative humidity %
A B
C Trend A
Trend B Trend C
Fig. 7. Contrast of hourly relative humidity data from the micro
stations against the AWS.
derived from the micro stations; there is a difference of only a few mm over the entire study period. It should be noted that the study has compared rates of reference evaporation based upon the conditions laid down by Smith et al. (1992). The data were collected during spring when moisture availability across the wetland was at reference conditions and daily evaporation did not exceed 2.5 mm. The
0.0 0.5 1.0 1.5 2.0 2.5
6-Mar 9-Mar 12-Mar 15-Mar 18-Mar 21-Mar 24-Mar 27-Mar 30-Mar 2-Apr 5-Apr 8-Apr 11-Apr 14-Apr
mm evaporation
AWS A B C
Fig. 8. Reference evaporation (1999) computed for the four stations
using data screened so that only windspeeds under 5.5 ms-1 are
employed. The cumulative evaporation loss over this screened time period is as follows: AWS=25.7 mm, A=24.5 mm, B=23.7 mm,
C=25.0 mm.
approaches employed (Eqns. 1 and 2) are not dependent upon moisture availability hence the analysis of fetch and source reference evaporation should apply through the year assuming no significant change in sward height. However, as wind direction changes — for example to include farmland to the east — and as the wetland dries out, it is possible that local conditions will show greater heterogeneity and actual evaporation rates may vary across the wetland. This assumption ought to be the subject of further investigation. Actual rates of evaporation can be expected to become lower than reference rates as the wetland dries. Modelling actual evaporation then becomes more complex with the need to employ appropriate values of surface resistance (rs) and aerodynamic resistance (ra) for changes in vegetation height and moisture availability. The spatial variability of soil moisture conditions and computation of surface resistances has been addressed elsewhere for this wetland by Gavin (2001) and Gavin and Agnew (2000a, b).
Conclusions
Over this wet grassland (and similar landscapes), variation in temperature, relative humidity and windspeed is slight during the period of data collection i.e. March-April, despite differences in land cover and micro topographical changes. The reference evaporation computed from four different places is thus very similar. The high windspeeds over the surface, and the microtopography, despite short canopy height, must give rise to good mixing and turbulence which acts to mix the thermal effects of the different surface types into a homogenised air stream.
Thus, atmospheric conditions are much more homogeneous than anticipated. The implication is that a meteorological station placed almost anywhere across this
H. Gavin and C.T. Agnew
wetland would provide representative estimates of reference evaporation. Furthermore, the mixing means that individual patches do not influence overlying atmospheric conditions significantly. Results at other times of the year may differ because of greater heterogeneity in actual evaporation caused by changes in source area and surface conditions.
Acknowledgements
Instrumentation was supplied by CEH Wallingford (AWS) and the Department of Geography, UCL. The Bowen Ratio Station was funded by a NERC small grant (no: GR9/3434). The authors are very grateful to the Elmley Conservation Trust for allowing access to the marshes and allowing in
situ measurements to be made.
References
Agnew, C.T. and Gavin, H., 2000. Evaporation from a wet grazing marsh. Proceedings of the Seventh Annual British Hydrological
Society Symposium, Newcastle, September 2000.
Al-Khudhairy, D., Thompson, J.R., Gavin, H and Hamm, N.A.S., 1999. Hydrological modelling of a drained grazing marsh under agricultural land use and the simulation of restoration management scenarios. Hydrolog. Sci. J., 44, 943–971. Al-Khudhairy, D.H.A., Leemhuis, C., Hoffmann, V., Calaon, R.,
Shepherd, I.M., Thompson, J.R., Gavin, H. and Gasca-Tucker, D.L., 2001. Monitoring wetland ditch water levels in the North Kent Marshes, UK, using Landsat TM imagery and ground-based measurements. Hydrolog. Sci. J., 46, 585–597. Allen, R.G., Jensen, M.E., Wright, J.L. and Burman, R.D., 1989.
Operational estimates of reference evapotranspiration. Agron.
J., 81, 650–662.
ASCE American Society of Civil Engineers, 1996. Hydrology
Handbook. ASCE Manuals and Reports in Engineering Practice
No. 28. ASCE: New York.
Briscoe, B., 1998. Nature conservation sites in Kent. Kent County Council Planning Department.
Brutsaert, W., 1982. Evaporation into the atmosphere. Theory,
History and Applications. D. Reidel Publishing, Dordrecht, The
Netherlands.
Cain, J.D., 1998. Modelling evaporation from plant canopies. Report No.132, Institute of Hydrology, Wallingford, UK. Doorenbos, J. and Pruitt, W.O., 1977. Guidelines for predicting
crop water requirements. Irrigation and Drainage Paper 24, 2nd edition. UN-FAO, Rome.
Dunin, F.X., 1991 Extrapolation of point measurements of evaporation: some issues of scale. Vegetatio 91, 39–47. Fordham, S.J. and Green, R.D., 1980. Soils of Kent. Soil
Association, Harpenden.
Gash, J.H.C., 1986. A note on estimating the effect of limited fetch on micrometeorological evaporation measurements.
Bound.Layer Meteorol., 35, 409–413.
Gavin, H., 2001. Hydrology of the Elmley Marshes. PhD Thesis, University of London.
Gavin, H. and Agnew, C.T., 2000a. Estimating evaporation and surface resistance from a wet grassland. Phys. Chem. Earth (part B), 25, 599–603.
Gavin, H. and Agnew, C.T., 2000b. Hydrological investigations for wetland conservation: the North Kent Marshes ESA.
Proceedings of the Seventh National Hydrology Symposium.
University of Newcastle upon Tyne, 6-8 September 2000. Harpley, J., 1999. Water Level Management Plan for the Elmley
and Spitend Marshes. Lower Medway Internal Drainage Board.
Hazelden, J., Loveland, P.J. and Sturdy, R.G., 1986. Saline soils
in North Kent. Soil Survey. Special Survey No. 14.
Ibanez, M., Perez, P.J., Caselles, V. and Castellvi, F., 1999. Estimation of the latent heat flux over full canopy covers from the radiative temperature. J. Appl. Meteorol., 38, 423–431. Jensen, M.E., Burman, R.D. and Allen, R.G., 1990. Evaporation
and irrigation water requirements. ASCE Manual No. 70.
Lafleur, P. and Rouse, W.R., 1988. The influence of surface cover and climate on energy partitioning and evaporation in a subarctic wetland. Bound. Layer Meteorol., 44, 327–347.
Milsom, T.P., Hart, J.D., Parkin, W.K. and Peel, S., 2002. Management of coastal grazing marshes for breeding waders: the importance of surface topography and wetness. Biol.
Conserv.,103, 199–207.
Monteith, J.L., 1965. Evaporation and environment. Symp. Soc. Exp. Biol. XIX., Cambridge University Press.
Monteith, J.L., 1981. Evaporation and surface temperature. Quart.
J. Roy. Meteorolog. Soc., 107, 1–27.
Schuepp, P.H., Leclerc, M.Y., Macpherson, J.I. and Desjardins, R.L., 1990. Footprint prediction of scalar fluxes from analytical solutions of the diffusion equation. Bound. Lay. Meteorol. 50, 355–373
Smith, M., Allen, R.G., Monteith, J.L., Perrier, A., Pereira, L. and Segeren, A., 1992. Report of the expert consultation on
procedures for revision of FAO guidelines for prediction of crop water requirements. UN-FAO: Rome.
Takagi, K., Tsuboya, T. and Takahashi, H., 1998. Diurnal hystereses of stomatal and bulk surface conductances in relation to vapor pressure deficit in a cool temperate wetland. Agr. Forest
Meteorol., 91, 177–191.
Wessel, D. and Rouse, W.R., 1994 Moisture and temperature limits of the equilibrium evapotranspiration model. J. Appl. Meterol.,