Characterizing the Evolution of the Alternative Fuel Vehicle and
Infrastructure Nexus
by
Dustin Weigl
B.A., Physics, Middlebury College, 2013
Submitted to the Institute for Data, Systems, and Society &
the Department of Civil and Environmental Engineering
in partial fulfillment of the requirements for the degrees
of
Master of Science in Technology and Policy and
Master of Science in Transportation
at the
MASSACHUSETTS INSTITUTE OF TECHNOLOGY
February 2019
C Massachusetts Institute of Technology 2019. All rights reserved.
Signature redacted'
A uthor... ...
...
Institute for Data, Systems, and Society
Department of Civil and Environmental Engineering
January 22, 2019
Signature redacted
Certified by ...
. ..
John lrleywood
Sun Jae Professor of Mechanical Engineering, Sloan Automotive Laboratory
Thesis Supervisor
Signature redacted
A ccepted by ...
Noelle Selin
Director, Technology and Policy Program
Associate Professor, Institute for Data, Systems, and Society and
Earth, Atmospheric and Planetary Science
r
i
Signature redacted
A ccepted by ... ...
...
Heidi Nepf
Donald and Martha Harleman Professor of Civil and Envirolmental Engineering Chairman,
MASSACHUSETTS INSTITUTE Chair, Graduate Program Committee
OF TECHNOLOGY CO
w
FEB 2
82019
Characterizing the Evolution of the Alternative Fuel Vehicle and Infrastructure Nexus
by
Dustin Weigl
Submitted to the Institute for Data, Systems, and Society and the Department of Civil and Environmental Engineering
on January 22, 2019, in partial fulfillment of the requirements for the degrees of
Master of Science in Technology and Policy and
Master of Science in Transportation
Abstract
For decades, petroleum-based fuels have dominated as the primary energy source for the light duty vehicle (LDV) fleet in the United States and around most of the world. However, recent developments in alternative fuel vehicle (AFV) technology have led to viable alternatives to the traditional internal combustion engine. In particular, vehicles with zero tailpipe emissions including plug-in electric vehicles and fuel cell electric vehicles (FCEVs) powered by hydrogen fuel have the potential to greatly reduce transportation emissions. However, adoption of these vehicles has grown slowly for a number of reasons. One of the largest barriers to adoption is a chicken-or-egg problem; the interdependence between the adoption of AFVs and the expansion of a new network of refueling infrastructure to support them. This thesis examines the current status of refueling networks and AFV adoption around the world with a specific focus on the U.S. I specify the characteristics of the various impediments to AFV expansion including high purchase price, range anxiety, and consumer familiarity. I then present a series of sen-sitivity analyses examining the projected vehicle-infrastructure co-evolution using a system dynamics model parameterized for the United States private LDV fleet.
For battery electric vehicles, the results indicate that steady growth in market share is possible, given continued investment and political support. Adoption of FCEVs, on the other hand, is likely to grow much more slowly and these vehicles may not enter the U.S. market at all unless supported by signif-icant private investment or political intervention. However, signifsignif-icantly higher levels of adoption in concentrated areas may be possible in the simulated timeframe out to the year 2050.
Thesis Supervisor: John Heywood
Title: Sun Jae Professor of Mechanical Engineering, Sloan Automotive Laboratory
Acknowledgments
First and foremost, I want to thank my parents for all that they do and have done to support me in everything I do. They have taught me how to love, learn, and live and I of course never would have made it to (or through) my journey at MIT without their help. From helping me research internship applications to talking through the trials and tribulations of grad school, you've always given me a hand when it doesn't seem like there are enough hours in the day. I love you and thank you!
My advisor, Professor John Heywood, has been phenomenal not only in teaching me some of the ins
and outs of the automotive world but has also helped me navigate graduate student life with his wealth of experience at the institute. Our meetings were always very useful and insightful at many levels. Looking back at the past couple years, I'm constantly amazed by how much I have learned and many of those lessons were driven by thoughtful questions you asked.
Additionally, Rakesh Sridhar and Chintan Vaishnav have been an integral part of the work presented here. I've really enjoyed working with both of you and the rest of the Mobility of the Future team over the past few years. I'd also like to thank David Keith for his guidance and originally offering the use of his system dynamics model for this work.
I also want to thank my friends in the Technology and Policy Program and in Transportation for
enrich-ing my experience over the past couple years. Havenrich-ing the opportunity to learn from and grow closer to all of you has been the highlight of my time at MIT. Can't wait to see what everyone decides to do-keep in touch!
Contents
Introduction 11
1 The Vehicle-Infrastructure Nexus 12
1.1 Description of Powertrains . . . . 12
1.2 Problem Statement . . . . 13
1.2.1 Powertrain Selection . . . . 14
1.2.2 Current State of Fueling Infrastructure . . . . 14
2 Plug-in Electric Vehicle Adoption 16 2.1 Electric Vehicle Charging . . . . 16
2.1.1 Charger Specifications . . . . 17
2.1.2 Trends in Global Infrastructure Build-out . . . . 18
2.1.3 Infrastructure Driving PEV Adoption . . . . 18
2.2 Barriers to U.S. PEV Adoption . . . . 20
2.2.1 Infrastructure Availability and Range Anxiety . . . . 20
2.2.2 EVSE Solvency . . . . 20
2.2.3 Vehicle Price and Government Incentives: PEVs . . . . 21
2.2.4 Battery Prices . . . . 22
2.2.5 Extreme Fast Charging . . . . 22
2.2.6 Home Charging Availability . . . . 23
3 U.S. Hydrogen Vehicle Adoption 24 3.1 Hydrogen Fuel Production . . . . 24
3.2 Broader Hydrogen Applications . . . . 24
3.3 Barriers to FCEV Adoption . . . . 25
3.3.1 Hydrogen Station Build-out . . . . 25
3.3.2 Hydrogen Fuel Prices . . . . 25
3.3.3 Vehicle Price and Government Incentives: FCEVs . . . . 26
3.3.4 Available Vehicle Models . . . . 27
4 U.S. AFV Sales Projections Modeling 28 4.1 System Dynamics Model Overview . . . . 28
4.1.1 Vehicle Utility . . . . 29
4.1.2 Powertrain Familiarity . . . . 30
4.1.3 Key Model Parameters . . . . 30
4.1.4 Powertrain Parameters . . . . 31
4.1.5 Infrastructure Parameters . . . . 31
CONTENTS 7
4.2.1 Home Charger Installation Cost . . . . 32
4.3 Model Limitations . . . . 33
5 Analysis of System Dynamics Results 34 5.1 Scenario Definitions . . . . 34
5.2 Market Share Analysis . . . . 36
5.2.1 Vehicle Price . . . . 38
5.3 Plug-in Electric Vehicle (PEV) Infrastructure Sensitivity Analysis . . . . 39
5.3.1 BEV Charging Rate . . . . 39
5.3.2 Useful Time Spent While Charging . . . . 40
5.3.3 Home Charging . . . . 41
5.3.4 Workplace Charging . . . . 42
5.3.5 BEV Driving Range Concerns . . . . 43
5.4 FCEV Case Study: Los Angeles . . . . 44
5.4.1 Government Infrastructure Support . . . . 44
5.4.2 Impact of Marketing on FCEV Adoption . . . . 45
6 Conclusions 48 6.1 The PEV Advantage . . . . 48
6.2 Next Steps for FCEVs . . . . 48
6.3 Takeaways . . . . 49
A Appendix: System Dynamics Model Details 54
List of Figures
1-1 Overview of powertrains by fuel source and propulsion system . . . . 13
2-1 Historical Trends in Global Public Level 2 Charger Density . . . . 19
2-2 Historical Trends in Global Public Level 3 Charger Density . . . . 20
2-3 Build-out of Level 2 and 3 Public Charging Stations in the U.S. (2018) . . . . 21
2-4 Maximum charging power, battery size, and charging speed (ideal conditions) compari-son across BEV models . . . . 23
3-1 Build-out of Hydrogen Fueling Stations in the U.S (2018) . . . . 26
3-2 Historical Model Offerings for BEVs, PHEVs, and FCEVs in the U.S. . . . . 27
4-1 Modeling Consumer Vehicle Choice- Sensitive Parameters . . . . 28
4-2 A simplified diagram illustrating some of the important reinforcing ("R") feedback loops powering the SD model. . . . . 29
5-1 Operating costs over time by powertrain: Reference scenario . . . . 35
5-2 Operating costs over time by powertrain: Paris to 2C scenario . . . . 36
5-3 Market share of different powertrains until 2050: Paris to 2C scenario . . . . 37
5-4 Market share of different powertrains until 2050: Reference scenario . . . . 37
5-5 Market share of BEV sales under different average growth rates for charging power (Ref-erence scenario) ... ... 40
5-6 Utility of BEVs with varying Time in Useful Activities while charging (Reference scenario) 41 5-7 BEV market share in 2040 and number of Level 2 public charging stations built given varying percentage of energy sourced from home charging . . . . 42
5-8 Utility of BEVs with varying reference all electric vehicle range (Reference scenario) . . 44
5-9 Government H2 station construction impacts on FCEV sales and overall station build-out in LA m odel . . . . 45
5-10 Varying impacts of marketing on FCEV market share in the U.S. and LA over time: Ref-erence scenario ... ... 46
5-11 Varying impacts of marketing on FCEV market share in the U.S. and LA over time: Paris to 2C scenario ... ... 47
A-1 Overview of the System Dynamics Model . . . . 54
A-2 Infrastructure Co-evolution: Feedback loop between vehicle sales and infrastructure buildout ... .... ... 55
A-3 Familiarity accumulation: Feedback between consumer familiarity and sales of a pow-ertrain . . . . 56
LIST OF FIGURES
A-4 Learning: Feedback between production of a powertrain and improvement in related
technology . . . . 57
A-5 Major inputs and outputs in the system dynamics model . . . . 57
B-1 Operating costs over time by powertrain: Paris Forever scenario . . . . 58
B-2 Market share of different powertrains until 2050: Paris Forever scenario . . . . 59
B-3 Market share of BEV sales under different average growth rates for charging power: Paris Forever Scenario . . . . 59
B-4 Market share of BEV sales under different average growth rates for charging power: Paris To 2C Scenario . . . . 60
B-5 Utility of BEVs with varying Time in Useful Activities while charging: Paris Forever Scenario 60 B-6 Utility of BEVs with varying Time in Useful Activities while charging: Paris To 2C Scenario 61 B-7 Utility of BEVs with varying reference all electric vehicle range: Paris Forever Scenario . 61 B-8 Utility of BEVs with varying reference all electric vehicle range: Paris To 2C Scenario . 62 B-9 Varying impacts of marketing on FCEV market share in the U.S. and LA over time: Paris Forever scenario . . . . 62
List of Tables
1-1 Counts of public fueling stations (2018 unless noted otherwise) . . . . 15
2-1 Typical charging infrastructure characteristics and definitions . . . . 18
2-2 Selected 2017 PEV sales by country . . . . 19
4-1 Weightings for each of the factors contributing to the "utility" of each powertrain over tim e. . . . . 29
4-2 General model assumptions characterizing the US consumer LDV market . . . . 30
4-3 Basic powertrain characteristics . . . . 31
4-4 Basic fueling infrastructure characteristics . . . . 32
5-1 Scenario Definitions: Retail Fuel Prices in 2030 and 2050 . . . . 34
11
Introduction
According to the International Panel on Climate Change, 23% of global energy-based greenhouse gas emissions are driven by the demands of transportation. Further, research indicates it is "very likely" that the increase in greenhouse gases in our atmosphere is the primary cause for the observed increase in global mean surface temperature (Rogelj et al. 2018). These gases collectively represent a threat to the survival of thousands of animal species, the integrity of our coastlines, and the balance of ecosystems around the world. These impacts are considered a negative externality because their enormous cost is not included in the pricing of petroleum-based fuels nor the vehicles that use them.
In the United States, internal combustion engines vehicles (ICEVs) have been the cornerstone of trans-portation technology for decades and give individuals the capability to travel great distances at their leisure. However, with the growing ubiquity of ICEVs came a great increase in tailpipe emissions from the burning of petroleum-based fuels. These emissions include an array of greenhouse gases (GHG) that mix with the atmosphere and play a role in the rise of climate change. Since these effects are not captured in the price of ICEVs or the fuel they use, third parties to these transactions are shouldering the cost of these negative externalities.
Alternative fuel vehicle (AFV) technology has been developing rapidly in response to policy aimed at reducing the emissions associated with light duty vehicle (LDV) transportation. Governments around the world have enacted incentives and set benchmarks to encourage the adoption of AFVs with goals of rectifying this externality. However, AFV sales in the U.S. market have been growing at a modest rate and remained around 1% of new vehicle sales in 2018. The various technology options are all relatively new and do not yet benefit from the powerful network and scaling effects that have aided ICEVs in their domination of the LDV market. However, serious policy intervention has resulted in more rapid growth of adoption in recent years and it appears that this shift in adoption is likely to continue given sustained government support.
This thesis begins with an overview of the current status of AFV technology and related refueling infrastructure build-out. I then examine plug-in electric vehicles (PEVs) and fuel cell electric vehicles (FCEVs), two of the most promising AFV , in greater depth. These sections outline the largest barriers to adoption these powertrains each face. Finally, I present a series of sensitivity analyses derived from system dynamics model simulations. These results examine projections for the course of PEV and FCEV adoption out to 2050 under different policy scenarios and vehicle market conditions. This work was originally conducted as part of the Mobility of the Future research study within the MIT Energy Initiative from 2016-20191.
'I worked closely with Rakesh Sridhar on this project and further analysis on the business models associated with electric vehicle charging can be found in his 2019 MIT Master's thesis.
Chapter 1
The Vehicle-Infrastructure Nexus
The enormous build-out of gasoline stations and related distribution systems is one of the largest ad-vantages ICEVs have over their competitors. Across the vast majority of the country, the infrastructure network for AFVs is still in its infancy AFV powertrains must therefore both become more competitive with traditional ICEVs and be accompanied by the build-out of a robust network of refueling infrastruc-ture for these technologies to mitigate vehicle emissions. The build-out of alternative fuel infrastrucinfrastruc-ture and adoption of the vehicles it supports is often described as a chicken-or-egg problem. One cannot exist without the other and a feedback loop exists wherein the expansion of one encourages the development of the other.
1.1
Description of Powertrains
This analysis will compare the supporting infrastructure and parallel adoption of the following power-trains. An overview of the propulsion systems and fuel sources for these powertrains is given in Figure
1-1
Internal Combustion Engine Vehicle (ICEV)
The majority of vehicles in the global fleet today are powered by gasoline spark-ignition or diesel en-gines. These two powertrains are fueled by gasoline or diesel liquid fuel respectively and are referred to collectively in this thesis as ICEVs.
Hybrid Electric Vehicle (HEV)
HEVs have both an engine and electric motor but can only be refueled with liquid petroleum-based fuels. HEVs have a small battery ( 1.5 kWh) that can reclaim and store energy lost while braking (known as regenerative braking). The energy in the battery can then power the motor to drive the vehicle and supplement the energy derived from the petroleum-based fuel used to power the engine.
Plug-in Hybrid Electric Vehicle (PHEV)
PHEVs are an extended range hybrid vehicle that can operate under two modes. The first, called charge-depleting, uses an electric motor and mid-size battery (<20 kWh) that can be charged both by regenerative braking and by being plugged in. The second is called charge sustaining and operates with a combustion engine fueled by gasoline. The share of driving energy derived from electricity (known
1.2. PROBLEM STATEMENT 13
as the utility factor) depends on the all-electric range of the PHEV but varies from approximately 30% for a 25-mile range to 75% for a 40-mile range (Pl6tz et al. 2017)
Battery Electric Vehicle (BEV)
BEVs are powered solely by an electric motor with electricity stored in a large 40-100 kWh battery array. BEVs have zero tailpipe emissions. I address PHEVs and BEVs together as PEVs in this thesis because their adoption is closely linked based on developments in charging infrastructure and battery
technology.
Fuel Cell Electric Vehicle (FCEV)
FCEVs run on energy stored in the hydrogen fuel that is converted to electricity in a fuel cell to charge a small, on-board battery that can also be charged through regenerative braking. The electrical energy in the battery is then used to power the FCEV's motor. The only byproducts of this process are heat and water, so FCEVs also have zero tailpipe emissions. With this dual power system, FCEVs are also classified as hybrid vehicles.
Figure 1-1: Overview of powertrains by fuel source and propulsion
Energy Source Propulsion Device
ICEV Fossil Fuel ICE
HEV
Motor EVs PHEV BEV Battery FCEV H2 Fuel system1.2 Problem Statement
While there is a range of AFV technologies in development, PEVs and FCEVs have so far emerged as the most promising in their potential for mitigating LDV greenhouse gas emissions in the U.S. Currently, the adoption of PEVs and build-out of charging infrastructure has far surpassed that of FCEVs and the analysis that follows in this thesis is weighted to reflect those conditions. However, there are still significant barriers that may continue to impede the adoption of both these technologies.
This research seeks to answer the following questions:
" What are the influential factors driving or impeding the feedback loops between the build-out of
fueling infrastructure and the adoption of PEVs and FCEVs?
* Given those factors, what are the projected outcomes of this co-evolution based on steps taken by governments, original equipment manufacturers (OEMs), and infrastructure providers to increase PEV and FCEV market share in the U.S. LDV fleet?
1.2.1 Powertrain Selection
I focus primarily on the proliferation of PHEVs, BEVs, gasoline-fueled ICEVs, HEVs, and
hydrogen-fueled FCEVs for a number of reasons. Vehicles hydrogen-fueled by natural gas (NGVs) offer some advantages over gasoline and diesel fueled vehicles in terms of local pollutant emissions (NOx, CO and particulate), and this advantage has driven most of the deployment of NGVs in many countries. NGVs may also continue to grow as a promising option for the heavy-duty sector (Heywood et al., 2015). However, their potential for reducing greenhouse gas emissions in the LDV fleet is limited compared to zero-emission vehicle technologies.
While the advantages in greenhouse gas emission reductions are relatively small for NGVs compared to FCEVs or PEVs, biomethane-fueled vehicles offer a substantial GHG advantage over gasoline and diesel. Unfortunately, the biomethane supply remains limited. Other biofuels offer improvements in the cur-tailment of local pollutants and greenhouse gas emissions, but the biofuels industry has encountered challenges in developing scalable and economic biofuels. An additional hurdle to low GHG biofuel pro-duction is the emission-intensive land use changes necessary for biofuel feedstock and impacts on food prices (Martin, 2016). Therefore, for this analysis, I focused on the petroleum-fueled ICEV (and HEV) incumbent and scalable deep decarbonization alternative fuel vehicles (PEVs and FCEVs) supported by strong government policies for LDVs.
1.2.2 Current State of Fueling Infrastructure
The various refueling networks will evolve from the current build-out of stations for each of the fuel types currently available or in development. As adoption grows in the areas with denser refueling networks, those networks will continue to expand to surrounding areas. In 2017 there were approx-imately 270, 250, and 170 million private passenger light-duty vehicles on the road in the U.S., the
E.U., and China, respectively. Approximately 99% of these vehicles are ICEVs powered by gasoline
or diesel liquid fuels. Although the counts of electric vehicle charging stations in Europe and China are approaching the number of petroleum stations, the total investment in existing infrastructure is dominated by petroleum-based fueling stations.
1.2. PROBLEM STATEMENT
Table 1-1: Counts of public fueling stations (2018 unless noted otherwise) Fuel Type U.S. Europe China
160,000 77,722 98,595 Gasoline (2016) (2016) (2015) Biodiesel 196 >2,000 N/A E85 3,321 >3,000 N/A Electricity 75,900* 15,675 17,700* (Level 2) (2017) Electricity 31,200* 2,624 2,100* (Level 3) (2017) Hydrogen 39 82 12 CNG 910 3,351 5,200 (2015) 2,460 LNG 66 107 2016) (2016)
*Note: Station count derived from the plug count and an assumed 2.5 plugs per station for Level 2
and 3.5 plugs per station for Level 3 stations (based on ratios derived from U.S. data)1 Sources: (Bourbon & Science, 2018; European Alternative Fuels Observatory [EAFO], 2018),
(U.S. Department of Energy [U.S. DOE], 2018c; U.S. Census Bureau, 2018)
However, in the coming decades, the share of investment in petroleum-based stations may decline as adoption of alternative fuel vehicles (AFV) increases. Biodiesel, compressed natural gas (CNG), a gasoline/ethanol blend (E85), electricity, hydrogen, and liquefied natural gas (LNG) are the fuels that have garnered investment from original equipment manufacturers and infrastructure companies. Table
1-1 compares across these fuel options within the US, European and China contexts.
1
In this table, Europe includes the EU, EFTA member countries, and Turkey. The number of stations servicing diesel fuel is a subset of the count of gasoline stations. China has a 2020 target of 10% ethanol in all gasoline nationwide. Data on the number of dedicated biodiesel and E85 stations in China was unavailable.
Chapter 2
Plug-in Electric Vehicle Adoption
2.1
Electric Vehicle Charging
Electric vehicle service equipment (EVSE) can be differentiated by ownership and power level. The elec-tric recharging infrastructure for plug-in elecelec-tric vehicles (PEVs) is currently available in the following four types:
1. Home recharging: Typically a wall plug or a dedicated Level 2 recharger installed at home;
in-tended to recharge EVs when parked for exin-tended periods. Currently, between 80% and 90% of electric vehicle charging in the U.S. occurs while the car is parked at home (U.S. Department of Energy [U.S. DOE], 2018a). With the charging infrastructure network still in its early stages, the availability of home charging provides current BEV owners with a reliable energy source that can cover 87% of Americans' daily travel needs (Needell, McNerney, Chang, & Trancik, 2016). This is a feature that is not shared by other alternative fuels and offers a clear advantage for the proliferation of electric vehicles.
2. Workplace recharging: A workplace recharger is generally Level 2 and installed at business center parking lots. They are intended to recharge PEVs while parked during the work hours. These stations are installed by employers and can typically only be used by their employees. In some cases, the use of these chargers may be free as an employee benefit to attract employees. This is a growing category of recharging with room for development.
3. Public Level 2 recharging: These public rechargers are often installed at shopping malls and
park-ing lots at power levels intended to recharge vehicles in four to eight hours. In order to defray the fixed costs of parking real estate and installation, PEV owners are likely to pay a higher fare per kWh than home or workplace recharging. For example, the average price of electricity in the U.S. is roughly $0.12/kWh, while the use of a ChargePoint public recharging station costs between
$0.19/kWh and $0.49/kWh.
4. Fast recharging: Fast recharging typically refers to a set of Level 3 public rechargers installed along highways and potentially at malls and other public destinations. While fast recharging provides convenience with shorter recharging times, they come with a higher fare per kWh than public Level 2 recharging. This difference in price is due to their high capital cost, the electricity
2.1. ELECTRIC VEHICLE CHARGING
demand charges associated with their relatively high power, and the extra convenience they offer over Level 2 chargers. For example, in Massachusetts, using a EVgo's CHAdeMO recharging station costs about $0.35/minute for a 50kW recharger which is equivalent to $0.42/kWh at peak charging power.
There are two more recharging methods emerging in the market that are aimed at increasing the convenience of PEV charging.
1. Battery swapping: A battery swapping station holds an inventory of batteries that are fully charged
and ready to swap. The station is outfitted with a complex robotic system to swap a customer's depleted BEV battery with a charged one and reduces BEV refueling time to a few minutes; com-parable to the time needed for traditional gasoline refueling. The number of batteries held in the inventory is dependent on demand, battery swap time and battery recharging time using a Level 2 charger inside the station. Battery swap technology was piloted by an Israeli company called "Better Place" until they went bankrupt in 2013. Chinese domestic electric vehicle manufacturers NIO and BJEV are in the early stages of building a network of battery swapping stations but the future of this technology outside of China remains unclear.
2. Wireless recharging: This technology can recharge a PEV through induction without the need to physically connect the car to the power source. Wireless charging is possible while the vehicle is stationary or being driven. The technology is at an early stage and stationary wireless charging is available in only a few 2019 car models such as the BMW 530e. In the more distant future, stationary wireless recharging may be an attractive option for autonomous electric vehicles to avoid the need for humans to plug in the vehicles. This technology is still in its infancy and does not yet have established power ratings.
2.1.1 Charger Specifications
The given power ratings and miles per hour of charging for these options, as described in Table 2-1, will vary based on ambient conditions, the battery state of charge, and the number of vehicles using a given charging station. As the battery approaches 80% charge, the charging speed tapers off significantly. Additionally, some vehicles are not equipped to handle high power charging and there are not yet any vehicle models that can handle the highest advertised charging power of 350 kW. Generally, PHEVs have been limited to lower charging powers below 7.2 kW.
There are also a number of different standards for charging infrastructure and a given vehicle model may need adapters or could be completely incompatible with some variants. For instance, over half of the available Level 3 chargers are Tesla Superchargers and are incompatible with non-Tesla BEVs
(U.S. DOE, 2019). Charging efficiency also varies across the types of EVSE with Level 1 chargers
generally exhibiting lower efficiency of approximately 70% for <2 kW due primarily to losses in the AC
Table 2-1: Typical charging infrastructure characteristics and definitions
Home or Home or .
Workplace Workplace
Level 1 2* 2* 3+
Voltage (U.S.) 120 240 240 480
Typical Max Current (A) 16, AC 80, AC 80, AC DC
Maximum Power (kW) 1.9 3.3-19.2 3.3-19.2 22-150+ Miles/Hour of Charging* 2-5 10-20 10-20 150+ Unit Cost (2015 $) 300-1,500 300-1,500 400-6,500 10,000-40000 Average Installation 0-3,000 4,000 3,000 21,000 Cost (2015 $)
*Most Level 2 chargers operate at 7.2 kW or below
**Assuming an average BEV driving efficiency of 3.15 miles/kWh Sources: (International Energy Agency [IEA], 2018a; U.S. DOE, 2018b)
to DC converter on the charger. DC fast chargers operate around 90% efficiency (Forward, Glitman, & Roberts, 2013; Francfort, 2013).
2.1.2 Trends in Global Infrastructure Build-out
The development of charging infrastructure has proceeded at different rates in countries around the world. A number of factors contribute to these differences, including the market share of EVs, gov-ernment incentives for construction of EVSE, the size of the country, and localized driving habits. The evolution of Level 2 and Level 3 chargers differ in their scope with approximately five times as many Level 2 as Level 3 chargers in a given country. Additionally, the density of the Level 2 and 3 recharg-ing networks are not necessarily correlated for a given country as can be seen in Figures 2-1 and 2-2. For example, South Korea has the fewest EVs per fast charger while they have the most EVs per Level 2 charger. In the U.S., studies suggest that charging demand can be met with a Level 2 EVSE den-sity in cities, towns, and rural areas of 36, 54, and 79 plugs per 1000 EVs respectively (Wood et al.,
2017).
These trends in Figure 2-1 and 2-2 illustrate that the expansion of infrastructure can take many forms based on region-specific geography, driving behavior, demographics, urbanization, and other factors that play into the vehicle-infrastructure coevolution. These factors are important to consider in the fol-lowing modeling analysis as the United States-centric results may not apply to all other contexts.
2.1.3 Infrastructure Driving PEV Adoption
China and Korea have double the number of Level 2 chargers per EV relative to the U.S., and also have a significantly higher penetration of BEVs relative to PHEVs (Table 2-2. While PHEVs can refuel
2.1. ELECTRIC VEHICLE CHARGING
Figure 2-1: Historical Trends in Global Public Level 2 Charger Density
25 020 15 10 C5 U., a-5 2012 2013 2014 2015 2016 2017 -China -Netherlands -Germany -Norway -Japan -United Kingdom - Republic of Korea -United States
on longer trips using gasoline, BEV owners rely on fast charging to undertake trips that exceed the nominal range of their vehicle. Therefore, with almost ten times the number of BEVs per PHEV in these countries, there will be demand for relatively higher concentrations of fast chargers. Additionally, in China, single-family homes are less prevalent than the U.S. or E.U. and therefore PEV owners are more reliant on public charging infrastructure, especially in the short term (Engel et al., 2018).
Table 2-2: Selected 2017 PEV sales by country
% Market % Market
Sales BEVs Sales PHEVs SharBe Sare EV to PHEV ratio
Share BEVs Share PHEVs
China 468,000 111,000 1.8 0.4 4.22 Germany 25,070 29,500 0.7 0.9 0.85 Japan 18,100 36,000 0.3 0.7 0.5 Republic of Korea 13,300 1,410 1.1 0.1 9.43 Netherlands 8,630 2,450 2.1 0.6 3.52 Norway 33,030 29,230 20.8 18.4 1.13 United Kingdom 13,550 33,700 0.5 1.2 0.4 United States 104,490 93,860 0.6 0.6 1.11
Source: (IEA, 2018a)
19
Figure 2-2: Historical Trends in Global Public Level 3 Charger Density 300 250 40 200 150 0) CL 100 50 0 2012 2013 2014 2015 2016 2017
-China -Germany -Japan -Republic of Korea - Norway -United Kingdom -United States
Note: Netherlands is not pictured with over 262 PEVs/charger by 2017
Source: (International Energy Agency [IEA], 2018a)
2.2
Barriers to U.S. PEV Adoption
2.2.1 Infrastructure Availability and Range Anxiety
Figure 2-3 shows the geographical build-out of electric charging stations in the U.S. as tracked by the Alternative Fuels Data Center Station Locator. Although there may be sufficient coverage on the coasts to accommodate most trips, vast areas in the Midwest are largely devoid of public EVSE. In these areas, BEV owners must rely completely on home charging or carefully plan their trips or risk running out of electricity. The fear of not having enough range for a trip is known as "range anxiety" . Additionally, as adoption continues to rise along the coasts, the density of stations will also need to increase to minimize vehicle queueing and maintain utilization rates that are profitable for infrastructure providers. For PEV (and BEVs in particular) adoption to increase more significantly, the recharging network will need to greatly expand and increase in density across the country.
2.2.2 EVSE Solvency
It may be difficult for EVSE owners to earn a profit given PEV owners' reliance on home charging so far, low profit margins for the sale of electricity, and the infrastructure installation and maintenance costs. However, stations that might have low utilization are still needed to provide visibility of charging availability and peace of mind for those considering purchasing a PEV (Morrissey et al., 2016). Adding
2.2. BARRIERS TO U.S. PEV ADOPTION
Figure 2-3:
Build-out of Level 2 and 3 Public Charging Stations in the U.S. (2018)* 00 0 E 0
q
I~~JDamp=.I.~ EVADAESource: (U.S. DOE, 2019)
stations in remote locations can relieve range anxiety and allow owners to use BEVs both for their daily driving and for longer trips.
In the U.S. a minimum of 3-4 and 5-6 daily charge events for Level 2 and Level 3 stations respectively are needed for those stations to be economically solvent (Madina, Zamora, & Zabala, 2016). Morrissey et al. (2016) found that the mean number of charging events at selected fast chargers in Ireland was more than four times the number at Level 2 chargers. Therefore, with longer charging times, Level 2
EVSE providers will need to target higher utilization rates to earn a profit. While PEV adoption remains
low in the early adopter market, these targets may be difficult for EVSE providers to achieve.
2.2.3 Vehicle Price and Government Incentives: PEVs
Often, the top cited barrier to AFV adoption is the high vehicle price relative to a comparable ICEV. The retail price for a standard battery electric vehicle (BEV) is approximately $10,000 more than for a traditional gasoline-powered vehicle of a similar size and style (Heywood et al., 2015). This price discrepancy is likely to shrink with advances in battery technology, along with increases in economies of scale for PEV production. Varying government subsidies and incentive programs for these vehicles exist around the world to help lower this barrier in the short term. In the U.S., federal tax rebates are available for up to $7,500 on qualifying BEVs in addition to various state incentives that offer a maximum of $5,000. Norway, Sweden, and other countries with significantly higher PEV sales (as much as 50% of the Norwegian new LDV market is comprised of PEVs) offer larger subsidies in addition to incentives such as high occupancy vehicle lane access and priority parking. However, these subsidies are beginning to phase out in the U.S. and will be under review in other countries in the next few years 21
as PEVs become more competitive with ICEVs. Additional, smaller subsidies and government programs exist for the construction and operation of EVSE.
2.2.4 Battery Prices
With batteries comprising approximately 50% of the price of a BEV, lower battery prices are required for BEVs to become competitive with ICEVs without government subsidies. While battery prices have fallen at an annual rate of 6-9% as research funding and economies of scale grow, projections for the future of electric vehicle batteries vary widely in both their potential technological capabilities and price (Nykvist & Nilsson, 2015). Bloomberg New Energy Finance estimates that price parity between these powertrains will come as early as 2025 (Soulopoulos, 2017). However, work done within the Mobility of the Future group at MIT indicates that many battery price projections may be overly optimistic by as much as 35% because they do not consider the base material costs required (Hsieh, 2018).
Additionally, every electric motor in modern PEVs needs a large permanent magnet constructed using rare earth metals such as neodymium and dysprosium. It is unclear whether the supply of these metals is adequate if there is a large spike in U.S. demand especially with 99% of the global dysprosium supply mined in China where BEV production is scaling up rapidly (Hoenderdaal, Tercero Espinoza, Marscheider-Weidemann, & Graus, 2013). However, research on recycling techniques for vehicle end of life could eventually reduce the mining requirements as older vehicles are turned in to be scrapped. Further research is focused on developing BEV motor technology that would drastically cut down on the need for these rare earth metals (Riba, L6pez-Torres, Romeral, & Garcia, 2016). While it appears that these supplies will satisfy the projected growth in demand, disruptions in the global political economy could lead to an imbalance between supply and demand and sudden increases in battery prices.
2.2.5 Extreme Fast Charging
The relatively low range and long recharging times for BEVs make them an unattractive option for longer trips. Infrastructure providers are attempting to build a network that is reliable for drivers. Ionity in Europe and Electrify America in the U.S. are planning to construct 350 kW extreme fast charging (XFC) networks to enable recharging times that can compete with the fueling speed ICEV owners are accustomed to (Ionity GmbH, 2018). Assuming an extended range BEV with a 60 kWh battery can achieve 3.5 miles per kWh of charge, XFC could add approximately 20 miles of range per minute of charging. However, current lithium-ion battery technology cannot yet recharge at these high XFC power rates (see Figure 2-4) and substantial research in more effective battery cooling will be needed. The first vehicle capable of charging at XFC power levels is the Porsche Mission E, a luxury sports car planned for release in 2019. While Porsche has not released official information on their pricing, it is
2.2. BARRIERS TO U.S. PEV ADOPTION
likely that the batteries of vehicles capable of using these chargers will be up to 90% more expensive than traditional BEV batteries. High power charging may also lead to significantly faster battery degradation, which can hinder the vehicle range and could shorten its useful life, requiring replacement at significant cost (Ahmed et al., 2017). With high peak power demands, XFC will also need to be priced significantly higher for consumers than lower charging levels. While there is significant investment and focus on these efforts in the media, this technology is still in its early phases and it is so far unclear how it will develop and impact the PEV market.
Figure 2-4: 140 3 120 0 0-100 80 X 60 iA 40 20 0
Maximum charging power, battery size, and charging speed (ideal conditions) comparison across BEV models
25
BMW 13 Nissan Leaf Chevy Bolt Tesla Model S Tesla Model X Porsche Mission E (350 kW charging)
Battery Size (kWh) Maximum Power (kW) - mi/min
20 15E is cu 0-10 on 5C 5 U 0
Source: (U.S. DOE, 2019)
2.2.6
Home Charging Availability
Home charging is not universally available to all consumers; and in some cases, installation is expensive. For fully electric vehicles, a trickle charge through a standard wall outlet may provide as few as 40 miles
of range over 8 hours (US DOE Vehicle Technologies Office 2018a). A dedicated high voltage (240V)
circuit will need to be installed to enable the use of Level 2 home charging which can fully charge a
long range BEV overnight. However, the physical layout of a home's circuitry relative to the parking
space might require substantial labor. The degree of these required upgrades drives the range given
for the home charger installation costs shown in Table 2-1. Alternatively, the vehicle may not have a
dedicated parking space, making the availability of home charging unreliable. This is a common issue
for residents of multi-unit dwellings and in areas where street parking is common. For these homes,
BEV owners may rely on workplace recharging for their daily charging needs.
Chapter 3
U.S. Hydrogen Vehicle Adoption
The primary advantage that hydrogen vehicles offer over pure BEVs is their 5 minute refueling time and 300+ mile range. These numbers are comparable to current gasoline vehicles and the overall fu-eling experience for FCEVs is similar to ICEVs. Therefore, FCEV owners won't have to make significant changes to their established habits, as they do with BEVs (W. James, 2016). These advantages help al-leviate the range anxiety associated with BEV use due to their lower range and refueling time. However, hydrogen vehicles do not have the option to refuel at home and must rely on a fueling infrastructure network that is still in its infancy.
3.1 Hydrogen Fuel Production
Currently, natural gas-fueled methane reformation is the primary production source of hydrogen in the
US because it is the least expensive, most efficient method (IEA, 2015). However, to achieve significant
reductions in greenhouse gas emissions in transportation, other methods with lower carbon intensity will be needed. One of the more promising options is to formulate hydrogen using Water electrolysis powered by electricity derived from renewable sources. Thus far, this process remains expensive relative to conventional fuels and relative to electricity as a transportation energy carrier. The Department of Energy (DOE) is currently funding a $39 million program that includes research into low emission production pathways and distribution for hydrogen in order to lower FCEV operational costs. Achieving the DOE goals including a $2/kg production target would make hydrogen fuel costs competitive with gasoline on a cost per mile basis (Fuel Cell Technologies Office, 2018).
3.2 Broader Hydrogen Applications
Although hydrogen production is currently an expensive process relative to the price of other LDV fuels, it is not a new endeavor. In 2017, the global hydrogen generation market was valued at over $115 billion (de Valladares, 2017). Industrial uses currently constitute the majority of hydrogen demand with applications including ammonia production, fuel refining, and steel production (IEA, 2015). Hydrogen may also be increasingly used for heating and energy storage, as part of efforts to decarbonize the overall economy.
3.3. BARRIERS TO FCEV ADOPTION
Additionally, buses and other localized vehicle fleets may be good candidates for a transition to hydro-gen in order to maximize the utilization of a limited number of local hydrohydro-gen refueling stations. If these additional sources of demand develop, they might support the hydrogen production and distri-bution networks for LDVs, making it easier for FCEV adoption to scale (de Valladares, 2017).
3.3
Barriers to FCEV Adoption
3.3.1 Hydrogen Station Build-out
Hydrogen fueling is still in its very early stages with just 302 stations globally as of October 2018 (Pacific Northwest National Laboratory, 2018). For the most part, stations have standardized around the world and either dispense fuel at 350 or 700 bar for heavy-duty or light-duty vehicles, respectively. The US and Japan are by far the largest FCEV markets with 4,500 vehicles in the US and 2,400 in Japan out of a global fleet of approximately 8,000 (California Fuel Cell Partnership, 2019). Despite minimal expansion thus far worldwide, nations around the world have plans to invest significantly in hydrogen fueling infrastructure, with approximately 1,500 stations planned by 2025 between the US, Japan, France, China, Germany, and Korea (IEA, 2018b).
Individual stations can cost as much as $2.8 million to build, depending on the hydrogen storage capac-ity, so expanding network coverage requires a large investment (Melaina & Penev, 2013). Due to their high capital cost and the likely continuation of low utilization rates in the near-term, it may be 10-15 years before hydrogen infrastructure providers see a positive return on their investment. Therefore, government partnerships and public support for this infrastructure will likely be required for vehicle adoption and station build-out to grow (IEA, 2015). The majority of the 39 existing stations in Cali-fornia (see Figure 3-11) are the result of a government program with planned funding of up to $170 million for the first 100 stations by 2024 (McKinney, Bond, Crowell, & Odufuwa, 2015).
3.3.2 Hydrogen Fuel Prices
The price of hydrogen fuel in the U.S. is currently estimated at approximately $15.50/kg (Bourbon & Science, 2018). Although FCEVs are about twice as efficient as ICEVs, this is still significantly more expensive per mile of travel which slows early adoption (see Figures 5-1 and 5-2 for operating costs over time). FCEV automakers are therefore currently offering to pay for the first three years of hydrogen fuel costs for their customers to encourage early adoption. As hydrogen production methods improve and production volumes increase, the U.S. DOE expects to achieve production prices of under $2/kg
'The rest of the U.S. is omitted from this map because there is no hydrogen infrastructure elsewhere with the exception of one station in Hawaii.
Figure 3-1: Build-out of Hydrogen Fueling Stations in the U.S (2018) sPu Fresno Frn n CALIFORNIA Bakersfield Lancaster Sant arbara L. sAt -%des San oego
Source: (U.S. DOE, 2019)
and there are a number of research projects that are approaching this target. Achieving their goals in these areas will make hydrogen fuel costs competitive with gasoline on a cost per mile basis (Fuel Cell Technologies Office, 2018). High capital and distribution costs for pressurized hydrogen fuel means retail prices will likely only decrease to $8-10 per kilogram by 2025, and perhaps to $6/kg in the long-term (Ogden, 2018). One of the areas that could lower the retail price at the pump is to reduce the costs of transporting and storing hydrogen fuel. Most production occurs at large, centralized facilities. However, if low-volume distributed electrolysis hydrogen formulation can be achieved on-site, then the pump price can be tied more directly to the production price because transportation costs will be minimized.
3.3.3 Vehicle Price and Government Incentives: FCEVs
Although there are currently federal and state government vehicle purchase incentives for FCEVs in California totaling $10,000 per vehicle, vehicle price remains a barrier to adoption. Hydrogen storage and fuel cell technology is expensive, costing approximately $6,200 and $16,200 respectively per ve-hicle as compared to an estimated $17,600 for the rest of the veve-hicle parts and assembly (B. D. James, Huya-Kouadio, Houchins, & DeSantis, 2017). These costs are due in part to limited economies of scale
3.3. BARRIERS TO FCEV ADOPTION
with just 3,000 systems produced annually This estimated $22,000 hydrogen system price results in
2018 vehicle prices of over $58,000, $51,000, and $59,000 for the Toyota Mirai, Hyundai Tuscon,
and Honda Clarity FCEV respectively. For comparison, the Honda Clarity PHEV retails for $33,400. Although economies of scale could significantly reduce FCEV production costs as demand increases, it is unlikely that the costs of the composite materials used for hydrogen storage can decline as quickly; perhaps decreasing by 20% or $4,400 by 2025 (W. James, 2016; Hua et al., 2011). These projections indicate that vehicle price will continue to be a barrier to FCEV adoption.
3.3.4 Available Vehicle Models
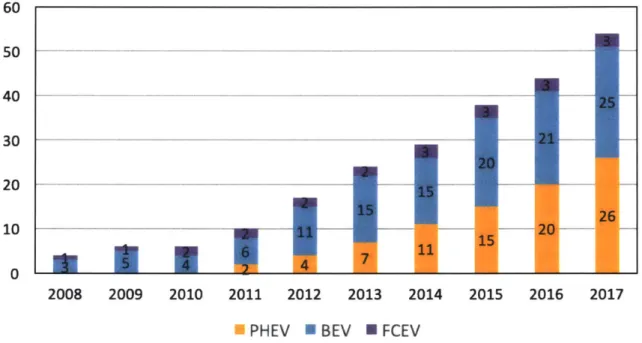
Figure 3-2: Historical Model Offerings for BEVs, PHEVs, and FCEVs in the U.S.
60 50 40 30 20 10 0 21 15 20
4.
V
2008 2009 2010 2011 2012 2013 2014 2015 2016 2017*PHEV *BEV
MFCEV
Source: (Bloomberg New Energy Finance [BNEF], 2018)
By the end of 2017, there were 25 BEV models, 26 PHEV models, and 3 FCEV models on the U.S.
mar-ket (see Figure 3-2). For comparison, there are over 230 total vehicle models offered on the U.S. LDV market. Additionally, FCEVs are only available for purchase in California and PEVs are often not pro-moted at dealerships so availability may be limited in many areas (Lunetta & Coplon-Newfield, 2016). The narrow range of choices in AFV models is another significant barrier to adoption but statements from a number of large automakers promise to significantly increase the number of AFV models offered with perhaps as many as 75 BEV models for sale in the U.S. by 2023 (Singer, 2017; Naughton, 2017). OEMs have made fewer commitments regarding future FCEV model offerings and this lack of diversity may continue to hamper adoption.
Chapter 4
U.S. AFV Sales Projections Modeling
This chapter describes the system dynamics model used to conduct a sensitivity analysis on a number of parameters related to the build-out of refueling infrastructure and adoption of PEVs and FCEVs in the United States. The assumptions that underlie this work were determined primarily based on the most recent data in the literature and on the expert opinion from members of the Mobility of the Future' research team at MIT.
4.1
System Dynamics Model Overview
The model used for this analysis is an expansion of the consumer vehicle choice Bass-type diffusion system dynamics (SD) model developed by Professor David Keith at the MIT Sloan School of Manage-ment (Keith 2012). The model simulates the light-duty vehicle (LDV) market in the U.S. with choices between vehicle technologies driven by two primary factors as illustrated in Figure 4-1: utility and fa-miliarity. These factors are described in greater detail in Sections 4.1.1 and 4.1.2. Vehicle purchasing decisions are derived from feedback loops (Figure 4-2) of interconnected differential equations that update dynamically throughout each simulation until the year 2050. The vehicle choices are solely between powertrains. All of the vehicles are assumed to be midsize cars to eliminate other dimensions that go into consumer purchasing decisions such as size and style. Additional details on the model formulation can be found in Appendix A.
Figure 4-1: Modeling Consumer Vehicle Choice- Sensitive Parameters
Markeing Refueling
Word of Mouth
~
aiirt
~ulsiof
Totl Cost ofFamilia
'
Utility
OwnershipSelecib
Vi sbi t on Driving Range
4.1. SYSTEM DYNAMICS MODEL OVERVIEW
Figure 4-2: A simplified diagram illustrating some of the important reinforcing ("R") feedback loops powering the SD model.
AFVs on the
Road
AFV Purchases 11 InfrastrueareE
Miles Driven-..&
Fuel
per AFV
Fuel
Availability
4
Demand
Rang. A WxIIty
AFV Fueling
Infrastructure
Awareness, Social Public Exposure
Acceptance of AFVs
to
AFVs
Table 4-1: Weightings for each of the factors contributing to the "utility" of each powertrain over time. Attribute Weight Units
Purchase Price -0.361 $/vehicle Vehicle Operating Cost -0.17 $/vehicle*year
Acceleration -0.149 seconds (0-30 mph) Top Speed 0.641 miles/hour
Range 0.1 miles
Emissions -0.149 grams/mile Fuel Search Cost -0.03 cents/mile
Scope 0.5 none
4.1.1 Vehicle Utility
One of the two primary factors that determines consumer purchase decisions in the SD model, utility is a dimensionless measure of the relative attractiveness of a given powertrain in comparison to the alternatives. Its value is derived from the linear combination of a number of specific vehicle attributes that are each weighted according to their relative importance to the vehicle's overall usefulness. The values output by the model are negative based on the summing of the various components but higher
(less negative) values of utility mean that a powertrain is relatively more attractive.
These attributes and their relative weightings, based primarily on stated and revealed preference survey
data, are displayed in Table 4-1 (Brownstone, Bunch, & Train, 2000). Scope is a measure of the number of different vehicle models of a given powertrain available for consumers to purchase. Fuel Search Cost is the time cost incurred to a vehicle owner based on how long it takes to physically reach a compatible station and refuel their vehicle. This parameter was not part of the original paper by Brownstone, et al., but it was added to the model and parameterized based on historical sales data to characterize the feedback loop between infrastructure and vehicle adoption.
Table 4-2: General model assumptions characterizing the US consumer LDV market Model Assumptions Value Units
Vehicle Lifetime 15 years
Value of Time 40 $/hour
Annual VMT 12,000 miles/year LDV Fleet Growth Rate 0.70%
-Vehicle Purchase Incentive Sunset Date 2030 year Median Household Income (2018) 57,000 $/year
EV Home Charger Base Cost 1,000 $
% Energy charged at home- BEV 85%
-Price Multiplier for Public Level 2 Charging 2
Percent of Households with Home Charging 70%
-4.1.2 Powertrain Familiarity
The second major factor in purchasing decisions is the consumer familiarity with a given powertrain, based on the influences of marketing, previous experience, and word-of-mouth. A consumer who has owned a PHEV in the past is likely more familiar with a BEV than someone who previously owned an ICEV. That consumer is therefore more likely to purchase a BEV for their next vehicle. Consumer fa-miliarity with a given powertrain is also increased by seeing that vehicle type on the road. Powertrains that comprise a lower percentage of the in-use fleet must therefore rely on more direct marketing chan-nels to achieve the same level of familiarity as more common vehicle powertrains. The weighting and magnitude of these factors were parameterized based on historical sales data and the best judgement of the Mobility of the Future infrastructure research team at MIT.
4.1.3 Key Model Parameters
The System Dynamics (SD) model uses a number of exogenous parameters to define the context within which consumers make their vehicle purchase decisions. Table 4-2 shows some of these assumptions that define the impact of developments in vehicle technology, the evolution of fueling infrastructure,
4.1. SYSTEM DYNAMICS MODEL OVERVIEW
Table 4-3: Basic powertrain characteristics
Parameter ICEV HEV PHEV BEV FCEV Units
Purchase Incentive 0 0 4,000 7,500 7,500 $/vehicle Vehicle MSRP (2018) 20,000 22,500 26,500 37,000 58,000 2018 $
Maximum Range (2018), 45 Electric, 225 Electric 360 miles/refuel Ideal Conditions 460 gas
New Vehicle 124 electric, 124 75 miles/GGE Fuel Economy (2018) 55 gas
Fuel Lifecycle
FuHG Eissions (421 301 245 164 252 gCO2e/mile driven GHG Emissions
(2015)-Note: Based on an electricity emission intensity of 453 gCO2e/kWh
Source: (Argonne National Laboratory [ANL], 2017)
and the willingness to purchase different powertrains. These values are based on the most recent (2018)
U.S. vehicle market and demographic statistics.
4.1.4 Powertrain Parameters
In the SD model, car owners decide which powertrain to purchase when replacing their vehicle based on the relative attractiveness of the powertrains at that time. In this powertrain selection modeling system, car owners cannot choose to become car-free in response to developments in public transportation, ride-hailing services, and other alternative modes of transportation. The potential introduction and expansion of autonomous vehicles is also not addressed in this model. The range and new vehicle fuel economy parameters (Table 4-3) are based on nominally reported values for comparable midsize cars in the US market. As the simulation progresses toward 2050, these attributes improve to reflect technological advancement. The purchase incentives ramp down over ten years from the given values from 2020 to 2030.
4.1.5 Infrastructure Parameters
The assumed characteristics of the fueling infrastructure in the SD model are given in Table 4-4 and approximately represents the U.S. These attributes then evolve over time as the technology develops, market shares of the powertrains change, and demand for the relevant infrastructure fluctuates based on these changes in the market. The fueling parameters in Table 4-4 greatly influence vehicle purchasing decisions based on their relative convenience and cost.
Table 4-4: Basic fueling infrastructure characteristics
Parameter Gas Public Level 2 H2
Station Charging Stations Station Available
Satins (160,000 16,000 50 Number of Stations Stations (2018)
Infrastructure 20 20 20 Years
Lifetime
Pumps/Station 8 3 2 Pumps/Station
Fueling Time/Rate 5 minutes 25 kW 6 minutes
(2018) __inte_2_k_6miuts_
Fuel Price (2018) 2.87 $/gallon 21 cents/kWh 15.5 $/kg
4.2 Model Expansions
Before running the analysis presented here, I updated the most easily estimated parameters based on real-world data. These updates took into account developments in AFV technology and in the LDV market more generally since the model was last updated in 2015. I then iteratively optimized the remaining, more uncertain parameters to ensure the model would accurately predict recent powertrain market share data in the U.S. The most influential parameters involved in this optimization include the respective utility weightings of the fuel search cost and vehicle range as well as the marketing spending per powertrain.
I also made a number of structural model expansions designed to increase the model's ability to more
specifically characterize the interaction between infrastructure and vehicle adoption. The most signifi-cant of these expansions is described in Section 4.2.1.
4.2.1 Home Charger Installation Cost
The model assumes that 70% of BEV owners are able to purchase and install a home charger to charge their vehicle nightly. This assumption is the difference between the estimated 60% of owned homes and 80% of owned and rented homes combined that have dedicated parking spaces (Traut, Cherng, Hendrickson, & Michalek, 2013). However, only 38% of homes can easily install chargers; others will need to make significant investment above the assumed $1000 base cost of the home charger for installation. I therefore constructed a cost curve, beginning at $1000 and increasing when BEV adoption passes 38% of market share. This construction is implicitly assuming that those who can most easily install a home charger will be among the first to purchase a BEV and households with higher installation costs would not be early adopters.
4.3. MODEL LIMITATIONS
4.3 Model Limitations
There are a few limitations of the SD model that are worth noting. First, the model assumes that recharging and refueling stations are distributed evenly across the modeled area (the area of the con-tinental U.S. for most of these results). This disaggregation results in a conservative estimate of the attractiveness of new powertrains because the fueling infrastructure is widely dispersed whereas in reality the planned fueling network can be more effective with careful placement near population cen-ters and along highly trafficked corridors. Second, the charging power is represented as a country-wide average rather than differentiated by level. Some analysis on the impact of different charging levels and the business models associated with the build-out of these public chargers can be found in Rakesh Sridhar's 2019 MIT master's thesis. Finally, the model does not differentiate between cars and light trucks in its simulated LDV market. This distinction may be especially important for the U.S. as the market continues to trend towards larger personal vehicles.