HAL Id: dumas-02884957
https://dumas.ccsd.cnrs.fr/dumas-02884957
Submitted on 30 Jun 2020
HAL is a multi-disciplinary open access
archive for the deposit and dissemination of sci-entific research documents, whether they are pub-lished or not. The documents may come from teaching and research institutions in France or abroad, or from public or private research centers.
L’archive ouverte pluridisciplinaire HAL, est destinée au dépôt et à la diffusion de documents scientifiques de niveau recherche, publiés ou non, émanant des établissements d’enseignement et de recherche français ou étrangers, des laboratoires publics ou privés.
Are tilted writing and drawing after stroke related to a
biased perception of the vertical?
Flora Diaine
To cite this version:
Flora Diaine. Are tilted writing and drawing after stroke related to a biased perception of the vertical?. Human health and pathology. 2019. �dumas-02884957�
AVERTISSEMENT
Ce document est le fruit d'un long travail approuvé par le
jury de soutenance et mis à disposition de l'ensemble de la
communauté universitaire élargie.
Il n’a pas été réévalué depuis la date de soutenance.
Il est soumis à la propriété intellectuelle de l'auteur. Ceci
implique une obligation de citation et de référencement
lors de l’utilisation de ce document.
D’autre part, toute contrefaçon, plagiat, reproduction illicite
encourt une poursuite pénale.
Contact au SID de Grenoble :
bump-theses@univ-grenoble-alpes.fr
LIENS
LIENS
Code de la Propriété Intellectuelle. articles L 122. 4
Code de la Propriété Intellectuelle. articles L 335.2- L 335.10
http://www.cfcopies.com/juridique/droit-auteur
1 UNIVERSITÉ GRENOBLE ALPES
UFR DE MÉDECINE DE GRENOBLE
Année 2019
L’INCLINAISON DE L’ECRITURE ET DU DESSIN APRES UN AVC EST-ELLE UNE MANIFESTATION D’UN BIAIS DE PERCEPTION DE LA VERTICALE ?
ARE TILTED WRITING AND DRAWING AFTER STROKE RELATED TO A BIASED PERCEPTION OF THE VERTICAL?
THÈSE
PRÉSENTÉE POUR L’OBTENTION DU TITRE DE DOCTEUR EN MÉDECINE DIPLÔME D’ÉTAT
Flora DIAINE
THÈSE SOUTENUE PUBLIQUEMENT À LA FACULTÉ DE MÉDECINE DE GRENOBLE
Le 09/09/2019
DEVANT LE JURY COMPOSÉ DE
Président du jury :
Mr. PÉRENNOU Dominic
Membres :
Mr le Professeur PÉRENNOU Dominic (directeur de thèse)
Mme le Professeur BACIU Monica
Mme le Professeur MORO Elena
Mr le Professeur DETANTE Olivier
Mme le Docteur PISCICELLI Céline
L’UFR de Médecine de Grenoble n’entend donner aucune approbation ni improbation aux opinions émises dans les thèses ; ces opinions sont considérées comme propres à leurs auteurs.
6
Sommaire
Sommaire ... 6
Remerciements ... 7
RÉSUMÉ ... 8
Titre : L’inclinaison de l’écriture et du dessin après un AVC est-elle une manifestation d’un biais de perception de la verticale ? ... 8
ABSTRACT ... 9
Title: Are tilted writing and drawing after stroke related to a biased perception of the vertical? ... 9
Introduction ... 10
Material and method ... 11
Participants ... 11
Ethical considerations ... 11
Tasks and criteria ... 12
Statistics ... 14
Results ... 15
Participants ... 15
Validity of the measures ... 15
Determining criteria from the feasibility in patients ... 15
Reliability of selected criteria in patients ... 16
Ranges of normality for the selected criteria ... 16
Writing and drawing orientations in patients ... 16
Discussion ... 19
Criteria and methodology for measuring tilted WD after a stroke... 19
Why did healthy subjects have tilted writing and drawing ... 20
Importance of writing and drawing tilt after a RHS ... 20
Determinant of the tilted WD after a RHS ... 20
Perspectives and clinical implications ... 21
Study limitations ... 21
Conclusion ... 22
References ... 25
Tables and figures ... 29
Figure 1: Study flow chart ... 29
Figure 2: Schematic view of the way to compute criteria of the writing orientation ... 30
Figure 3: Schematic view of the way to compute criteria of the drawing orientation ... 31
Figure 4: Measuring Visual Vertical : luminous rod ... 32
Figure 5: Measuring postural vertical with the wheel paradigm ... 33
Table 1: Comparison between patients and healthy subjects for writing and drawing measurements... 34
Table 2: Comparison between patients with tilted WD and patients with upright WD... 35
Additional material ... 36
STROBE Statement—Checklist of items that should be included in reports of cohort studies 36 Operating mode for Angle Calculator ... 38
Selection of items from Catherine Bergego Scale : ... 39
7
Remerciements
Au Professeur Pérennou pour son encadrement actif et sa disponibilité pour ce travail.
À Louis, un grand merci pour ton aide précieuse et efficace à un moment où j’en avais absolument besoin.
À Céline, pour ton aide au début de ce travail. Tes explications théoriques ont été précieuses. Je te remercie pour ta gentillesse.
Anaïs, merci d’avoir été aussi impliquée dans ce travail à deux. Je pense que nous avons eu de la chance que cette collaboration se passe aussi bien alors que nous ne nous connaissions pas. Je te souhaite bonne chance pour ta thèse !
À tous les médecins qui m’ont encadrée pendant ces années d’internat et à ceux qui vont continuer à le faire pendant mon assistanat.
Un immense merci à mes parents. Je mesure la chance que j’ai d’avoir des parents si dévoués. Vous avez toujours été là pour moi.
Annabelle, Yohan, merci pour votre présence et votre soutien pendant toutes ces années.
À mes amis Grenoblois, Aixois, expatriés, médecins et non médecins, merci, sans vous je n’aurais jamais tenu pendant toutes ces années. Votre amitié est un pilier fondamental pour moi.
Rémi, merci pour ton soutien pendant l’internat et la fin de ma thèse. Je suis très heureuse d’être ta future co-assistante.
Enfin, Olivier, tu sais à quel point ton soutien, ta bienveillance et ton amour au quotidien sont fondamentaux. Merci d’être comme tu es et d’être auprès de moi. Et bien sûr merci pour Angle Calculator !
8
RÉSUMÉ
Titre : L’inclinaison de l’écriture et du dessin après un AVC est-elle une manifestation d’un biais de perception de la verticale ?
La dysgraphie spatiale, survenant parfois après un accident vasculaire hémisphérique droit (AVCD), est partiellement expliquée par l’héminégligence. Nous avons étudié la responsabilité d’un biais de représentation de la verticale dans l’inclinaison antihoraire de l’écriture et du dessin, et cherché à proposer des critères valides pour diagnostiquer une inclinaison de l’écriture et du dessin après AVCD.
Cette étude observationnelle portait sur 61 patients droitiers testés 30 jours après un AVCD et 44 sujets sains appariés en âge et sexe. Tous devaient écrire et dessiner un matériel standardisé. Nous mesurions l’inclinaison de la marge et des lignes sur un test d’écriture, ainsi que l’inclinaison des arbres et des lignes de base sur une copie de dessin. L’héminégligence et les verticales posturale (VP) et visuelle (VV) étaient évaluées chez les patients. Les statistiques étaient non paramétriques et les normes définies par le 95ème percentile des données des sujets sains. Un signe négatif indiquait une inclinaison antihoraire.
Les normes pour diagnostiquer une inclinaison du matériel étaient de -6,9° pour la marge, -4,9° pour les lignes et -5,5° pour les arbres. Les sujets sains écrivaient et dessinaient avec une inclinaison antihoraire. Vingt-trois patients (38%) avaient au moins 1 critère anormal. Comparés aux autres ils étaient plus sévèrement atteints concernant la latéropulsion (p=0,001), le biais de VP (p=0,018) et VV (p=0,001), la négligence extrapersonnelle et l’hémianopsie.
Cette étude donne des critères valides pour diagnostiquer une inclinaison antihoraire de l’écriture et du dessin, que présentaient 38% des patients. Ces derniers avaient un plus grand biais de perception de la verticale. Les sujets sains écrivaient et dessinaient de façon inclinée.
MOTS CLÉS : AVC, hémisphère droit, cognition spatiale, représentation de la verticale, dysgraphie spatiale, écriture inclinée.
9
ABSTRACT
Title: Are tilted writing and drawing after stroke related to a biased perception of the vertical?
Spatial dysgraphia showed after a right hemispheric stroke (RHS) is partially explained by spatial neglect. This study aimed to test the hypothesis that the counterclockwise tilt of the handwriting and drawing is due to a counterclockwise tilt in representing the vertical, transposed to the sheet of paper. It also aimed to propose valid and reliable criteria with cutoff values to routinely diagnose a counterclockwise tilt of the writing or the drawing in victims of RHS.
This is an observational study on 61 right-handed patients tested 30 days after a RHS and 44 aged and sex matched healthy subjects. All were asked to write and draw by hand standardized material. We measured the inclination of the margin and lines of a writing test, the inclination of the trees and base lines of a drawing copy test. Spatial neglect, postural vertical (PV) and visual vertical (VV) were assessed in patients. Statistics were non-parametric and normality was defined as the 95th percentile of normal data. Negative signs indicated counterclockwise tilts.
The cutoff to diagnose a tilted material was -6.9° for the left margin, -4.9° for the lines written and -5.5° for the trees. Healthy subjects had a significant counterclockwise writing and drawing tilt. At least one criterion presented a counterclockwise tilt in 23 patients (38%). Compared to others, these patients showed greater lateropulsion (p=0.001), bias in PV (p=0.018) and VV (p=0.001), non body neglect and more hemianopia.
This study gives valid and reliable criteria to diagnose a counterclockwise tilt of the writing or drawing, found in 38% of the patients. These latter showed a greater bias in perception of verticality. Healthy subjects wrote and drew with a counterclockwise tilt.
KEY WORDS: Right hemispheric stroke, spatial cognition, verticality representation, spatial dysgraphia, tilted writing.
10
Introduction
Handwriting and drawing require motor, sensitive and cognitive skills, involving both hemispheres. In right handers the left hemisphere controls the motor component [1,2] whereas the right hemisphere controls the spatial organization [3].
Spatial dysgraphia observed after right hemispheric stroke (RHS) corresponds to a spectrum of signs bearing on the spatial layout of the written language [4]: writing exclusively in the right half of the paper, overwriting or compressing some words, omitting, repeating or substituting letters or graphemes, but also slopping writing lines and a progressive increase of the left margin. Most of these signs are secondary to spatial neglect (NSU), found in about 50% of victims of a RHS [5,6].
Recently Jolly et al [7] have reported a case suggesting that the counterclockwise tilt of the handwriting and drawing is due to a counterclockwise tilt in representing the vertical, transposed to the sheet of paper referring to top and bottom. This paper appeals confirmation in a series of consecutive individuals tested at a subacute stage after a RHS. This was the main objective of the present study.
Our second objective was to implement a feasible methodology to assess writing and drawing orientation, and propose valid and reliable criteria with cutoff values to routinely diagnose a counterclockwise tilt of the writing or the drawing in individuals undergoing rehabilitation after a RHS.
11
Material and method
Participants
Data of 105 individuals were analyzed for this study: 61 with a hemispheric stroke compared to 44 healthy participants.
Individuals with a stroke were part of the DOBRAS-R cohort (ClinicalTrial.gov NCT03203109), which followed 228 individuals aged from 18 to 80, victims of a first unilateral hemispheric stroke documented by an MRI and admitted in our neurorehabilitation department from January 2012 to November 2018. Motor, sensitive, functional and cognitive data were systematically collected by trained professionals at 30 ± 2 days 30), 60± 2 days (D-60), and 90 ± 2 days (D-90) post-stroke. Because spatial dysgraphia is much more frequent after right hemisphere lesions [4,8,9], we selected observations of individuals with a RHS. The left hemisphere being dominant for language in most individuals, they had intact language skills. We also selected observations of right-handers (Edinburgh ≥ 0.6), to test writing and drawing abilities of individuals using their strong right upper limb. For each observation we selected data of the first assessment completed as regards of relevant variables for this study: writing and drawing, spatial neglect, and verticality perception, among systematic assessments performed at D-30, D-60, or D-90 post-stroke (Flow chart in Figure 1).
Healthy subjects were recruited in our immediate environment and hospital employees in order to establish norms for writing and drawing data. They had no history of neurological disorders and were right handed. They were matched for sex and age and blind from the study hypothesis.
Ethical considerations
The Study was performed in accordance with the Helsinki Declaration. It was registered at the National Committee for Informatics and Freedom (Commission Nationale Informatique et Liberté; No. 2014874 v1), and in a WHO study register (NCT03203109 ClinicalTrial.gov; Determinants of Balance Recovery After Stroke [DOBRAS]). All participants provided written informed consent. According to French law, this observational study did not require approval by an ethics committee for patients. For healthy controls the study was approved by the Ethical Review Board of Grenoble-Alpes University (CERGA-2019-04-09-1). The reporting of this paper follows STROBE statement (additional material).
12
Tasks and criteria
The writing orientation was analyzed from the writing test of the Batterie d’évaluation de la négligence (BEN) [10]. Individuals had to manually write on three lines their name and surname, address, and profession (Figure 2). We used a blank sheet of paper (portrait), put flat on a table, centered on the trunk of participants, with the inferior border parallel to the table’s edge. No instruction was given on writing orientation and speed. Each production was carefully scanned, with apparent right edge, giving a vertical reference for analysis. Four measures were done by one operator (FD) blinded regarding tests of verticality perception and spatial neglect: the left margin tilt with respect to vertical (Figure 2a); the tilt of the three first lines with respect to horizontal (Figure 2b). We planned a priori to average the inclination of the three lines and to check the validity of this approach by comparing the inclination of these lines both in individuals with a stroke and in controls. These latter measures were performed with a software specially designed (Angle Calculator [11], details given in additional material). By convention [12,13], a negative sign indicated a counterclockwise tilt.
To estimate the reliability of these measurements we correlated measures obtained by Angle Calculator to those obtained with a protractor, on 15 patterns of writing tilted from 0 to 50° (15 margins and 45 lines). This was performed by an operator (FD) who always started with the protactor, then applied Angle Calculator. We then analyzed the inter-rater reliability of the measures performed with Angle Calculator. Thirty writing materials obtained in individuals with a RHS were analyzed by two independent operators (FD and AV or FD and LD).
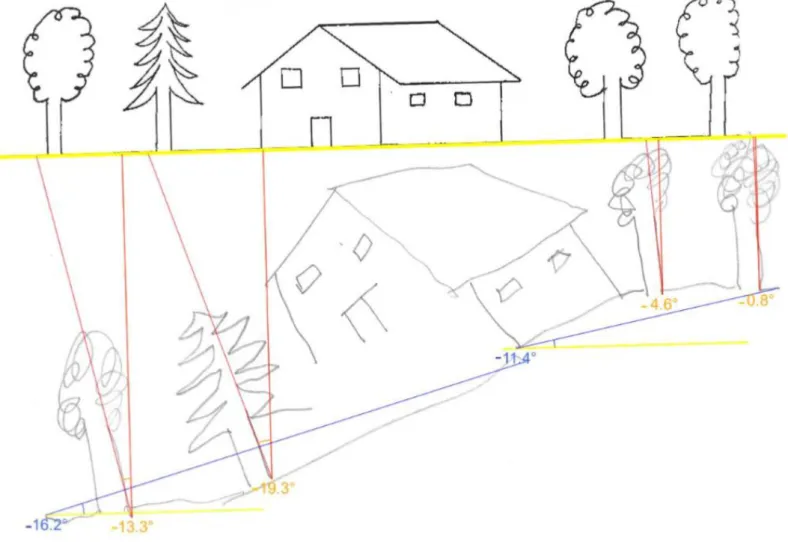
The drawing orientation was analyzed from Gainotti’s drawing test [14]. The figure was displayed on a landscape format paper, put flat on a table and parallel to its edge, and centered on the body axis. Participants were instructed to copy the figure on the underlying blank space. Each production was scanned to allow measurements made by one operator (FD) who used Angle Calculator. Two types of criteria were measured: the tilt with respect to the vertical of each of the four trees, and the tilt with respect to the horizontal of each of the two baselines of the drawing (Figure 3). Methodological details are given in additional material. We planned a priori to average the inclination of the three right-most trees and to leave apart the left-most tree (supposed to be omitted in case of spatial neglect) and to check the validity of this approach by comparing the inclination of these trees both in individuals with a stroke and in controls. We also planned to average the inclination of the two lines after comparing their inclination. FD was blinded regarding tests of verticality perception and spatial neglect.
13
We then analyzed the inter-rater reliability of measurements with Angle Calculator in individuals with a RHS. Thirty drawing materials were analyzed by two independent operators (FD and AV or FD and LD). By convention [12,13], a negative sign indicated a counterclockwise tilt. We chose not to analyze the inclination of the house’s walls because the house is drawn in perspective and its copy implies complex cognitive tasks that may interfere with verticality representation.
Ranges of normality beyond which a counterclockwise tilt could be diagnosed in patients were calculated from the data of the 44 healthy participants, for all indices of writing and drawing orientation. A criterion was abnormal if inferior to the value corresponding to the 95th percentile.
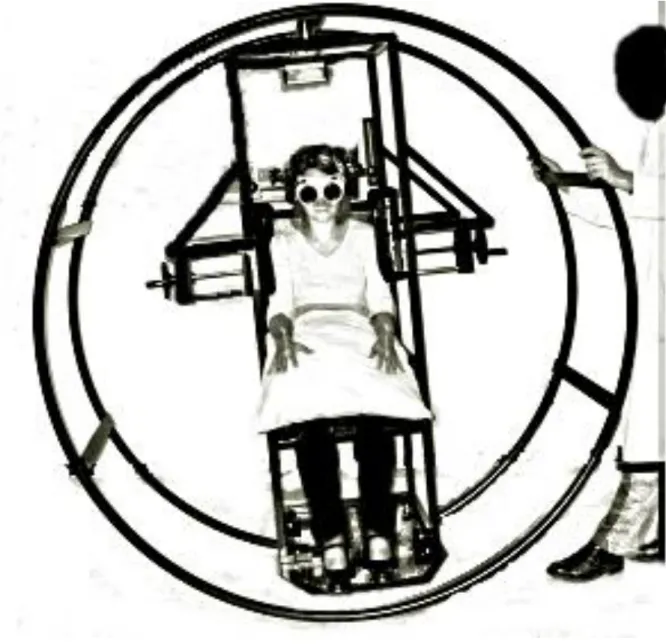
Verticality perception was explored by VV and PV. For VV, subjects sat in a dark room and adjusted a luminous rod to the vertical position [15,16] (Figure 4). The difference between patients’ adjustments and vertical were calculated. For PV, subjects sat in complete darkness in a wheel [17] equipped with an inclinometer (Figure 5). The examinator inclined the wheel to the left or right. The patient gave an estimate of her/his PV by signaling the point of feeling upright. A negative sign indicated a counterclockwise tilt for VV and PV (norms from -2.5° to +2.5°)[15].
Body and non-body neglect were assessed each by 4 tests. Non-body neglect was assessed with the bells test [18], reading test [19], overlapping figure test [20], and the 4 non-body items of the Bergego scale [21]. Body neglect was assessed with 4 tests: the comb and razor [22], Bisiach [23], and fluff tests [24], and the 4 body items of Bergego scale [21]. From the results to these tests with respect to their ranges, we built composite scores assessing non-body and non-body neglect from 0 to 100 (see additional material).
The disability and deficits of individuals with stroke were also assessed by trained therapist. For the disability, the Functional Independence Measure (FIM) [25] was used. Gait disorders were assessed by the mFMA gait score [26]. The contralesional lateropulsion was evaluated by the Scale for Contraversive Pushing (SCP) [27]. Lateropulsion was defined by SCP≥0.75 and Pusher Syndrome (PS) for SCP≥3 and ≥1 for each subdomain (body tilt, pushing behavior, resistance to corrections). Apraxia was assessed by the Apraxic screen of Tulia [28] (<9). The presence or absence of hemianopia was manually evaluated.
14
Statistics
We firstly tested the normal ranges of writing and drawing orientations among 44 age-matched healthy controls. We considered the cutoff of score inferior to the 95th percentile as abnormal for each test.
A Kruskal Wallis was applied to detect the difference of inclinations of the three right trees (drawing) or first three lines (writing). Then we investigated the inter-rater reliability of ad hoc Angle Calculator for writing and drawing orientations. Inter-rater reliability (examiners A1 versus B1) was determined by calculating the interclass correlation coefficient (ICC). Absolute reliability was assessed with the Bland-Altman method with 95% confidence intervals, and with the SE of measurement (SEM=SDX×√1−ICC). SEM was then used to estimate the minimal
detectable change (MDC95=1.96×SEM×√2) for 95% degree of confidence on writing and drawing orientations.
Since most our data for post-stroke individuals followed non-Gaussian distribution, the continuous data were presented as medians with interquartile ranges (IQR). Dichotomized data were presented as numbers and proportions. The relation of vertical orientation between manual measurements with a protactor and Angle Calculator measurements was tested by a Pearson correlation. According to the 3 criteria cutoffs, we dichotomized all individuals into two groups: tilted writing or drawing (WD, at least one abnormal score among three tests) and upright WD groups. We compared the differences between the two groups using Mann Whitney test or Chi-square test (including Fisher exact test). Effect sizes between groups were calculated manually by using Z values of the Mann-Whitney test r=Z/√n, and X² or FET of Chi-square test v=√(X²/n*df). Effect sizes ≥ 0.1, 0.3, or 0.5 represent a small, medium, or large effect, respectively. All variables found significant (p<0.05) within two groups comparisons were then included in a step-wise multivariate regression model (binary logistic regression). Odds ratios (ORs) were estimated with 95% confidence intervals (95% CIs). Significance level was set at p < 0.05. Statistical analysis was performed with SPSS 20.0. Without any other indication, data are given in the form: median (1rst quartile;3rdquartile), 95th percentile, or mean (Standard deviation). The agreement between the existence of a tilt in the writing (lines) and in the drawing (trees) was analyzed by the kappa statistics.
15
Results
Participants
We analyzed 61 complete observations of individuals tested after a RHS, 47 on D-30 (77%), 10 on D-60 (16%), and 4 on D-90 (7%). Their median age was 66 years (53;71); 36 were males (59%). The stroke type was ischemic (n=55, 90%), hemorrhagic (n=6, 10%). At the time of the assessment, their disability was moderate, with a median FIM score of 101.5 (74.2;114), and a median mFMA gait score of 5 (2;6) indicating that half was able to walk without technical aid. A left hemianopia was found in 19 individuals (31%). No apraxia was found.
The 44 healthy participants tested were comparable in age (median 62 [58;70]; p=0.751) and sex ratio (24 males, 54%; p=0.648) to participants with a RHS.
Validity of the measures
There was a strong correlation between angular measures obtained with a protactor and those given by Angle Calculator (r=0.998; p<0.001), indicating that measures performed by Angle Calculator were valid.
Determining criteria from the feasibility in patients
As for the writing, 60 individuals with stroke had followed the instructions and wrote 3 lines (or more). Only one individual had written less than 3 lines (2 lines). In addition no difference was found between the three lines in patients (p=0.622). Consequently, we decided to average the orientation of the 2 or 3 first lines available to determine the criteria left margin tilt and lines’ tilt. So determined, these criteria could be obtained in all patients which made highly feasible our assessments of the writing tilt.
As for the drawing orientation, 55 individuals (90%) had drawn the 4 trees, 5 (8%) had only drawn the 2 most rightward trees (omitting those leftward), and 1 individual (2%) had drawn only the most rightward tree, neglecting the 3 others. We found no difference in the orientation of the 2 or 3 most rightward trees when available (98% of cases; p=0.141).
Therefore to determine the criterion trees’ orientation we decided to average the orientation of the 3 or 2 available trees, otherwise we kept the orientation of the only tree
16
drawn. So determined, this criterion could be obtained in all patients. This was not the case for the baselines of the drawing, missing in 7 individuals (11%), and only drawn on the right part in 6 others. Because of the modest feasibility for this criterion, we decided to discard it for further analyses.
To sum up it was highly feasible to obtained three criteria: the left margin tilt and the lines’ tilt for the writing, trees’s tilt for the drawing (mean of the 3 or 2 most rightward tree, otherwise the one the most rightward).
Reliability of selected criteria in patients
As for the writing, the inter-rater reliability was high both for the margin (ICC=0.999, with 95% CI [0.998-1]; p<0,001) and the lines (ICC = 0.988 with 95% CI [0.975-0.994]; p<0,001) tilts, with measurement error acceptable for the margin tilt (SEM=1.6°, MDC=4.5°), and satisfactory for the lines tilt (SEM=0.94°, MDC=2.6°).
As for the drawing, the inter-rater reliability was high for the trees tilt (ICC=0.927 with 95% CI [0.852-0.964]; p<0,001), with acceptable measurement error (SEM=2.6°,MDC=7.1°).
Ranges of normality for the selected criteria
Interestingly, the writing and the drawing material were not perfectly upright in normals. If no difference from the vertical was found for the margin (p=0.265), likely because of the great dispersion of data (median -1.8° [-5.3;3.6], both the orientations of lines (median -1.2° [-2.3;-0.3]) and trees (median -1° [-2.5;0.5]) were subjected to a counterclockwise tilt with respect to the horizontal (p<0.001) and the vertical (p=0.003), respectively. The cutoff values (95th percentile) determined from the data in normals and beyond which a counterclockwise tilt could be diagnosed in patients were -16.9° for the margin, -4.9° for the lines, (writing) -5.5° for the trees (drawing).
There was no influence of the age on the orientations of the margin (p=0.853), the lines (p=0.404) or the trees (p=0.554). There was no influence of the sex on the orientation of the margin (p=0.897), the lines (p=0.322) or the trees (p=0.494).
Writing and drawing orientations in patients
In all individuals with a stroke, the median margin tilt was -1.9° (-9.8;2.6), the median lines’ tilt was -2° (-3.9;-0.4) and the median trees’ orientation was -0.53° (-3.8;1.7). At least one
17
criteria was counterclockwise tilted in 23 patients (38%): 10 (16%) showing a counterclockwise margin tilt, 11 (18%) showing a counterclockwise lines’ tilt, and 8 (13%) showing a counterclockwise trees’ tilt. Four individual (7%) showed a counterclockwise tilt bearing on 2 criteria, and 1 (2%) bearing on the 3 criteria. Table 1 compares the three criteria of writing and drawing orientation found in these 23 patients to those found in the 38 others with a normal writing or drawing orientation (no abnormal tilt on any criteria), and also to controls. Patients with an upright writing and drawing (upright WD) had criteria similar to normals. Patients with a tilting writing or drawing (tilted WD) showed greater tilts than normals and other patients, for the margin tilt, the lines’ tilt, but not for the trees’ tilt. The effect sizes were large as far as the lines’ tilt is concerned. They were medium for the margin tilt. In all individuals with a stroke, there was a small concordance between the lines’ tilt and the trees’ tilt (kappa=0.32; p=0.02).
We then comparatively analyzed the clinical characteristics of the 23 patients with a tilted WD to the 38 other patients with an upright WD (table 2). Age, sex, and stroke type were comparable, as well as their level of independence, and degree of apraxia. Patients with a tilted-WD presented a clear clinical profile. They showed a greater lateropulsion secondary to a bias in the representation of the vertical (biased PV and VV), a spatial neglect specifically bearing on the non-body domain, and a hemianopia. The association with deficits in representing the vertical was especially strong, but not systematic. However a transmodal biais of verticality (both VV and PV) was found in 12/23 (52%) patients with a tilted-WD and only in 7/38 patients with upright-WD (18.4%, p=0.006). Conversely in the 19 patients who showed a transmodal bias of verticality representation (both VV and PV), 12 (63%) had a tilted-WD. A lateropulsion was found in 15/23 (65%) individuals with tilted-WD versus 6/38 (16%) individuals with upright WD (p<0.001). All the effect sizes were medium.
We then further analyzed the determinants of the line’s tilt which was the most relevant criterion to quantify the orientation of the written or drawn material. We conducted a step-wise logistic regression on the classification tilted versus upright WD, finally 3 types of variables significant in the univariate analysis entered into the model (table 2): the existence of a lateropulsion, the existence of a hemianopia, and the composite score of non-body neglect. The existence of a lateropulsion was the main determinant of the tilted lines (odd ratio = 6.4; 95% CI [1.4-29.7]; p=0.019), whereas the influence of the non-body neglect (odd ratio = 1; 95% CI [0.97-1.05]; p=0.675), and of the hemianopia (odd ratio = 1.6; 95% CI [0.36-7.05]; p=0.54) was
18
not independently significant. This finding shows that the tilted writing is mainly related to a biased verticality representation.
19
Discussion
This is the first study investigating the orientation of writing and drawing material on a series of individuals tested about 30 days after a first RHS (n=61), and compared to 44 controls matched in age and sex. After having implemented valid and reliable criteria to quantify the orientation of the writing and the drawing, we show that a tilted WD is frequent (38% of patients in this series) and that this misorientation is mainly due to a tilted representation of the vertical.
Criteria and methodology for measuring tilted WD after a stroke
We tested 2 types of material: instructed handwriting (identity, address, profession on 3 successive lines), and hand drawing of a model (Gainotti figure). Each material was conceived to give 1 criterion of orientation with respect to the vertical (margin, trees) and 1 criterion of orientation with respect to the horizontal (lines). These 4 criteria were measured with Angle Calculator [11], a software we implemented in order to use it in clinical practice. The best criterion was the mean orientation of the 3 lines written (lines’ tilt). The comprehensibility and the feasibility were excellent since 104/105 individuals wrote 3 lines on which measurement were always easy from the operating mode we defined. In 1/105 individual, the criterion was obtained from 2 lines written. This tool has an excellent criterion validity with a perfect correlation with the gold standard (protactor). This criterion was also highly reliable with interobservator ICC almost reaching 1 with a reasonable minimum detectable change (2.6°). Its discriminative validity was excellent with differences between groups of individuals (healthy controls, patients with upright writing and drawing, and patients with a tilted writing or drawing) highly significant with large effect sizes. All these properties made the task of writing three lines under very simple instructions, the way to measure their orientation with respect to the horizontal and the final criterion obtained by averaging the orientation of the three lines a very interesting novel tool and criterion for assessing the writing orientation of the individuals with a RHS in clinical practice. The 3 other criteria had much less satisfactory properties and may be discarded for further studies and clinical practice.
20
Why did healthy subjects have tilted writing and drawing
A recent pilot study [7] has revealed that normal subjects (n=12) instructed to write by hand on a blank sheet of paper centered with respect to their trunk and head do not write horizontally but with a systematic slight counterclockwise tilt (mean -1.8° ; SD=1°). They also drew with a similar counterclockwise tilt of the baselines to be copied (-1.5° ; SD=0.6). The current study confirms these findings with similar magnitudes for the lines’ tilt (median -1.2° [-2.3;-0.3]) and extends it to the vertical with trees drawn tilted (-1° [-2.5;0.5]). This is not an imprecision of the action to write or to draw, because the tilt was systematic. Also the representation of the vertical was not assessed in these healthy subjects, one may assume that it was normal because the representation of the vertical and the horizontal have been repetitively found normal in healthy subjects [15–17]. Therefore we do not think that this normal counterclockwise tilt in writing and drawing is due to a spatial bias. Instead we think that this bias might be due to the kinematic of the shoulder. This hypothesis could be tested by comparing the orientation of the writing and drawing in left and right handers, the native language of whom being associated to writing from left to right or right to left.
Importance of writing and drawing tilt after a RHS
We observed that the writing and drawing are frequently tilted in individuals with a RHS, with a prevalence comparable to that known for spatial neglect [6,29] and a bias in the representation of the vertical [17] (about 40%). Magnitudes of this tilt were pronounced, reaching a maximum of 51°. If the present study was not design to check the persistence of an orthogonality between bias in the representation of the vertical and of the horizontal, this orthogonality was interestingly preserved in the patient JW experimentally investigated recently [7].
Determinant of the tilted WD after a RHS
Our multivariate analysis showed that the unique determinant of tilted lines was the existence of lateropulsion, known to express a counterclockwise tilt in the representation of the vertical in RHS. So our series confirms findings suggested by our case study [7]. These patients who showed a lateropulsion due to a bias in verticality representation also often present a spatial neglect which explains the association found with spatial neglect. It was also noteworthy
21
that this association was important for the non body neglect (visual neglect), vision being crucial to guide the writing.
Perspectives and clinical implications
It is easy to detect and quantify a tilted writing in neurorehabilitation. Our study strongly suggests to do it systematically. This may alert of the existence of a bias in verticality perception, which should be further analyzed to guide the rehabilitation. Conversely, the writing tilt could be modulated by appropriate rehabilitation techniques, as shown by Jolly et al [7]. This remains to be tested in large series of patients with the idea that training patients to write and draw upright could help to recalibrate the internal model of verticality and facilitates balance and gait recovery.
Study limitations
The main limitation was the retrospective analysis of data of the writing and the drawing collected in routine in patient. We cannot exclude that the sheet of paper was not always perfectly centered even if neuropsychologists carefully checked that point. Some degrees of misalignment may have occurred during the session in patients especially in patient seated in their wheelchair.
The constitution of groups of individuals was not optimal, because the group with tilted writing and drawing included individuals with lines considered upright. Given the relatively small sample of this series, it was not possible to constitute a group limited to individuals with tilted lines.
22
Conclusion
In this study, we investigated 61 individuals tested about 30 days after a RHS and 44 healthy subjects. Among the criteria tested to analyze the tilted writing and drawing, three were found reliable: the mean lines’ tilt, which was the most solid criterion, the left margin tilt (writing) and the mean inclination of the right most trees (drawing). At least one criterion was tilted in 23 patients (38%), who showed a greater bias in perception of verticality. The lateropulsion was the main determinant for the mean lines’ tilt. This association was strong but not systematic, suggesting that a biased internal model of verticality is not the only mechanism underling these manifestations. This is corroborated by the fact that healthy subjects also have a tilted writing and drawing, despite a precise perception of verticality. These criteria could be used as an alert for the need of evaluating the perception of verticality by more specific tests, in order to begin an appropriated rehabilitation.
This study opens the field for larger cohort studies exploring the link between the mean lines’ tilt and verticality perception.
25
References
[1] Beeson P, Rapcsak S, Plante E, Chargualaf J, Chung A, Johnson S, et al. The neural
substrates of writing: a functional magnetic resonance imaging study. Aphasiology
2003;17:647–65.
[2] Planton S, Longcamp M, Péran P, Démonet J-F, Jucla M. How specialized are
writing-specific brain regions? An fMRI study of writing, drawing and oral spelling. Cortex
2017;88:66–80.
[3] Rapp B, Dufor O. The neurotopography of written word production: An fMRI
investigation of the distribution of sensitivity to length and frequency. Journal of Cognitive
Neuroscience 2011;23:4067–81.
[4] Ardila A, Rosselli M. Spatial agraphia. Brain and Cognition 1993;22:137–47.
[5] Chen P, Chen CC, Hreha K, Goedert KM, Barrett AM. Kessler Foundation Neglect
Assessment Process uniquely measures spatial neglect during activities of daily living.
Archives of Physical Medicine and Rehabilitation 2015;96:869-876.e1.
[6] Pedersen PM, Jørgensen HS, Nakayama H, Raaschou HO, Olsen TS. Hemineglect in acute
stroke-incidence and prognostic implications. The Copenhagen Stroke Study. American Journal
of Physical Medicine and Rehabilitation 1997;76:122–7.
[7] Jolly C, Piscicelli C, Gimat R, Béranger C, Guinet E, Mathevon L, et al. Tilted writing after
stroke, a possible sign of biased verticality representation. Annals of Physical and
Rehabilitation Medicine, Minor revision.
[8] Lee M, Suh MK, Lee MH, Lee JS, Moon SY. Agraphia caused by acute right parietal
26
[9] Hartman DE, Briggs SJ, Vishwanat B. Dysgraphia after right hemisphere stroke. Archives of Physical Medicine and Rehabilation 1985;66:182–4.
[10] Azouvi P, Bartolomeo P, Beis J-M, Perennou D, Pradat-Diehl P, Rousseaux M. A battery
of tests for the quantitative assessment of unilateral neglect. Restorative Neurology ans
Neuroscience 2006;24:273-285
[11] Carré O. Angle Calculator. Grenoble: 2018.
[12] Pérennou D, Amblard B, Leblond C, Pélissier J. Biased postural vertical in humans with
hemispheric cerebral lesions. Neuroscience Letters 1998;252:75–8.
[13] Yelnik AP, Lebreton FO, Bonan IV, Colle FMC, Meurin FA, Guichard JP, et al. Perception
of verticality after recent cerebral hemispheric stroke. Stroke 2002;33:2247–53.
[14] Peskine A, Urbanski M, Pradat-Diehl P, Bartolomeo P, Azouvi P. Negligenza spaziale
unilaterale. EMC - Neurologia 2010;10:1–14.
[15] Pérennou D, Piscicelli C, Barbieri G, Jaeger M, Marquer A, Barra J. Measuring verticality
perception after stroke: why and how? Clinical Neurophysiology 2014;44:25–32.
[16] Piscicelli C, Pérennou D. Visual verticality perception after stroke: A systematic review
of methodological approaches and suggestions for standardization. Annals of Physical and
Rehabilitation Medicine 2017;60:208–16.
[17] Pérennou D, Mazibrada G, Chauvineau V, Greenwood R, Rothwell J, Gresty MA, et al.
Lateropulsion, pushing and verticality perception in hemisphere stroke: a causal relationship?
Brain 2008;131:2401–13.
[18] Azouvi P, Samuel C, Louis-Dreyfus A, Bernati T, Bartolomeo P, Beis J, et al. Sensitivity of
clinical and behavioural tests of spatial neglect after right hemisphere stroke. Journal of
27
[19] Azouvi P, Olivier S, de Montety G, Samuel C, Louis-Dreyfus A, Tesio L. Behavioral
assessment of unilateral neglect: study of the psychometric properties of the Catherine Bergego scale. Archives of Physical Medicine and Rehabilitation 2003;84:51–7.
[20] Gainotti G, D’Erme P, Bartolomeo P. Early orientation of attention toward the half
space ipsilateral to the lesion in patients with unilateral brain damage. Journal of Neurology,
Neurosurgery & Psychiatry 1991;54:1082–9.
[21] Bergego C, Morin L, Renard C. Validation d’une échelle d’évaluation fonctionnelle de
l’héminégligence dans la vie quotidienne: I’échelle CB 1985;38:183-189
[22] Beschin N, Robertson IH. Personal versus extrapersonal neglect: a group study of their
dissociation using a reliable clinical test. Cortex 1997;33:379–84.
[23] Bourlon C, Chokron S, Bachoud-Lévi A-C, Coubard O, Bergeras I, Moulignier A, et al.
Normalisation d’une batterie d’évaluation de l’imagerie mentale visuelle et de la perception visuelle. Revue Neurologique 2009;165:1045–54.
[24] Cocchini G, Beschin N, Jehkonen M. The Fluff Test: a simple task to assess body
representation neglect. Neuropsychological Rehabilitation 2001;11:17–31.
[25] Dodds TA, Martin DP, Stolov WC, Deyo RA. A validation of the Functional Independence
Measurement and its performance among rehabilitation inpatients. Archives of Physical
Medicine and Rehabilitation 1993;74:531–6.
[26] Lindmark B, Hamrin E. Evaluation of functional capacity after stroke as a basis for
active intervention. Presentation of a modified chart for motor capacity assessment and its reliability. Scandinavian Journal of Rehabilitation Medicine 1988;20:103–9.
28
[27] Baccini M, Paci M, Nannetti L, Biricolti C, Rinaldi LA. Scale for Contraversive Pushing:
cutoff Scores for diagnosing “Pusher Behavior” and construct validity. Physical Therapy
2008;88:947–55.
[28] Vanbellingen T, Kersten B, Van de Winckel A, Bellion M, Baronti F, Muri R, et al. A new
bedside test of gestures in stroke: the apraxia screen of TULIA (AST). Journal of Neurology,
Neurosurgery and Psychiatry 2011;82:389–92.
[29] Bowen A, McKenna K, Tallis RC. Reasons for variability in the reported rate of
29
Tables and figures
30
Figure 2: Schematic view of the way to compute criteria of the writing orientation
Tilt of the left margin with respect to the vertical and tilt of the 3 lines with respect to the horizontal.
31
Figure 3: Schematic view of the way to compute criteria of the drawing orientation
Inclination of the left and right baseline with respect to the horizontal, and inclination of the four trees with respect to the vertical.
32
33
34
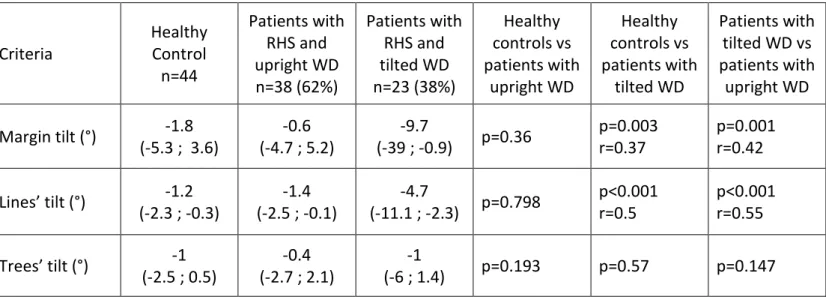
Table 1: Comparison between patients and healthy subjects for writing and drawing measurements
Data are presented in the form median (Q1;Q3) ; Effect sizes ≥ 0.1, 0.3, and 0.5 represent a small, medium, and large effect, respectively
Criteria Healthy Control n=44 Patients with RHS and upright WD n=38 (62%) Patients with RHS and tilted WD n=23 (38%) Healthy controls vs patients with upright WD Healthy controls vs patients with tilted WD Patients with tilted WD vs patients with upright WD Margin tilt (°) -1.8 (-5.3 ; 3.6) -0.6 (-4.7 ; 5.2) -9.7 (-39 ; -0.9) p=0.36 p=0.003 r=0.37 p=0.001 r=0.42 Lines’ tilt (°) -1.2 (-2.3 ; -0.3) -1.4 (-2.5 ; -0.1) -4.7 (-11.1 ; -2.3) p=0.798 p<0.001 r=0.5 p<0.001 r=0.55 Trees’ tilt (°) -1 (-2.5 ; 0.5) -0.4 (-2.7 ; 2.1) -1 (-6 ; 1.4) p=0.193 p=0.57 p=0.147
Here large effect size were found for the criterion lines’ tilt, both for the comparison of healthy controls with individuals with a tilted WD and for the comparison of individuals with and without a tilted WD.
35
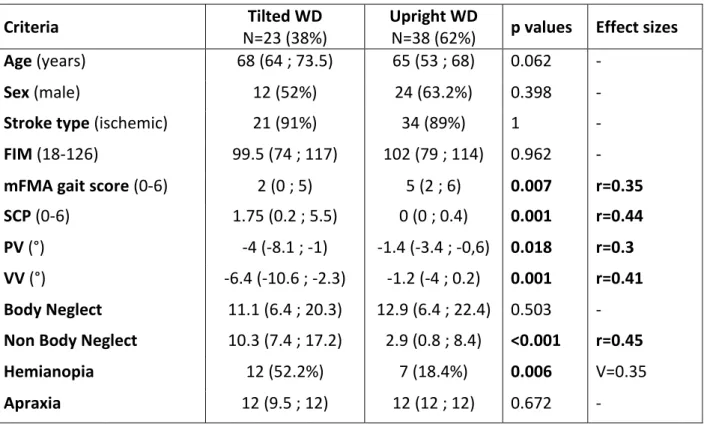
Table 2: Comparison between patients with tilted WD and patients with upright WD
Data are presented in the form median (Q1;Q3) or number of observations (%) ;
Effect sizes ≥ 0.1, 0.3, and 0.5 represent a small, medium, and large effect, respectively.
Criteria Tilted WD
N=23 (38%)
Upright WD
N=38 (62%) p values Effect sizes
Age (years) 68 (64 ; 73.5) 65 (53 ; 68) 0.062 -
Sex (male) 12 (52%) 24 (63.2%) 0.398 -
Stroke type (ischemic) 21 (91%) 34 (89%) 1 -
FIM (18-126) 99.5 (74 ; 117) 102 (79 ; 114) 0.962 -
mFMA gait score (0-6) 2 (0 ; 5) 5 (2 ; 6) 0.007 r=0.35
SCP (0-6) 1.75 (0.2 ; 5.5) 0 (0 ; 0.4) 0.001 r=0.44
PV (°) -4 (-8.1 ; -1) -1.4 (-3.4 ; -0,6) 0.018 r=0.3
VV (°) -6.4 (-10.6 ; -2.3) -1.2 (-4 ; 0.2) 0.001 r=0.41
Body Neglect 11.1 (6.4 ; 20.3) 12.9 (6.4 ; 22.4) 0.503 -
Non Body Neglect 10.3 (7.4 ; 17.2) 2.9 (0.8 ; 8.4) <0.001 r=0.45
Hemianopia 12 (52.2%) 7 (18.4%) 0.006 V=0.35
36
Additional material
STROBE Statement—Checklist of items that should be included in reports of cohort studies
Item
No Recommendation
Title and abstract 1 (a) Indicate the study’s design with a commonly used term in the title or the
abstract
(b) Provide in the abstract an informative and balanced summary of what was done and what was found
Introduction
Background/rationale 2 Explain the scientific background and rationale for the investigation being
reported
Objectives 3 State specific objectives, including any prespecified hypotheses
Methods
Study design 4 Present key elements of study design early in the paper
Setting 5 Describe the setting, locations, and relevant dates, including periods of
recruitment, exposure, follow-up, and data collection
Participants 6 (a) Give the eligibility criteria, and the sources and methods of selection of
participants. Describe methods of follow-up
(b) For matched studies, give matching criteria and number of exposed and unexposed
Variables 7 Clearly define all outcomes, exposures, predictors, potential confounders, and
effect modifiers. Give diagnostic criteria, if applicable Data sources/
measurement
8* For each variable of interest, give sources of data and details of methods of
assessment (measurement). Describe comparability of assessment methods if there is more than one group
Bias 9 Describe any efforts to address potential sources of bias
Study size 10 Explain how the study size was arrived at
Quantitative variables 11 Explain how quantitative variables were handled in the analyses. If applicable,
describe which groupings were chosen and why
Statistical methods 12 (a) Describe all statistical methods, including those used to control for
confounding
(b) Describe any methods used to examine subgroups and interactions (c) Explain how missing data were addressed
(d) If applicable, explain how loss to follow-up was addressed (e) Describe any sensitivity analyses
Results
Participants 13* (a) Report numbers of individuals at each stage of study—eg numbers
potentially eligible, examined for eligibility, confirmed eligible, included in the study, completing follow-up, and analysed
(b) Give reasons for non-participation at each stage (c) Consider use of a flow diagram
Descriptive data 14* (a) Give characteristics of study participants (eg demographic, clinical, social)
and information on exposures and potential confounders
(b) Indicate number of participants with missing data for each variable of interest
(c) Summarise follow-up time (eg, average and total amount)
Outcome data 15* Report numbers of outcome events or summary measures over time
Main results 16 (a) Give unadjusted estimates and, if applicable, confounder-adjusted
37
confounders were adjusted for and why they were included
(b) Report category boundaries when continuous variables were categorized (c) If relevant, consider translating estimates of relative risk into absolute risk for a meaningful time period
Other analyses 17 Report other analyses done—eg analyses of subgroups and interactions, and
sensitivity analyses
Discussion
Key results 18 Summarise key results with reference to study objectives
Limitations 19 Discuss limitations of the study, taking into account sources of potential bias or
imprecision. Discuss both direction and magnitude of any potential bias
Interpretation 20 Give a cautious overall interpretation of results considering objectives,
limitations, multiplicity of analyses, results from similar studies, and other relevant evidence
Generalisability 21 Discuss the generalisability (external validity) of the study results
Other information
Funding 22 Give the source of funding and the role of the funders for the present study
and, if applicable, for the original study on which the present article is based *Give information separately for exposed and unexposed groups.
Note: An Explanation and Elaboration article discusses each checklist item and gives methodological background
and published examples of transparent reporting. The STROBE checklist is best used in conjunction with this article (freely available on the Web sites of PLoS Medicine at http://www.plosmedicine.org/, Annals of Internal Medicine at http://www.annals.org/, and Epidemiology at http://www.epidem.com/). Information on the STROBE Initiative is available at http://www.strobe-statement.org.
38
Operating mode for Angle Calculator
1/ Criteria used on BEN writing test :
The first step was to define the objective vertical by clicking on two distant points on the right edge of the paper.
For the margin tilt the operator had to click on the most left-most point on each line. The application calculated a regression line with these three points, and the angle between this line and the objective vertical.
For the inclination of the three lines the operator had to click on the lowest point of the first and last letter with no descender, to define an inclination line. The application calculated the angle between this line and the perpendicular to the objective vertical.
2/ Criteria used on the drawing test (Gainotti figure) :
The first step was to define the objective horizontal by clicking on two distant points of the model figure baseline.
Then the operator defined on the individual production the inclination line of each tree by clicking on the lowest and highest point of the right edge of each trunk. The inclination of each tree was defined by the angle between this line and the perpendicular to the objective horizontal. We chose to use the right edge of each tree because we supposed several patients would have an object centered neglect.
To determine the inclination angle of the left baseline the operator had to click on the left extremity of the baseline and on the intersection point between the baseline and the house’s second wall (i.e. the middle of the figure).
For the inclination angle of the right half line the operator had to click on the intersection point between the baseline and the house’s second wall and on the right extremity of the baseline. The application calculated the angle between these half lines and the objective horizontal.
39
Selection of items from Catherine Bergego Scale :
Body neglect :
1/ Forgets to groom or shave the left part of his/her face
2/ Experiences difficulty in adjusting his/her left sleeve or slipper 3/ Forgets to clean the left side of his/her mouth after eating
4/ Forgets about the left part of his/her body (exemple : forgets to put his/her upperlimb on the armrest ; or his/her left foot on the wheelchair rest ; or forgets to use his/her left arm when he/she needs to)
Non body neglect :
1/ Forgets to eat food on the left part of his/her plate
2/ Has difficulty in paying attention to noise or people addressing to him/her from the left 3/ Experiences difficulty in finding his/her way towards the left when traveling in familiar places or in the rehabilitation unit
4/ Experiences difficulty in finding his/her personal belongings in the room or bathroom when they are on the left side
Cotation :
0=no neglect 1=mild neglect 2=moderate neglect 3=severe neglect
Total : (Total score/number of valid items) x 8 = …/24
Non specific items which we did not use :
1/ Experiences difficulty in looking towards the left
2/ Collides with people or objects on the left side, such as doors or furniture (either while walking or driving a wheelchair)
40
Composite scores for neglect
Composite Score for extracorporal neglect :
Test Rating Formula Left USN if 1/ Bells test R1=Number of omissions
(0 to 35)
S1=(R1/35)x100 > 6/35 (17.14%)
2/ Overlapping figures R2 =Number of omissions
(0 to 20)
S2=(R2/20)x100 > 1/20 (5%)
3/ Reading test R3=Number of omissions
(0 to 116) S3=(R3/116)x100 > 1/116 (0.86%) 4/ Extracorporal items of Begergo Scale R4=(Score/number of valid items) x 4 (0 to 12) S4=(R4/12)x100 > 1/12 (8.33%) Extracorporal neglect composite Score/100 / ST=(S1+ S2+ S3+ S4)/4 > 7.83%
S1(%)=Score at test 1 ; ST (%)= Total score
Composite Score for corporal neglect :
Test Rating Formula Left USN if 5/ Bisiach test R5=Score eyes open +
score eyes closed (0 to 6)
S5=(R5/6)x100 > 1/6 (16.67%)
6/ Fluff test R6=Number of
omissions
S6=(R6/15)x100 > 3/15 (20%)
7/ Comb and razor test R7=(Right shot-left shot)
/ (right shot + left shot + ambiguous) x 100 S7=R7 > 11% 8/ Corporal items of Bergego Scale R8=(Score/number of valid items) x 4 (0 to 12) S8=(R8/18)x100 > 1/12 (8.33%) Corporal neglect composite score/100 / ST2=(S5+ S6+G+ S8)/4 > 14%