Publisher’s version / Version de l'éditeur:
Canadian Acoustics/Acoustique Canadienne, 26, December 4, pp. 15-21,
1998-12-01
READ THESE TERMS AND CONDITIONS CAREFULLY BEFORE USING THIS WEBSITE. https://nrc-publications.canada.ca/eng/copyright
Vous avez des questions? Nous pouvons vous aider. Pour communiquer directement avec un auteur, consultez la première page de la revue dans laquelle son article a été publié afin de trouver ses coordonnées. Si vous n’arrivez pas à les repérer, communiquez avec nous à [email protected].
Questions? Contact the NRC Publications Archive team at
[email protected]. If you wish to email the authors directly, please see the first page of the publication for their contact information.
NRC Publications Archive
Archives des publications du CNRC
This publication could be one of several versions: author’s original, accepted manuscript or the publisher’s version. / La version de cette publication peut être l’une des suivantes : la version prépublication de l’auteur, la version acceptée du manuscrit ou la version de l’éditeur.
Access and use of this website and the material on it are subject to the Terms and Conditions set forth at
Optimizing classroom acoustics using computer model studies
Reich, R.; Bradley, J. S.
https://publications-cnrc.canada.ca/fra/droits
L’accès à ce site Web et l’utilisation de son contenu sont assujettis aux conditions présentées dans le site LISEZ CES CONDITIONS ATTENTIVEMENT AVANT D’UTILISER CE SITE WEB.
NRC Publications Record / Notice d'Archives des publications de CNRC:
https://nrc-publications.canada.ca/eng/view/object/?id=dff24faf-f87b-47ec-9012-d79b3b9efb2f https://publications-cnrc.canada.ca/fra/voir/objet/?id=dff24faf-f87b-47ec-9012-d79b3b9efb2fhttp://www.nrc-cnrc.gc.ca/irc
Opt im izing c la ssroom a c oust ic s using c om put e r m ode l st udie s
N R C C - 4 2 0 4 5
R e i c h , R . ; B r a d l e y , J . S .
D e c e m b e r 1 9 9 8
A version of this document is published in / Une version de ce document se trouve dans:
Acoustics/Acoustique Canadienne, 26, (4), December, pp. 15-21, December 01,
1998
The material in this document is covered by the provisions of the Copyright Act, by Canadian laws, policies, regulations and international agreements. Such provisions serve to identify the information source and, in specific instances, to prohibit reproduction of materials without written permission. For more information visit http://laws.justice.gc.ca/en/showtdm/cs/C-42
Les renseignements dans ce document sont protégés par la Loi sur le droit d'auteur, par les lois, les politiques et les règlements du Canada et des accords internationaux. Ces dispositions permettent d'identifier la source de l'information et, dans certains cas, d'interdire la copie de documents sans permission écrite. Pour obtenir de plus amples renseignements : http://lois.justice.gc.ca/fr/showtdm/cs/C-42
Canadian Acoustics / Acoustique Canadienne 26(4) J5-2J (1998) Research article / Article de recherche
Optimizing Classroom Acoustics Using Computer Model Studies'
Rebecca Reich and John Bradley,
Institute for Research in Construction, National Research Council, Montreal Road Ottawa, KJA OR6.
Abstract
Speech intelligibility in rooms is determined by both room acoustics characteristics as well as speech-to-noise ratios. These two types of effects are combined in measures such as useful-to-detrimental sound ratios which are directly related to speech intelligibility. This paper reports investigations of optimum acoustical conditions for classrooms using the ODEON room acoustics computer model. By determining conditions that relate to maximum useful-to-detrimental sound ratios, optimum conditions for speech are determined. The results show that an optimum mid-frequency reverberation time for a classroom is approximately 0.5 s, but speech intelligibility is not very sensitive to small deviations from this optimum. Speech intelligibility is influenced more strongly by ambient noise levels. The optimum location of sound absorbing material was found to be on the upper parts of the walls.
Resume
L'intelligibilite de la parole dans une chambre est determinee par les caractersitiques acoustiques et aussi par les rapports parole-bruit. Ces deux types d'effets sont combines dans des mesures com me des rapports son-utile/son-nuisible, qui sont relies directement
a
l'intelligibilite de la parole. Cet article presente les investigations des conditions acoustiques optimums pour des classes en utilisant Ie modele genere par la programme acoustique ODEON. En determinant les conditions reliees aux rapports son-utile/son-nuisible maximums, il est possible de trouver des conditions optimums pour la parole. Les resultats montrent qu'un temps de reverberation mi-frequence optimum pour une classe est environ 0.5 s, mais I'intelligibilite de la parole n'est pas tres susceptible aux petites deviations de cet optimum. L'intelligibilite de la parole est influencee plus fortement par les niveaux de bruit ambiant. On trouve que la location optimum de materiel absorbant est sur la partie superieure des murs.1.0 Introduction
The intelligibility of speech in a classroom must be critical to the learning process. When the words of the teacher or of other students are not completely intelligible, students cannot learn efficiently. Speech intelligibility (SI) can be measured as the percentage of test words heard correctly by groups of listeners. Intelligibility can also be related to various acoustical quantities, which can then be used to assess conditions for speech in rooms without having to perform cumbersome speech intelligibility tests.
The intelligibility of speech in rooms is related to the levels of the speech sounds and ambient noises as well as to the room acoustics characteristics of the space. The higher the level of the speech sounds relative to the ambient noise, the greater the intelligibility of the speech. Thus, the effects of speech and noise levels are usually considered in terms of speech-to noise ratios (SIN), (Le. a signal-to-noise ratio where the signal is the speech). Speech intelligibility increases with increasing speech-to-noise ratio until an SIN of approximately +I5 dB is reached which typically corresponds to 100% SI [1,2].
Speech intelligibility is also influenced by room acoustics. This was originalIy assessed in terms of the reverberation
-15-time (RT) of the room. Various optimum reverberation times have been recommended to maximize speech intelligibility in rooms and these optimum values usually increase with increasing room volume [3]. The effect of room acoustics on speech intelligibility is now thought to be better related to measures that more correctly assess the benefits of both the direct sound and reflections arriving within about 50 ms after the direct sound [1,4,5]. Because our hearing system effectively integrates these early reflections together with the direct sound, they contribute to increasing intelligibility. However, later arriving reflections degrade intelligibility by causing one word to blur into the next. Thus, early-to-Iate arriving sound ratios are now thought to be better indicators of the effect of room acoustics on speech intelligibility. For example,Cso is the
ratio of the early-arriving speech energy in the flTst 50 ms after the direct sound to the later-arriving speech energy. Three different acoustical measures are available that combine both the room acoustics and speech/noise aspects into a single quantity. The speech transmission index (ST!) (or its simplificationRASTl)is perhaps the best known [6]. It is derived from modulation transfer functions that are influenced by both ambient noise and room acoustics. The useful-to-detrimental sound ratio concept was flTst proposed
by Lochner and Burger [5] and a simplification was later evaluated by Bradley [1,4]. In this ratio, the useful energy is the early arriving speech sound. The detrimental energy is the sum of the late arriving speech energy and the ambient noise. The third measure, %Alcons, is derived from the direct sound level, the ambient noise level and the reverberation time [7]. All three measures have recently been compared and shown to be strongly correlated with each other [12].
The current paper reports on investigations to determine how to obtain optimum acoustical conditions in a typical classroom. The classroom was modeled using the ODEON room acoustics ray tracing program. Acoustical conditions were assessed in terms of both early-to-Iate arriving sound ratios (C,o) and useful-to-detrimental sound ratios (V,o). It was possible to determine optimum reverberation times for a typical classroom and also the optimum placement of sound absorbing material to maximize speech intelligibility.
2.0 The ODEON Model Classroom
The ODEON room acoustics ray-tracing program (version 2.6 for DOS) was used to model a typical classroom. The geometry of the classroom is illustrated in Figure 1. The room was I I m lon
f
by 9 m wide and 3.4 m high with avolume of 336.6 m . The students were simulated by an absorbing block 1.8 m from the rear wall 3 m from the front wall and centered between the side walls. As shown in Figure I, one source position was used and 9 receiver positions. Four different sources were used alternatively at the same location. One source was omni-directional and the others had the directionality of a human talker. One of the 3 directional sources was directed down the centre line of the classroom towards the rear wall. The other two were directedat ±45 degrees from this.
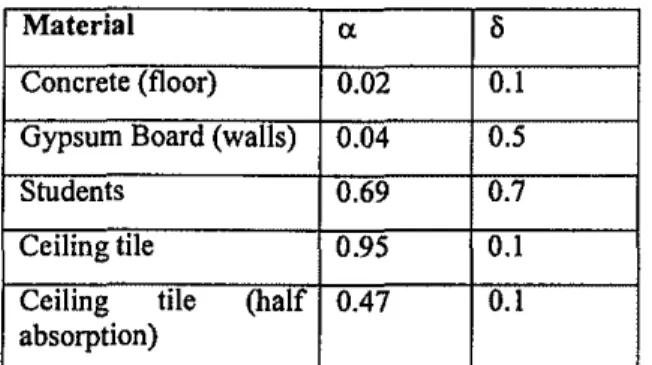
Material ex B
Concrete (floor) 0.02 0.1 Gypsum Board (walls) 0.04 0.5
Students 0.69 0.7
Ceiling tile 0.95 0.1
Ceiling tile (half 0.47 0.1 absorption)
Table I. Material properties, absorptIOn coefficientexand diffusion coefficients B .
For simplicity, in this paper only 1000 Hz results will be presented. The 1000 Hz absorption coefficients of the various surfaces are given in Table I. The table also shows the diffusion coefficients for each surface used in the ODEON calculations. The floor was assumed to be a smooth hard concrete surface and the walls gypsum board. The block representing the students was given the absorption coefficients of people sitting on wooden chairs.
In the initial experiments the absorption of the ceiling was varied but in the final experiments absorption representative of highly absorbing ceiling tiles (shown in Table I) was used.
3.0 Acoustical Measures
The ODEON program directly calculates values of the reverberation time (RT) and the early decay time (EDT). It also calculates expected sound pressure levels (SPL) based on the source having a sound power representative of speech. Although ODEON does not provide Cso values, it
does provide values of Deutlikeit (D) which is usually referred to as 'definition' or 'distinctness' in English. Deutlikeit measures the ratio of early-arriving to total speech energy and can be related toCso as follows,
Cso(ODEONj = 10 10g[D/(l-D)}, dB (I)
Using this equation, C,o values were calculated from the ODEON output ofDvalues.
For an ideal exponential decay, one can calculate Cso values from decay times. From the ratio of the integrals of the early (0 to 50 ms) and the late (50 ms to co) intervals of an ideal exponential decay one obtains,
Cso(RT)
=
10 log[e(l3.m'O.OSIRT) - I], dB (2) in terms of reverberation time (RT) or,C,o(EDT) = 10 log[e(13.m'O.OSIEDT)-1], dB (3) in terms of the early decay time (EDT).
Equations (2) and (3) provide simple techniques for estimating Cso values when only the decay times are
'm
Figure 1. ODEON model of the classroom showing source position (large filled circle) and receiver positions (smallfilled circles).
16-,
,
known. Because they are based on the assumption of ideal exponential decays, they will give different C,. values than those calculated from the actual impulse responses but may be satisfactory approximations in small rooms.
Useful-to-detrimental ratios are the ratio of the early arriving speech energy to the sum of the late arriving speech energy and the ambient noise. They relate directly to speech intelligibility and can also be derived from
C,.
values combined with speech and noise levels as follows,U,. =IOlog{c,./[l+(c,.+I)lOINoJ".sPIJIJOj}, dB (4)
where c,. are the linear andnotthe logarithmic early-to-Iate
ratios.
(2) and (3) above to test the accuracyofthese approximate
estimatesof
C,.
values. These arecompared in Figure 3forthe samevariations ofceilingabsorption. Increased ceiling
absorption leads to less later arriving sound energy and to
increased
C,.
values. Forthese cases,bothestimates of C,. values agree reasonably well with the ODEON calculations.However, C,.values estimated from EDTvalues agree best with the
C,.
values calculated directly from ODEON impulseresponses. EDTvalues aremore influenced by the details of earlyreflections and hence can be used to better estimateC,. values. C,.(RT) values were leastsatisfactory for the ex= 0.9 case where theRTwasmostdifferenttotheEDT.
4.0 Comparisons with Predictions from Sabine
and Eyring Equations
The ODEONcalculationswere first validated bycomparing
calculated RTvalues with those obtained from the Sabine and Eyring reverberation time equations. Because it isnot obvious what values of diffusion coefficients should be assigned to each surface, these comparisons give a check that the results appearto be reasonable. In these tests the 1000 Hz absorption coefficient ofthe ceiling was varied
from 0.1 to 0.9 in stepsof0.2. This gave a realistic range of acoustical conditions in the classroomfor comparisons of
the calculated reverberation times.
Figure 2 compares the resulting reverberation times from
ODEON ray tracing results andfrom the Sabine and Eyring
reverberationtime equations. All 3 resultsshow decreasing
reverberation times with increased ceiling absorption as
would be expected. The ODEON calculationsof RTagree very closely withthose obtainedusing the Sabineequation. RTvalues obtained using the Eyring equation are a little lower. The results suggest that the ODEON model is a reasonable representationofa typical classroom.
C,.
values obtained from ODEON ray tracing results(C,.(ODEON) werecomparedto estimates using equations
5.0 Estimating the Optimum Reverberation
Time
For the results in the previous section, adding more absorption to the ceiling systematically decreased the
reverberationtime. At the same time
C,.
values increased, indicating better conditions for speech. However, theaddition of absorption to the ceilingalsocaused a decrease
ofcalculated speech sound levels in the classroom. Fora particular ambientnoiselevel, thiswould lead to decreased
speech-to-noise ratios and hence decreased speech intelligibility. Thus, adding absorptionhasboth beneficial and detrimental effects. Increased absorptionleadsto both
increased
C,.
values and decreased speech-to-noise ratios.There must besomeintermediateamount of absorptionthat
would lead to an optimum compromise corresponding to
the maximum speech intelligibility. This optimum amount
of sound absorbing material will relate to a particular reverberation time, which will be the optimum
reverberation timeformaximum speech intelligibility in the
classroom.
This optimum reverberation time can be determined from
the condition that leads to the maximum useful-to-detrimental sound ratio (U,.). U,. is directly related to
D2 QNdイMセセM⦅セ _ _セ _ _r - _ - ,
セNイP
セ⦅NLNB....
LN[[セZNZ
..
...
セ
セ...セ...•
.'I
..·...
... CS)(RT)CSO(EDnI
セM C50(CllEOOl 2•
•
D.' 'D'DL_ _セBL⦅セMNLセMセBMセMBセMMGLLLL l'eloer4absaptionFigure 2. Reverberation time versus ceiling absorption for average of9receivers and OMNI source at 1000 Hz.
••L _
-20..._ -..._ -..._ -..._...J,oo Pen:entabsorplion
Figure 3. C,. versus ceiling absorption for average of4 sources and 9 receivers, 1000 Hz.
17
VイMMセMMイMMMMNLNNNMMMML
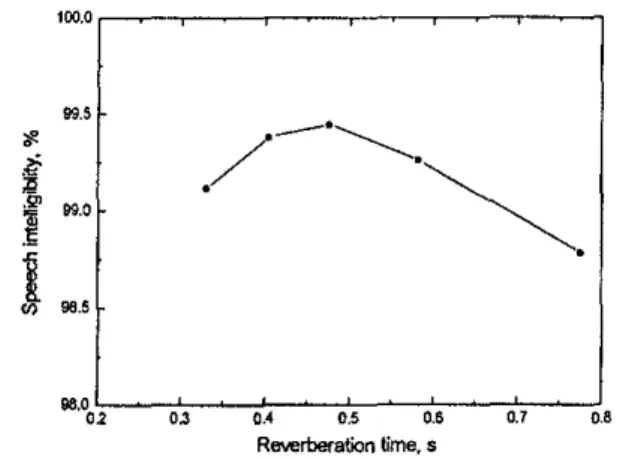
98.°0':-,---:!,,;;--ofO.4;--o,c.'''-''-O''.'--'OC;.'--;!O'
Reverberation time. s
Figure 5. Variation oj speech intelligibility with reverberation timeJor 40 dBA ambient noise.
99.5
6.0 Optimum Placement of Sound Absorbing
Material
approximately 0.5 s reverberation time, a wide range of reverberation times lead to speech intelligibility scores within 0.5% of the maximum. Thus, obtaining exactly the optimum reverberation time is not very critical to achieving near optimum conditions for speech. This is partly because intelligibility is directly related to C" but only indirectly related to RT.
Although the reverberation time is only influenced by the average sound absorption in the room, C,o values can be affected by the location of the absorbing material. Thus it may be possible to improve conditions for speech by more optimally locating the available sound absorbing material and without changing the reverberation time. Previous recommendations include: putting absorption on the ceiling and rear wall [9], and avoiding treating the centre of the ceiling with sound absorbing material (10]. In fact a German standard (II] recommends this latter approach for rooms such as classrooms.
While it is difficult to change the location of absorption in a real room, it can be done quite conveniently in a computer model such as ODEON. Nine different configurations of added sound absorbing material were tested. In all cases the total sound absorption was kept constant. A highly absorbing ceiling material was assumed to have an absorption coefficient of 0.95. The base case consisted of completely covering the ceiling with material having half this absorption coefficient (Le. a=0.47). (This is essentially the same as the optimum reverberation time case for which the ceiling was 50% absorptive). Other cases consisted of covering an area equal to half the area of the ceiling with material with an absorption coefficient of a=O.95. The 9 absorption configurations are described in Table 3. The surface diffusion coefficients were as described in Table I. All untreated areas of the walls and ceiling were gypsum board with properties described in TableI.
·x···35dBA ••.. -40cBA -1l-45cBA ···...····50cBA ...
...
-"' .... )(. ···x )(. '" ?( .. "".,. ..." .... ...-_
-...
....---
-...
.-.,---,.
.
...---"-4 o 2 NLPNG]MMMMMZGNLMMセMMM]]G]]]]、NNNMャ 0.2 0.4 0.6 0.8 ReIIerberationtime. sFigure 4. U,o versUS ceiling absorption, OMN/ source, /000 Hz.
speech intelligibility and combines both the influence of room acoustics (C,o) and speech-to-noise ratio. Thus, the condition that leads to the maximum U,o value will correspond to the maximum speech intelligibility and to the optimum combination of C,o and speech-to-noise ratio. The reverberation time corresponding to this optimum condition is the required optimum reverberation time for speech in the classroom.
The same 5 different absorption coefficients for the ceiling were used as in the previous section, varying from 0.1 to 0.9 in steps of 0.2. These led to 1000 Hz reverberation times of from approximately 0.3 to 0.8 s and the range of
C,o values shown in Figure 3. Using the speech levels calculated by the ODEON program and background noise levels of 35, 40, 45, and 50 dBA, U,o values were calculated. This gave a wide but realistic range of both room acoustics and speech-to-noise conditions. The resulting U,o values are plotted in Figure 4. For the 'reasonably good' case of a 40 dBA ambient noise level, the maximum U,o value corresponds to a 0.48 s reverberation time. However, the optimum reverberation time varies somewhat with the ambient noise level. For noisier conditions more reverberant conditions help increase speech levels and hence improve speech-to-noise ratios. For quieter ambient noise situations, less reverberant conditions lead to maximum U,o values because they correspond to improved room acoustics conditions (I.e. increased C'0)'
One can estimate speech intelligibility scores from U,o
values [8] using the following equation, S/= 98.24+0.86/ (U,oJ - 0.0863 (U,oJ', % (5)
This gives the expected intelligibility on a simple rhyme test where 97% or higher corresponds to excellent conditions for speech. For the 40 dBA ambient noise level case, speech intelligibility scores were estimated from the
U,o values and are plotted in Figure 5. Although the optimum speech intelligibility corresponds to the case of
18-# Description
1 Full ceiling,a - 0.47 2 Front half ceiling,a - 0.95 3 Rear half ceiling,a - 0.95
4 Rear part ceiling and back wall,a - 0.95 5 Ring on ceiling and upper walls,a - 0.95 6 Ring on ceiling, a 0.95
7 Ring on upper walls,a - 0.95 8 Upper side and rear walls,a - 0.95 9 Upper side walls,a - 0.95
Table3. DescriptIOn of9 absorptIOn configuratIOns.
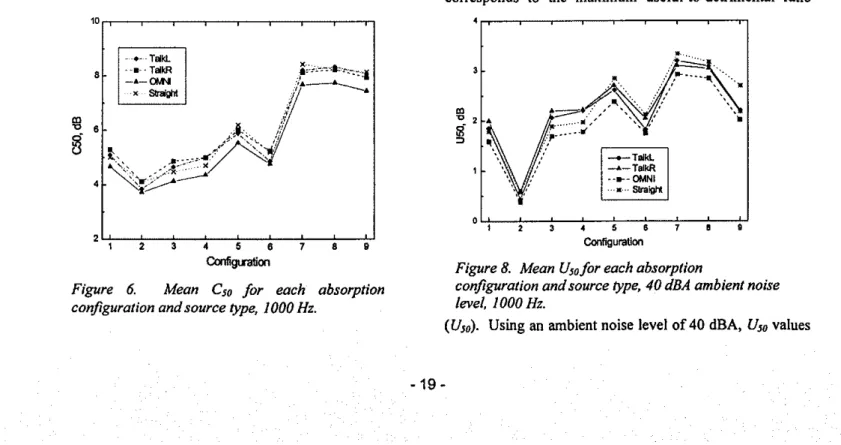
The location of the absorbing material was expected to influence conditions for speech by changing C,o values. The C,o values obtained at the nine receiver positions illustrated in Figure 1 were averaged and these mean values are plotted for each of the nine absorption configurations in Figure 6. Mean C,o values are given for each of the 4 different sound sources described in section 2 above. The results in Figure 6 indicate small differences between the different sources but the same variations occur among the 9 absorption configurations for all sources. For example, the omni-directional source tends to produce C,o values that are a fraction of a decibel lower than the other sources but there are variations of up to 4 dB among the various absorption configurations.
The clarity in the room is maximum when there is an absorptive material on the upper parts of the side and rear walls (condition#8), and results are almost identical when the absorptive treatment is continued to the upper part of the front wall. The most inferior treatment is when the absorption is limited to the front half of the ceiling (i.e. over
QPョMMセMイMMBLイMMLMMMMMイMNLNNNMMLMMLNL r - - - : : - - l
セ
-.-TalkL -.-TalkR ·-.-OMNI ... Straight" '-;---:--c,:--;,--,:--;,---:---:--;"
ConfigurationFigure 7. Mean speech soundpressure level (8PL) for each absorption configuration and source type, 1000Hz.
the source). Treating the rear part of the ceiling and the rear wall (condition 4) was not optimum as recommended by one previous study [9].
Although conditions # 7 and # 8 lead to maximum C,o values, they did not optimise speech sound levels. The corresponding 1000 Hz mean speech sound levels are shown in Figure 7 for the 9 configurations and for all 4 sources. The source type has less effect on sound levels than the small effects on C,o values. Varying the location of the sound absorbing material has a maximum effect on speech sound levels of just under 3 dB. Treating only the rear half of the ceiling (condition # 3) leads to the maximum speech sound level. Conditions#7 and #8 that corresponded to maximum C,o values have sound levels about 1.5 dB lower than the maximum found for condition # 3. Thus, again there is a trade-off between increasing clarity (C,o) and increasing speech levels.
The condition that optimizes both C,o and speech-to-noise ratios can be determined by finding the configuration that corresponds to the maximum useful-lo-detrimental ralio
8 - -.-- TalkL ..•.. TalkR _A_Qt.N x··Striight _-TalkL - . 1 . -TalkR •·.... -OMNI ...•... Slralgtt 2GWMMセMMZMMM[MMセMMZMMセMMM」セセ 2 3 4 5 6 7 8 9 Configt<alion
Figure 6. Mean C,o for each absorption configuration and source type, 1000Hz.
ol[MMMAMMMWMセLZMMッMGMMGセセWMcMッMMMZNAMG
Configuration
Figure8. Mean U,ofor each absorption
configuration and source type, 40 dBA ambient noise level, 1000Hz.
(U,o). Using an ambient noise level of 40 dBA, U,o values
19-- 2019-- 20-were calculated for each configuration and for each source type. These Uso values are shown in Figure 8. Again source type has only a small effect but Usovalues increase by about1.3dB from configuration# I (full ceiling treated) to configuration# 7 (upper part of walls treated).
7.0 Conclusions
By varying the absorption coefficient of the classroom ceiling, it was possible to derive an optimum reverberation time of approximately 0.5 s. This corresponds to the maximum useful-to-detrimental sound ratio(Uso)and hence to the maximum speech intelligibility. Although this corresponds to the maximum speech intelligibility, a range of reverberation times lead to almost the same speech intelligibility. Speech intelligibility is within 0.5% of maximum within the range from at least 0.3 to 0.6 s reverberation tme. Thus it is not important to achieve exactly the optimum 0.5 s reverberation time. The results in Figure 4 show that ambient noise level is a much more important determinant of Uso values and hence speech intelligibility in a classroom. Further, the optimum reverberation time also depends on the ambient noise level and a little more reverberant conditions are helpful in higher noise levels.
The location of added sound absorbing material has different effects on speech clarity (Cso)and speech sound level. Maximum speech clarity(Cso)was obtained with the absorptive treatment on the upper parts of the side and rear walls. Conditions with improved speech clarity (Cso)
tended to have reduced speech sound levels. However, when considering the combined effects in terms of useful-to-detrimental sound ratios(Uso),the configuration with the upper parts of the walls treated produced optimum results. Thus the most effective location of sound absorbing material is to add it to the upper parts of the walls and to add an amount sufficient to produce an occupied 1000 Hz reverberation time of approximately 0.5 s.
The determination of optimum reverberation time and the optimum location of the added sound absorbing material is also influenced by the ambient noise level. However, the location of the absorbing material on the upper parts of the walls would still be appropriate in noisier conditions and so can be more generally recommended. Because these treatments all involved the same total amount of sound absorbing material, there should be little difference in the cost of the various configurations. Thus, the optimum configuration represents an acoustical improvement with no
extra cost.
This is an initial exploratory study that demonstrates that there are possible modest improvements to classroom acoustics. These would correspond to quite small improvements in speech intelligibility but their subjective importance is not known. Further work is required to assess the subjective importance of these changes and to
explore the effects of other parameters. Further studies should include the effects of other room shapes and other possible configurations of absorptive treatments. One could also consider different amounts of added sound absorbing material and include results for a range of frequencies. Future studies should also consider the effect of added absorption on ambient noise levels. The present studies are based on the useful-to-detrimental sound ratio concept and hence incorporate the trade-off between room acoustics and speech-to-noise ratios included in that measure. New studies could repeat this process in terms of speech transmission index (ST!) values to verify that the same conditions are found to be optimum. Finally, the process should be validated by measurements in actual rooms with varied absorption configurations.
The use of computer models such as ODEON is seen to be a convenient method for determining the importance of parameters influencing speech intelligibility in rooms. The combination of such computer model studies and a limited
number of validation measurements in real rooms is a」ッウエセ effective approach for developing better information for designing better classrooms. The resulting improvements in speech intelligibility could translate to more relaxed and accurate communication between students and teachers.
References
I. Bradley, J.S. "Speech Intelligibility Studies in Classrooms", J. Acous!. Soc. Am., vol. 80, pp. 846-854 (1986).
2. Houtgast, T., "The Effect of Ambient Noise on Speech Intelligiblity in Classrooms", App. Acoustics, vol. 14, pp. 15-25 (1981).
3. Knudsen V.O. and Harris, C.M., "Acoustical Design in Architecture", John Wiley, New York (1950). 4. Bradley, J.S., "Predictors of Speech Intelligibility in
Rooms", J. Acous!. Soc. Am., Vol. 80, pp. 837-845, (1986).
5. Lochner, J.P.A. and Burger, J.F., "The Influence of Reflections on Auditorium Acoustics" ,J. Sound Vib., Vol. I, pp. 426-454, (1964).
6. Houtgast, T., and Steeneken, J.M., "A Review of the MTF Concept in Room Acoustics and Its Use for Estimating Speech Intelligibility in Auditoria" , J. Acous!. Soc. Am., Vol. 77, pp. 1069-1077, (1985). 7. Peutz, V.M.A., "Articulation Loss of Consonants as a
Criterion for Speech Transmission in Room" , J. Aud. Eng. Soc., Vol. 19, No. I I, pp. 915-919, (1971). 8.Bradley. J.S., "Uniform Derivation of Optimum
Conditions for Speech in Rooms", National Research Council, Institute for Research in Construction Building Research Note, NRN 239, (November 1985).
!
9. Sala, E. And Vi/janen, V., "Improvement of Acoustic Conditions for Speech Communication in
Classrooms", App. Acoustics, vol. 45, pp. 81-91 (1995).
10. Essman, H., "Der Eintluss raumakusticher Vセイィᄃャエョゥウウ・ in Unterrichtsrfiumen auf den Leistungserfolg bei SchUlem", Wissenschaftliche Zeitschrift der
Technischen Universitfit Dresden, vol. 22, pp. 201-209 (1973).
II. "HBrsamkeit in kleinen bis mittlegrosen Riiumen",
German standard DIN 18041 (1968).
12. Bradley, J.S., "Relationships Among Measures of Speech Intelligibility in Rooms", J, Aud. Eng. Soc, vol. 46, pp. 396-405 (1998).
21
-SOUND
VIBRATION
READINGS!
Scantek has all the latest in high quality sound and vibration Instrumentation. For sale. Or rent. We aiso offer experienced tech-nical support, including instru-ment calibration. For more infor-mation or to place an order, cali the number below, right now. You'll get good vibrations from our service, too.
from
RiOl1:
Vibration Meter VM82 -Easy to use vibration
meter for acceleration,
velocity and
displace-ment measuredisplace-ments.
Sound Level Meter NA-27 - New
generation of precision integrating
:"" sound level meter with 1I3-octave band real-time analyzer.
Integrating Sound Level Meter NL-06 -For environ·
mentalmeasurements. Easy
to read display covers l00dB
dynamic range. Memory card
slot allows effident data management
VibrationLevel MeterVM-52NM-52A-lowfrequency vibration measurements for
a:
flOOr5'9rou.nd and vehicles. The VM-S2A features datastoragebymemory
card.
Vibradon
fa
AnalyzerVA-ll-GセォLNMGBLセ Sophisticated
vibra-('/,,1' tionanalyzer with
,i:i i/ FFT capabihty. Simple
operation.
⦅
ャヲSNo」エ。セZZZイ、rBセ、ュ・5A2915A·30
-"", Simultaneous
anal-,jf' ysisof1/1andlf3-.
octavebands are
possi-' bleforl-ehinputH:h (SA·29).2-eh (SA-30) models and ATAtype
memorycardavailable. Built-in printer for
hard copy display.
Sound and vibration instrumentation and engineering
Call: 301.495.7738
fセクZ 301.495.7739'eMュセャエZウ」セョエ・ォ`・イッャウN」ッュ