HAL Id: pasteur-02567249
https://hal-pasteur.archives-ouvertes.fr/pasteur-02567249
Submitted on 7 May 2020
HAL is a multi-disciplinary open access
archive for the deposit and dissemination of sci-entific research documents, whether they are pub-lished or not. The documents may come from teaching and research institutions in France or abroad, or from public or private research centers.
L’archive ouverte pluridisciplinaire HAL, est destinée au dépôt et à la diffusion de documents scientifiques de niveau recherche, publiés ou non, émanant des établissements d’enseignement et de recherche français ou étrangers, des laboratoires publics ou privés.
structure and evolutionary origin
Virginie Rougeron, Eric Elguero, Céline Arnathau, Beatriz Acuña Hidalgo,
Durand Patrick, Sandrine Houzé, Antoine Berry, Sedigheh Zakeri, Rashidul
Haque, Mohammad Shafiul Alam, et al.
To cite this version:
Virginie Rougeron, Eric Elguero, Céline Arnathau, Beatriz Acuña Hidalgo, Durand Patrick, et al.. Hu-man Plasmodium vivax diversity, population structure and evolutionary origin. PLoS Neglected Trop-ical Diseases, Public Library of Science, 2020, 14 (3), pp.e0008072. �10.1371/journal.pntd.0008072�. �pasteur-02567249�
RESEARCH ARTICLE
Human Plasmodium vivax diversity, population
structure and evolutionary origin
Virginie RougeronID1*, Eric Elguero1, Ce´line Arnathau1, Beatriz Acuña Hidalgo1,
Patrick Durand1, Sandrine Houze2, Antoine Berry3,4, Sedigheh Zakeri5, Rashidul Haque6, Mohammad Shafiul AlamID6, Franc¸ois NostenID7,8, Carlo Severini9, Tamirat Gebru WoldearegaiID10,11,12, Benjamin Mordmu¨ llerID10,11, Peter Gottfried Kremsner10, Lilia Gonza´lez-Cero´ nID13, Gustavo Fontecha14, Dionicia Gamboa15, Lise Musset16, Eric Legrand17, Oscar Noya18, Tepanata Pumpaibool19,20, Pingchai Harnyuttanakorn20,21, Khadijetou Mint Lekweiry22, Musab Mohamad Albsheer23, Muzamil Mahdi Abdel Hamid23,
Ali Ould Mohamed Salem Boukary22,24, Jean-Franc¸ois Trape1, Franc¸ois Renaud1, Franck Prugnolle1
1 Laboratoire MIVEGEC (Universite´ de Montpellier-CNRS-IRD), CREES, Montpellier, France, 2 Service de Parasitologie-mycologie CNR du Paludisme, AP-HP Hoˆpital Bichat, Paris, France, 3 Centre de
Physiopathologie de Toulouse-Purpan (CPTP), Institut National de la Sante´ et de la Recherche Me´dicale (INSERM) UMR1043, CNRS UMR5282, Universite´ de Toulouse Paul Sabatier, F-31300 Toulouse, France,
4 Service de Parasitologie-Mycologie, Institut Fe´de´ratif de Biologie, Centre Hospitalier Universitaire de
Toulouse, F-31300 Toulouse, France, 5 Malaria and Vector Research Group (MVRG), Biotechnology Research Center (BRC), Pasteur Institute of Iran, Tehran, Iran, 6 Emerging Infections & Parasitology Laboratory, icddr,b, Mohakhali, Dhaka, Bangladesh, 7 Centre for Tropical Medicine and Global Health, Oxford, United Kingdom, 8 Shoklo Malaria Research Unit, Mahidol-Oxford Tropical Medicine Research Unit, Faculty of Tropical Medicine, Mahidol University, Mae Sot, Thailand, 9 Department of Infectious Diseases, Istituto Superiore di Sanità, Rome, Italy, 10 Institute of Tropical Medicine, University of Tu¨bingen, Tu¨bingen, Germany, 11 German Centre for Infection Research (DZIF), partner site Tu¨bingen, Tu¨bingen, Germany,
12 Department of Medical Laboratory Sciences, College of Medical and Health Sciences, Haramaya
University, Harar, Ethiopia, 13 Regional Centre of Research in Public Health, National Institute of Public Health, Tapachula, Chiapas, Mexico, 14 Microbiology Research Institute, Universidad Nacional Auto´noma de Honduras, Tegucigalpa, Honduras, 15 Instituto de Medicina Tropical Alexander Von Humboldt, Universidad Peruana Cayetano Heredia, AP, Lima, Peru, 16 Unit, Institut Pasteur de Guyane, BP6010, French Guiana,
17 Malaria Genetic and Resistance Group, Biology of Host-Parasite Interactions Unit, Institut Pasteur, Paris,
France, 18 Centro para Estudios Sobre Malaria, Instituto de Altos Estudios en Salud “Dr. Arnoldo Gabaldo´ n”, Ministerio del Poder Popular para la Salud and Instituto de Medicina Tropical, Universidad Central de Venezuela, Maracay, Caracas, Venezuela, 19 Biomedical Science, Graduate School, Chulalongkorn University, Bangkok, Thailand, 20 Malaria Research Programme, College of Public Health Science, Chulalongkorn University, Bangkok, Thailand, 21 Department of Biology, Faculty of Science, Chulalongkorn University, Bangkok, Thailand, 22 UR-Ge´ nomes et milieux, Faculte´ des Sciences et Techniques, Universite´ de Nouakchott Al-Aasriya, Mauritania, 23 Department of Parasitology and Medical Entomology, Medical Campus, University of Khartoum, Sudan, 24 Aix Marseille Univ, IRD, AP-HM, SSA, VITROME, Marseille, France
*[email protected],[email protected]
Abstract
More than 200 million malaria clinical cases are reported each year due to Plasmodium
vivax, the most widespread Plasmodium species in the world. This species has been
neglected and understudied for a long time, due to its lower mortality in comparison with
Plasmodium falciparum. A renewed interest has emerged in the past decade with the
dis-covery of antimalarial drug resistance and of severe and even fatal human cases. Nonethe-less, today there are still significant gaps in our understanding of the population genetics and evolutionary history of P. vivax, particularly because of a lack of genetic data from
a1111111111 a1111111111 a1111111111 a1111111111 a1111111111 OPEN ACCESS
Citation: Rougeron V, Elguero E, Arnathau C, Acuña Hidalgo B, Durand P, Houze S, et al. (2020) Human Plasmodium vivax diversity, population structure and evolutionary origin. PLoS Negl Trop Dis 14(3): e0008072.https://doi.org/10.1371/ journal.pntd.0008072
Editor: Alyssa E. Barry, Deakin University, AUSTRALIA
Received: March 15, 2019 Accepted: January 18, 2020 Published: March 9, 2020
Copyright:© 2020 Rougeron et al. This is an open access article distributed under the terms of the
Creative Commons Attribution License, which permits unrestricted use, distribution, and reproduction in any medium, provided the original author and source are credited.
Data Availability Statement: All relevant data are within the manuscript and its Supporting Information files.
Funding: Authors thank the ANR Tremplin EVAD 2017, IRD and CNRS-INEE. The funders had no role in study design, data collection and analysis, decision to publish, or preparation of the manuscript.
Competing interests: The authors have declared that no competing interests exist.
Africa. To address these gaps, we genotyped 14 microsatellite loci in 834 samples obtained from 28 locations in 20 countries from around the world. We discuss the worldwide popula-tion genetic structure and diversity and the evolupopula-tionary origin of P. vivax in the world and its introduction into the Americas. This study demonstrates the importance of conducting genome-wide analyses of P. vivax in order to unravel its complex evolutionary history.
Author summary
Among the fivePlasmodium species infecting humans, P. vivax is the most prevalent
para-site outside Africa. To date, there has been less research on this species than for Plasmo-dium falciparum, a more lethal species, principally because of the lack of an in vitro
culture system and also becauseP. vivax is considered relatively benign. Nevertheless, P. vivax is responsible for severe and incapacitating clinical symptoms with significant effects
on human health. The emergence of new drug resistance and the discovery of severe and even fatal cases due toP. vivax question the benign status of P. vivax malaria. In recent
years, there has been increased interest in characterizing the distribution of genetic varia-tion inP. vivax. However, these studies either generated genetic information from a
regional geographic scale or combine genetic datasets generated in different molecular platforms, which is known to generate biased results. In this study, we used a single geno-typing platform to genotype 14 microsatellite markers in 834 samples ofP. vivax obtained
from 28 locations in 20 countries from around the world, including several populations from East and West Africa. We discuss the worldwide population genetic structure and the evolutionary origins ofP. vivax, as well as its introduction into the Americas.
Introduction
Plasmodium parasites are the agents responsible for malaria, one of the worst scourges of
man-kind, with almost 600,000 infant deaths and about 200 million clinical cases reported each year [1]. Among the fivePlasmodium species infecting humans, Plasmodium vivax is the most
prev-alent parasite outside Africa [2]. To date, there has been less research on this species than for
Plasmodium falciparum, a more lethal species, mostly because of the lack of long-term in vitro
culture system and also because it is considered rather benign compared toP. falciparum.
Nev-ertheless,P. vivax is responsible for severe and incapacitating clinical symptoms with
signifi-cant effects on human health [3,4]. Indeed, the periodicity ofP. vivax transmission confers
only transient and low immune protection [5] and relapsing liver stages hinder control and elimination strategies. Infected individuals present regular episodes of fever that may occur each month, leading to delays in education in infected children and to direct economic burden caused by the loss of productivity in infected adults [6]. Moreover, the continual emergence of new therapeutic resistance and the discovery of severe and even fatal cases due toP. vivax
question the benign status of this malaria species [7–10]. Finally, the discovery ofP. vivax
para-site populations able to infect Duffy-negative reticulocytes of humans from Africa and South America [11–15] pushed the malaria community to considerP. vivax as a major public health
issue.
In recent years, due to the importance of understanding the demography of populations, the migration patterns as well as the evolutionary history of the parasite, there has been increased interest in describing the distribution of genetic variation in the globalP. vivax
population. Several studies onP. vivax have been published, from those focusing on a small set
of genetic markers to those describing population genetic structure at the scale of the entire genome (including [16–21]). Although these studies all brought their set of information, none of them was able to describe the relationship and the diversity ofP. vivax populations over the
entire range including East and Western African strains. Among these published studies, only one studied genetic diversity and structure of this pathogen at the worldwide scale [16]. In this study, Koepfli et al. showed thatP. vivax was structured at a global geographic scale and
char-acterized by differences in genetic diversity associated to transmission intensity [16]. This work was based on published genotyping data, associated to the genotyping by their own plat-form of South Asian parasite populations. To ensure the compatibility of the data produced in different laboratories, the authors genotyped a subset of each dataset using their own standard-ized protocol and used these results to reassign alleles where discrepancies were found. Although this is an accepted strategy, differences in sample treatment and genotyping plat-forms can still lead to biased results. It is therefore better to apply the same molecular strategy for all samples studied. Moreover, the study included only limited representation of the para-site isolates across Africa [16]. Indeed, among the 13 countries studied, only one African popu-lation from Sudan and nine samples from different places in Africa obtained from travellers coming back from these regions infected byP. vivax were analysed. The lack of P. vivax genetic
information from the African continent is a major roadblock to a better understanding of the worldwide distribution ofP. vivax genetic diversity, structure and evolutionary history. In this
study, we used a single genotyping platform to genotype 14 microsatellite markers in 834 sam-ples ofP. vivax obtained from 28 locations in 20 countries from around the world, including
several populations from East and West Africa.
Methods
Study sites and
P. vivax isolates collection
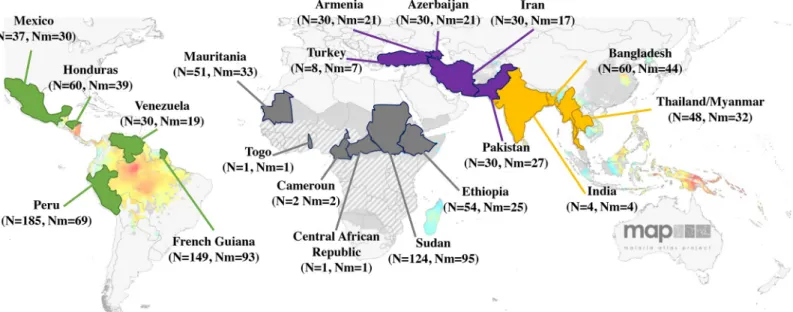
We studied 834P. vivax-infected human blood samples from 28 localities in 20 countries: 233
from Africa (Cameroon, Central African Republic, Ethiopia, Mauritania, Sudan and Togo), 361 from Central and South America (Mexico, Honduras, Venezuela, Peru and French Gui-ana), 128 from the Middle East (Armenia, Azerbaijan, Iran, Pakistan and Turkey) and 112 from Asia (Bangladesh, Laos, India and Thailand) (Fig 1andS1 Table). The two populations sampled in Pakistan being actually close to the Iranian border and the Gulf of Oman, they were attributed to the Middle East instead of the more usual inclusion of Pakistan to Asia. Infected blood samples were collected from symptomatic patients either by venous puncture or by finger-pricks. All blood samples were collected after informed consent and conserved either as dried blood spot or whole blood.P. vivax infections were diagnosed using
micros-copy, PCR and / or RDT. Ethical clearance was obtained from local committees in each coun-try sampled.
Ethic statements
Ethical clearance was obtained from the local ethics committees in each country sampled. The informed consent procedure for the study consisted of a presentation of the aims of the study to the community followed by invitation of adult individuals for enrolment. At the time of sample collection, the purpose and design of the study was explained to each individual and a study information sheet was provided before oral informed consent was collected. Oral con-sent was provided since the study did not precon-sent any harm to subjects and did not involve procedures for which written consent is required. The verbal consent process was consistent with the ethical expectations for each country at the time of enrolment, approved by each
country IRD and the ethics committees approved these procedures. Privacy and confidentiality of the samples data collected were ensured by the anonymization of all samples before the beginning of the study.
Samples from Bangladesh were collected under the protocol # 2008–049 and approved by the IRB: icddr,b Institutional Review Board (Federal Wide Assurance # FWA00001468, Insti-tutional Review Board # IRB00001822 and IRB Organization Regn. # IORG0001386).
For samples from Mauritania, the study received the approval from the paediatric services of the National Hospital, the Cheikh Zayed Hospital and the Direction re´gionaleà l’Action Sanitaire de Nouakchott (DRAS)/Ministry of Health in Mauritania. No ethic approval number obtained at this time. For samples from Comoros, Afghanistan, India, Senegal, Togo, Camer-oon, CAR and Pakistan, no specific consent was required because of, in coordination with Sante´ Publique France organisation for the care and surveillance of malaria, the human clini-cal, epidemiological and biological data were collected in the CNRP database and analysed in accordance with the common public health mission of all French National Reference Centers (https://www.legifrance.gouv.fr/affichTexte.do?cidTexte=JORFTEXT000000810056&date Texte=&categorieLien=id). The study of the biological samples obtained in the medical care context was considered as non-interventional research (article L1221-1.1 of the French public health code) only requiring the non-opposition of the patient during sampling (article L1211-2 of the French public health code). All data collected were anonymized before analyse.
For samples from Ethiopia, this study was approved by the Ethical Clearance Committee of Haramaya University-College of Health and Medical Sciences, and from the Harari and Oro-mia Regional State Health Bureau in Ethiopia.
For samples from Thailand, the blood collection protocol was approved by the ethical com-mittee of the Institute of Health Research, Chulalongkorn University and the Ministry of Pub-lic Health, Thailand (Reference no. 101/2550 and 34/2557). The samples from the Thai-Myanmar border were collected as part of a study approved by both the Mahidol University Faculty of Tropical Medicine Ethics Committee (MUTM 2011–043, TMEC 11–008) and the Oxford Tropical Research Ethics Committee (OXTREC 17–11)
Fig 1. Worldwide samples distribution per country. For each country are indicated the number of samples collected (N) and the number of mono-infected samples (Nm). In yellow are represented Asian countries, in purple the Middle-east countries, in grey African countries and in green American countries. Map adapted from Malaria Atlas Project (MAP), University of Oxford.
For samples from Armenia, Azerbaijan, Iran, Turkey,P. vivax was isolated from patients as
part of routine primary diagnosis and post-treatment follow-up, with no unnecessary invasive procedures. The informed consent of each patient or an adult guardian of children enrolled in this study was obtained at the moment of blood collection and included information that sam-ples would be used to investigate the genetic diversity ofPlasmodium parasites (VIVANIS
project, supported by the COPERNICUS-2 RTD project contract ICA2-CT-2000-10046 of European commission).
The samples from Mexico were obtained by CONACyT-Mexico project CB-2009-01-131247, Pan-American Health Organization (project MEX/07/005015) and the National Insti-tute for Public Health (project CI624). This studies/projects were approved by the Ethics in Research Review Committee of the National Institute of Public Health (Mexico). Informed consent was obtained from all patients or the guardians of minors.
For samples from Honduras, scientific approval and ethical clearance was obtained from the Ethics Review Committee of the Infectious and Zoonotic Diseases Masters Program at UNAH (CEI-MEIZ 02–2014; 5/19/2014). R. Data were analysed anonymously since the study made secondary use of biological specimens originally collected for malaria diagnosis as per standard of care in Honduras.
Concerning the Peruvian samples, the study protocol was approved by both the Ethical Review Committee of the Universidad Peruana Cayetano Heredia and the Institute of Tropical Medicine, Antwerp, Belgium. The research was performed in accordance with the ethical stan-dards of the Peruvian Ministry of Health. The trial has been registered as an International Standard Randomised Controlled Trial, number NCT00373607 athttp://www.clinicaltrials. gov.
For samples collected in Venezuela, each patient gave written informed consent and ethical clearance was obtained from the Comite´ E´tico Cientı´fico del Instituto de Medicina Tropical de la Universidad Central de Venezuela.
All the samples collected in French Guiana and analyzed in this study were from blood col-lections that were required as standard medical care for any patient presenting with a fever on admission to the hospital. According to French legislation (Article L.1211-2 and related, French Public Health Code), biobanking and the secondary use of remaining human clinical samples for scientific purposes is possible if the corresponding patient is informed and has not objected to such use. This requirement was fulfilled for the present study; each patient was informed via the hospital brochure entitled “Information for Patients,” and no immediate or delayed patient opposition was reported to the Malaria NRC by the clinicians.
Microsatellite genotyping
DNA from blood samples was extracted using DNeasy Blood and Tissue kit (Qiagen, France) according to manufacturer’s recommendations, and eluted in 100μl of elution buffer per 200μl of whole blood or per filter plot. For each DNA sample, whole genome amplification was carried out using an Illustra™ GenomiPhi™ V2 DNA Amplification Kit (GE Healthcare, Uppsala, Sweden) following the manufacturer’s instructions. The preparation (DNA + Sample buffer) was denatured by heating at 95˚C for 3 min, and then kept on ice. 9μL of Reaction Buffer (Illustra™ GenomiPhi™ V2 DNA Amplification Kit”—GE Healthcare, Uppsala, Sweden) and 1μL of enzyme Phi 29 was added, and the preparation was incubated at 30˚C for 2 h for genome amplification. The amplification was stopped by placing the samples at 65˚C for 10 min, before being stored at -20˚C. The whole genome amplified DNA was used as template for the PCR-based amplification of 14 polymorphic microsatellite markers distributed among 10 of the 14 chromosomes ofP. vivax. The PCR protocol was adapted from Karunawera et al.
[17] as follow: a 20μl reaction mix was made of 0.3 μl of each primer (10 μM), with the forward being labelled with fluorochrome, 0.1μl template DNA, 0.5 μl dNTP mix (10 pmol/μl), 0.7 μl of MgCl2(50mM), 2.5 of 10X buffer, 0.2μl Taq polymerase (5 UI/μl, Invitrogen).
Amplifica-tions were carried out in a thermal cycler: 40 cycles of denaturation at 94˚C for 30s, annealing temperature of each locus for 1 min at 58˚C and extension at 72˚C for 30s, followed by a final extension at 72˚C for 7 min. The 14 polymorphic microsatellites are located on 10 ofP. vivax’s
14 chromosomes (S2 Table). The reaction products were visualized on a 1.5% agarose gel stained with EZ-vision. Fluorescence-labelled PCR products were sized on Applied Biosystems ABI3500XL (GenSeq platform, Montpellier), with a Genescan 500 LIZ internal size standard. All 834 isolates were genotyped at all 14 loci.
Multiplicity of infections
Blood samples are frequently infected with two or more haploid clones ofP. vivax, resulting in
the detection of two or more alleles at polymorphic loci. Isolates with more than one allele at any of the 14 microsatellite loci were removed from the analysis (Fig 1andS1 Table), leaving 575 samples available for population genetic analyses.
Microsatellite markers under natural selection
Natural selection may impact genetic frequencies differently than demography. We searched for microsatellite loci that could be under positive or balancing selection, using the method developed by Beaumont et al. [22] and implemented in the program LOSITAN [23]. Outliers values of genetic differentiation at specific loci were detected by running coalescent simula-tions to generate the expected distribution of Wright’s inbreeding coefficientFSTas a function
of expected heterozygosity. The distribution ofFSTwas obtained by simulating an island
model with a distribution centred on the empirical estimated average over loci. This average
FSTcannot be assumed to be neutral because (initially unknown) selected loci may be included
in the computation. We ran LOSITAN to determine a subset of candidate selected loci and then removed them for the computation of the neutralFST. A total of 100,000 coalescent
simu-lations were carried out with 95% confidence intervals and a false discovery rate of 0.1. The value obtained is likely to be a better approximation of the neutralFST. The approach is
expected to be robust with respect to variation in mutation rate among loci, sample size, and departure from mutation/drift equilibrium [22].
Population genetic analyses
Genetic diversity was estimated within each population and continent using Nei’s unbiased estimate of expected heterozygosityHs [24]. We also computed the overall allelic richness for each population using the method implemented in the Hierfstat R package [25], which uses a rarefaction method to estimate allelic richness while considering for sample size disparities. Multilocus linkage disequilibrium was estimated for each population using the Agapow and Burt’s rdbar. Weir and Cockerham’s estimates of genetic differentiation were computed in a two-level model with a population effect nested inside a continent effect, using the Hierfstat R package [25]. To test the significance of the between-continentsFSTwe employed a
permuta-tion test. Namely, for each pair of continents, the populapermuta-tions were randomly attributed to the continents and a newFSTcomputed, this process being repeated 500 times. The p-value was
taken as the proportion of simulatedFSThigher than the observedFST. We then investigated
patterns of isolation by distance (IBD) within each continent, by plotting genetic differentia-tionFSTestimates against the geographic distance in kilometres between pairs of populations.
Cameroon and Togo, was not included in the analysis due to the limited sample size and the absence of exact geographic locations. Pairwise geographic distances were computed using MAPINFO (Pitney Bowes). The significance of the relationship was assessed with a Mantel test using 10,000 permutations [26].
Genetic relationships between populations were visualized and assessed using (i) popula-tion trees, (ii) MultiDimensional Scaling (MDS) and (iii) Bayesian clustering methods (STRUCTURE analysis). Neighbour-joining trees with bootstrap resampling (N = 500) and MDS were constructed to examine the relationships betweenP. vivax populations all-over the
world, based on Cavalli-Sforza distances computed between each pair of populations, a dis-tance frequently used to reconstruct trees from population datasets and infer genetic relation-ship between populations [27]. At the population level, MDS was used to visualize the Cavalli-Sforza distance matrix. All these analyses were performed using the R software and specifically the APE package [28] and the ADE4 package [29]. Individuals were finally grouped based on their multi-locus genotypes using the Bayesian clustering method implemented in Structure 2.3.4 version [30]. Several models with possible admixture were run, with the number of clus-ters K ranging from 1 to the number of populations. All simulations used 100,000 Markov-chain Monte Carlo (MCMC) generations in the burn-in phase and 500,000 generations in the dataset collection step. To verify the convergence of the estimates of posterior probabilities, 10 independent runs were performed for each K value.
Results
We discarded samples presenting evidence of multiple infection and ended up with a total of 575 mono-infected isolates from all 28 geographic localities in 20 countries (Fig 1,S1andS3
Tables).
FST
-based test of selection
Analyses of microsatellite markers often assume that they evolve neutrally, so that the distribu-tion of allele frequencies is shaped by mutadistribu-tion, migradistribu-tion and genetic drift. However, because microsatellite loci may themselves be under selection or may be linked to other loci under selection, this assumption should be tested. The LOSITAN program employs coalescent simu-lations to estimate the distributions of heterozygosity andFSTunder the island model. Loci
that do not fit neutral expectations are considered candidates of selection. The analysis of the overall genetic differentiation between populations suggested positive selection at two loci: MS3 and MS6 (S1 Fig). We searched for the position of these two microsatellite loci inP. vivax
genome PvP01 [31] and identified them in two conservedP. vivax proteins of unknown
func-tion (PVP01_0410500 and PVP01_1306500). For these reasons, in the next steps of the analy-sis, we only present the results obtained for a dataset that excludes these two loci (MS3 and MS6) in order to avoid biased and spurious conclusions (S2 Fig).
Genetic diversity and linkage disequilibrium
South East Asian populations present the highest allelic richness (Fig 2A) and genetic diversity (HsAsia = 0.865; HsMiddleEast = 0.788; HsAfrica = 0.820; HsAmerica = 0.820) (Fig 2B) in comparison to the Middle East, African and South American populations. Consistent patterns of allelic richness and expected heterozygosity are observed when considering each locus sepa-rately (S3andS4Figs,S4andS5Tables). Regarding linkage disequilibrium (as estimated by the rDbar), the South East Asian populations present the lowest levels followed by the Middle East, Africa and South American populations (Fig 2C).
Population genetic structure
Both the neighbour-joining tree and the MDS show thatP. vivax populations cluster together
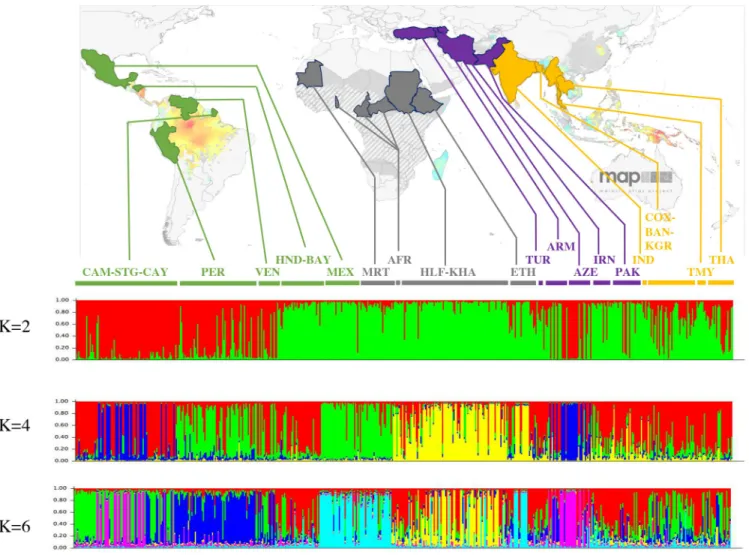
according to geographic origin (Fig 3A and 3B), although we note that many of the clades in the NJ tree have low bootstrap values. For the Asian populations, all populations clustered together, except the Indian one that clustered with the middle east populations (Fig 3A and 3B). All American isolates are regrouped into two clusters, one corresponding to South Ameri-can populations (French Guiana, Peru and Venezuela) and one to Central AmeriAmeri-can popula-tions (Honduras populapopula-tions and Mexico). Based on the Bayesian clustering analysis, the Asian, the Middle East and East African (Ethiopia and Sudan) populations appear to be less structured by country and more diversified, in comparison to American populations (Fig 4). Within the American continent, the MexicanP. vivax population appears to be associated
with the Mauritanian population. Indeed, when considering the Bayesian clustering analysis (under the models with K varying from 4 to 8), Mexico is assigned to the same group as Mauri-tania (Fig 4). Mauritania isolates are also separated from all other African isolates (Fig 4), whereas African isolates from Ethiopia and Sudan appear to be genetically closer to the Middle East and Asian isolates.
Genetic differentiations between continents varied from moderate between African, Asian and American populations (FSTvalues varying between 0.139 and 0.164) to particularly high
between the Middle EastP. vivax populations and the other continents (all FSTvalues > 0.294;
significantFSTwith America) (S6andS7Tables). In Asia/Middle East and South America,
there are patterns of isolation by distance, with genetic differentiation significantly (FST)
increasing with geographic distance between populations (S5 Fig). This pattern was not observed for the African populations.
Discussion
To evaluate the structure, genetic diversity and evolutionary origins ofP. vivax, we genotyped
834P. vivax isolates sampled from across the global range of this parasite species, including
several populations from the African continent. After excluding samples from individuals with multiple infections, genetic analyses were performed on a total of 575 mono-infected isolates from all 28 geographic localities in 20 countries (Fig 1,S1andS3Tables).
Worldwide genetic structure of
P. vivax
Results based on NJ tree, MDS and structure analyses reveals patterns of population genetic structure that are consistent with previous studies (e.g. [16–21]). The South East Asian popula-tions are the most diverse populapopula-tions as measured by allelic richness and genetic diversityHs
and present the lowest levels of multilocus linkage disequilibrium (Fig 2). In contrast, popula-tions from other regions of the world (Middle East, Africa and America) display lower levels of genetic diversity as well as higher levels of linkage disequilibrium (Fig 2).P. vivax populations
are genetically differentiated between continents, with significantly higherFSTvalues for
Mid-dle Eastern populations than for others (S6andS7Tables). Increased differentiation between populations in the Middle East could be explained by the fact that many of the countries in
Fig 2. Overall allelic richness,Hs and rDbar were estimated using all loci for each population. A. Allelic richness
for each continent. B. Hs for each continent. C. rDbar for each continent. Allelic richness,Hs and rDbar were
estimated overall loci for each population. Boxes represent the interquartile range between first and third quartiles and the line inside represents the median of the estimate per population. Points represent outliers beyond the whiskers. The different regions of the world are represented using different colors: South East Asia (in yellow), the Middle East (in purple), Africa (in grey) and America (in green).
this region, including Azerbaijan, are close to elimination ofP. vivax. Such a situation could
lead to a reduced effective population size and limited gene flow, resulting in greater genetic differentiation between local parasite populations within this region in comparison with worldwideP. vivax populations. Within each continent, populations are genetically
differenti-ated and patterns of isolation by distance are observed (S5 Fig), indicating that gene flow mainly occurs between close populations. A high genetic differentiation is observed between East and Western AfricanP. vivax populations (S7 Table), which can be explained by the geo-graphic and ecological separation of these populations limiting migration and gene flow. This could also be due to the fact that these populations were founded separately from different source populations or from the same source at different times. In the Americans, the high genetic differentiation values obtained betweenP. vivax populations from Mexico and the
oth-ers could be explained by multiple factors, such as a low effective population size, some reduced gene flow with the other American populations and/or a different origin compared the other American populations (as discussed in more detail below).
At a worldwide scale, populations tend to group together according to their geographic locations but the relationships between populations of different geographic origins are far less obvious (Figs3and4). Our data indeed provide little information on the inter-continental relationships between populations, certainly because the number of markers that were used in our study is low (12 microsatellite markers) thus limiting our ability to reconstruct the genea-logical relationships between populations of different continents. Several observations can nev-ertheless be noted (although they need to be taken with caution and validated by larger
Fig 3. Worldwide genetic structure of 575P. vivax isolates collected around the world. A. Neighbor-joining tree of isolates based on Cavalli-Sforza distance, with
bootstrap resampling (N = 500); Red and orange dots indicate the bootstrap values, ranging from 0.9 to 1, and from 0.6 to 0.89 respectively. B. MultiDimensional Scaling representation. AFR: Central African Republic + Cameroon + Togo; ARM: Armenia; AZE: Azerbaijan; BAN: Bandarban; BAY: Bay Islands; CAM: Camopi; CAY: Cayenne; COX: Cox’s Bazar; ETH: Ethiopia; HLF: New Halfa; HND: Honduras; IND: India; IRN: Iran; KGR: Khagrachari; KHA: Khartoum; MEX: Mexico; MRT: Mauritania; PAK: Pakistan; PER: Peru; STG: Saint Georges de l’Oyapock; THA: Thailand; TMY: Thailand/Myanmar; TUR: Turkey; VEN: Venezuela. In yellow are represented Asian countries, in purple Middle-east countries, in grey African countries and in green American countries.
datasets): (i) the east African populations seem to be more related to the middle east popula-tions than they are to the western populapopula-tions of Africa (e.g. Mauritania); (ii) some populapopula-tions of America look related to the Asian populations while others (those from central America) look more related to certain African populations.
The variations of genetic diversity and genetic differentiation observed among populations at a worldwide scale are likely the consequence of the history of colonisation of the world byP. vivax as well as the effect of more recent demographic events like population contraction,
expansion or founding events.
P. vivax origin and worldwide spread: “Out of Asia” versus “Out of
Africa”?
Two scenarios have been proposed to explain the origin ofP. vivax and its spread throughout
the world: the “Out of Asia” scenario and the “Out of Africa” scenario. Although these two
Fig 4. Bayesian cluster analysis on 575P. vivax isolates collected around the world, using STRUCTURE software, for K = 2, K = 4 and K = 6. Map
adapted from Malaria Atlas Project (MAP), University of Oxford. AFR: Central African Republic + Cameroon + Togo; ARM: Armenia; AZE: Azerbaijan; BAN: Bandarban; BAY: Bay Islands; CAM: Camopi; CAY: Cayenne; COX: Cox’s Bazar; ETH: Ethiopia; HLF: New Halfa; HND: Honduras; IND: India; IRN: Iran; KGR: Khagrachari; KHA: Khartoum; MEX: Mexico; MRT: Mauritania; PAK: Pakistan; PER: Peru; STG: Saint Gorges de l’Oyapock; THA: Thailand; TMY: Thailand/Myanmar; TUR: Turkey; VEN: Venezuela. In yellow are represented Asian countries, in purple Middle-east countries, in grey African countries and in green American countries.
hypotheses were based on different lines of evidence, the “Out of Africa” hypothesis has enjoyed renewed interest in recent years following the discovery of parasites closely related toP. vivax in
African apes (namedP. vivax-like) and the observation that human P. vivax diversity appears to be
nested within that of theP. vivax-like parasites. This discovery has led some researchers to suggest
that human strains ofP. vivax originated following the transfer of parasites from African great apes
to humans [32,33]. The second element that has been advanced in support of this hypothesis is the absence of circulation ofP. vivax in sub-Saharan human populations, associated to the absence at
the surface of their red blood cells of the Duffy antigen (i.e. Duffy negativity), suggesting that the Duffy-negative mutation was selected a long time ago in response toP. vivax infection [34]. How-ever, several remarks should be made concerning these interpretations. First, the apparent nested relationship between human and non-human strains ofP. vivax was inferred from just a few
nuclear genes and partial mitochondrial genomes and is consistent with several alternative scenar-ios. Indeed, such phylogenetic patterns can also be obtained because of incomplete lineage sorting or because of a lack of phylogenetic signal for the sequences used, two phenomena that are fre-quent when species have recently diverged (which is the case forP. vivax and P. vivax-like). We
recently showed, comparingP. vivax-like genomes to those of P. vivax, that incongruent
phyloge-nies may be obtained when one limits the analyses to a single or a couple of genes [35]. Second, how could we explain an “Out of Africa” origin ofP. vivax, with the high genetic diversity obtained
in current AsianP. vivax parasite populations in comparison to the rest of worldwide P. vivax
para-sites? This pattern of genetic diversity is the opposite forP. falciparum, which has a well-established
African origin [36]. Indeed, for this parasite, the highest genetic diversity is found in Africa and decreases toward Asia, the opposite pattern obtained inP. vivax [36]. Finally, the phylogenetic position ofP. vivax among Plasmodium parasite species infecting mostly wild Asian monkeys
(about fifteen monkey species’) also calls into question the “Out of Africa” hypothesis. If the history of colonisation has been important in shaping the distribution of genetic diversity ofP. vivax at a worldwide scale, then our results based on microsatellite markers,
would be more congruent with an Asian origin and a spread from Asia of the current popula-tions ofP. vivax found worldwide in humans. Genetic diversity and allelic richness are highest
in South-East AsianP. vivax populations and decrease from South East Asia to East Africa (Fig 2A and 2B), with a significant isolation by distance pattern (S5 Fig), suggesting that the source population of humanP. vivax was in Southeast Asia and then spread to Africa following a
step-by-step colonisation process characterized by recurrent bottlenecks during which popula-tions have lost genetic diversity (S5 Fig). Such a scenario could also explain the patterns of link-age disequilibrium observed in the populations (Fig 2C), with the populations which have been founded the most recently displaying the highest levels of linkage.
One may nevertheless advocate that some of these genetic patterns (e.g. the decrease of genetic diversity from Asia to Africa) could also be the consequence of the current differences in population size of theP. vivax populations in the different regions of the world, the largest
population sizes and transmission levels being observed in Asia forP. vivax. This is indeed a
possibility and our genetic data (e.g. a few microsatellite markers) are clearly insufficient to disentangle the impact of recent and ancient demographic events on the distribution ofP. vivax genetic variability. More extensive analyses of the population genetic structure of these
parasites, using whole genome data and some tests of demographic scenarios, might be neces-sary to resolve the origin and evolution of these parasites.
P. vivax evolutionary history in the Americas
Within the Americas, a separation is observed betweenP. vivax populations from South
4). When considering the Bayesian clustering analysis (Fig 4), it seems that South AmericanP. vivax populations are more related to the Asian populations while the Central American P. vivax populations (in particular the Mexican one) appear to be more closely related to some
African populations (the MauritanianP. vivax population), thus suggesting a double origin of P. vivax in America (Asian and African). Moreover, we found that American P. vivax
popula-tions harbour low levels of genetic variation. These results are consistent with a scenario in which AmericanP. vivax populations were introduced from multiple sources. This possibility
of introduction from multiple locations has already been mentioned in several recent studies based on the analysis of different kinds of genetic markers [37,38]. Rodrigues et al. proposed that African and South East AsianP. vivax populations contributed to the current diversity of P. vivax observed in South America [38]. Carter et al. suggested that a large part of the genetic diversity observed today was due to gene flow from Western Pacific to the Americas, which needs to be considered when considering the Australian and Eurasian ancestral origin of three south American native human populations [34]. Gelabert et al. showed based on the mitogen-ome analysis from slides of EuropeanP. vivax dated between 1942 and 1944 that European
iso-lates were closely related to the most common present-day American haplotype [39]. This suggested thatP. vivax likely entered the American continent during the post Columbian
con-tact [39]. To conclude, South AmericanP. vivax parasites seem to be characterized by a recent
history through multiple introductions and the next steps will be to identify the sources of introduction and to date such events.
This study confirmed the worldwide genetic structure ofP. vivax populations. The highest
genetic diversity is again observed in South East AsianP. vivax populations in comparison to
the populations of the rest of the world, which argues again the suggested African origin of current humanP. vivax. Concerning the colonization of the American continent, results
obtained in our study seem to suggest a double origin from Africa (or Europe) and Asia, as already suggested by different studies [34,37–39]. In order to resolve the origin and evolution of these protozoan parasites, more extensive genomic analyses of the genetic diversity and structure ofP. vivax are needed, including the study of ancient European P. vivax strains.
Supporting information
S1 Fig.FSTvalues plotted against heterozygosity (He) and computed using the
microsatel-lite loci dataset with LOSITAN program after 100,000 coalescent simulations. The
micro-satellite markers suspected to be under positive selection (MS3 and MS6) are displayed. Grey: area including 95% of the neutralFSTcomputed using an island model. Red: area including the
highest 5% neutralFST. Yellow: area including the lowest 5% neutralFST.
(PDF)
S2 Fig. Neighbor-joining trees of isolates based on Cavalli-Sforza distance, with bootstrap resampling (N = 500), obtained based on 14 microsatellite markers and on 12 (without MS3 and M6, found under positive selection). Red and orange dots indicate the bootstrap
values, ranging from 0.9 to 1, and from 0.6 to 0.89 respectively. The only difference detectable is that the AFR+MRT cluster is associated to the Central American populations when consid-ering the full microsatellite markers set, whereas it is distinct when getting rid of the two markers detected under positive selection (MS3 and MS6). AFR: Central African Republic + Cameroon + Togo; ARM: Armenia; AZE: Azerbaijan; BAN: Bandarban; BAY: Bay Islands; CAM: Camopi; CAY: Cayenne; COX: Cox’s Bazar; ETH: Ethiopia; HLF: New Halfa; HND: Honduras; IND: India; IRN: Iran; KGR: Khagrachari; KHA: Khartoum; MEX: Mexico; MRT: Mauritania; PAK: Pakistan; PER: Peru; STG: Saint Gorges de l’Oyapock; THA: Thailand; TMY: Thailand/Myanmar; TUR: Turkey; VEN: Venezuela. In yellow are represented Asian
countries, in purple Middle-east countries, in grey African countries and in green American countries.
(PDF)
S3 Fig. Allelic richness for each locus analyzed in Asia (As), Middle East (Me), Africa (Af) and America (Am). In yellow are represented Asian countries, in purple Middle-east
coun-tries, in grey African countries and in green American countries. (PDF)
S4 Fig. Expected heterozygosityHs for each locus analyzed in Asia (As), Middle East (Me),
Africa (Af) and America (Am). In yellow are represented Asian countries, in purple
Middle-east countries, in grey African countries and in green American countries. (PDF)
S5 Fig. Isolation by distance (IBD) with Asian/Middle East and American continents.
Pair-wise geographic along landmasses plotted against pairPair-wise genetic differentiation (FST). A.
Asian/Middle East continent and B. American continent. Mantel tests gaveP-values < 0.05 for
both continents tested. (PDF)
S1 Table. Characteristics of theP. vivax samples with geographic locations, year of
collec-tion, short name attributed for the analysis, geographic coordinates, total sample size and mono-infected sample size. All isolates were genotyped by us for the 14 microsatellite loci.
NA: non-available information. (DOCX)
S2 Table. The 14P. vivax microsatellite loci with marker code, chromosome number in
Salvador-1 strain (and the protein associated code), and size range of the amplified alleles in base pairs. Locations of markers are given according to theP. vivax reference genome
available at the Institute for Genomic Research website (http://www.tigr.ord/tdb/e2k1/ pva1). For markers on the same chromosome, distances are enough to limit any physical
link-age: MS2, MS5 and MS6 are at a minimum at 0.15Mb apart from each others; MS7 and MS8 are 1.14Mb appart; MS12 and MS15 are 1.04Mb appart.
(DOCX)
S3 Table. Microsatellite dataset obtained in this study, with each country, locality, sample ID, year of collection and all genotypes obtained at each locus by PCR. NA: Not available information. For microsatellite genotypes, blank cases correspond to the absence of readable
amplification/genotype. (DOCX)
S4 Table. Number of alleles per locus and population. AFR: Central African Republic
+ Cameroon + Togo; ARM: Armenia; AZE: Azerbaijan; BAN: Bandarban; BAY: Bay Islands; CAM: Camopi; CAY: Cayenne; COX: Cox’s Bazar; ETH: Ethiopia; HLF: New Halfa; HND: Honduras; IND: India; IRN: Iran; KGR: Khagrachari; KHA: Khartoum; MEX: Mexico; MRT: Mauritania; PAK: Pakistan; PER: Peru; STG: Saint Gorges de l’Oyapock; THA: Thailand; TMY: Thailand/Myanmar; TUR: Turkey; VEN: Venezuela.
(DOCX)
S5 Table. Expected heterozygosity (Hs) estimates computed within each population and
for each locus. ARM: Armenia; AZE: Azerbaijan; BAN: Bandarban; BAY: Bay Islands; CAM:
Camopi; CAY: Cayenne; COX: Cox’s Bazar; ETH: Ethiopia; HLF: New Halfa; HND: Hondu-ras; IND: India; IRN: Iran; KGR: Khagrachari; KHA: Khartoum; MEX: Mexico; MRT:
Mauritania; PAK: Pakistan; PER: Peru; STG: Saint Gorges de l’Oyapock; THA: Thailand; TMY: Thailand/Myanmar; TUR: Turkey; VEN: Venezuela.
(DOCX)
S6 Table.FSTvalues between continents, considering pairs of populations andP-values
based on a permutation test are indicated in brackets.�P-value < 0.008 (Bonferroni
correc-tion). (DOCX)
S7 Table.FSTvalues between pairs of populations. All significant values are indicated in bold (p-value < 0.05). AFR: Cantral African Republic + Cameroon + Togo; ARM: Armenia; AZE: Azerbaijan; BAN: Bandabar; BAY: Bay Islands; CAM: Camopi; CAY: Cayenne; COX: Cox’s Bazar; ETH: Ethiopia; HLF: New Halfa; HND: Honduras; IND: India; IRN: Iran; KGR: Kha-grachari; KHA: Khartoum; MEX: Mexico; MRT: Mauritania; PAK: Pakistan; PER: Peru; STG: Saint Georges de l’Oyapock; THA: Thailand; TMY: Thailand/Myanmar; TUR: Turkey; VEN: Venezuela.
(DOCX)
Acknowledgments
Authors thank the two reviewers for their very useful and constructive comments. Authors thank the ANR Tremplin EVAD 2017, IRD and CNRS-INEE.
Author Contributions
Conceptualization: Virginie Rougeron, Franc¸ois Renaud, Franck Prugnolle. Data curation: Virginie Rougeron, Eric Elguero.
Formal analysis: Virginie Rougeron, Eric Elguero, Beatriz Acuña Hidalgo, Franck Prugnolle.
Funding acquisition: Virginie Rougeron. Investigation: Virginie Rougeron.
Methodology: Ce´line Arnathau, Patrick Durand.
Resources: Sandrine Houze, Antoine Berry, Sedigheh Zakeri, Rashidul Haque, Mohammad
Shafiul Alam, Franc¸ois Nosten, Carlo Severini, Tamirat Gebru Woldearegai, Benjamin Mordmu¨ller, Peter Gottfried Kremsner, Lilia Gonza´lez-Cero´n, Gustavo Fontecha, Dionicia Gamboa, Lise Musset, Eric Legrand, Oscar Noya, Tepanata Pumpaibool, Pingchai Harnyut-tanakorn, Khadijetou Mint Lekweiry, Musab Mohamad Albsheer, Muzamil Mahdi Abdel Hamid, Ali Ould Mohamed Salem Boukary, Jean-Franc¸ois Trape.
Supervision: Virginie Rougeron, Franck Prugnolle.
Validation: Virginie Rougeron, Franc¸ois Renaud, Franck Prugnolle.
Writing – original draft: Virginie Rougeron, Franc¸ois Renaud, Franck Prugnolle. Writing – review & editing: Virginie Rougeron, Franc¸ois Renaud, Franck Prugnolle.
References
1. Snow RW, Sartorius B, Kyalo D, Maina J, Amratia P, Mundia CW, et al. The prevalence of Plasmodium falciparum in sub-Saharan Africa since 1900. Nature. 2017; 550: 515–518.https://doi.org/10.1038/ nature24059PMID:29019978
3. Carlton JM, Adams JH, Silva JC, Bidwell SL, Lorenzi H, Caler E, et al. Comparative genomics of the neglected human malaria parasite Plasmodium vivax. Nature. 2008; 455: 757–763.https://doi.org/10. 1038/nature07327PMID:18843361
4. Guerra CA, Howes RE, Patil AP, Gething PW, Van Boeckel TP, Temperley WH, et al. The international limits and population at risk of Plasmodium vivax transmission in 2009. PLoS Negl Trop Dis. 2010; 4: e774.https://doi.org/10.1371/journal.pntd.0000774PMID:20689816
5. Doolan DL, Dobaño C, Baird JK. Acquired immunity to malaria. Clin Microbiol Rev. 2009; 22: 13–36, Table of Contents.https://doi.org/10.1128/CMR.00025-08PMID:19136431
6. Carlton JM, Das A, Escalante AA. Genomics, population genetics and evolutionary history of Plasmo-dium vivax. Adv Parasitol. 2013; 81: 203–222.https://doi.org/10.1016/B978-0-12-407826-0.00005-9 PMID:23384624
7. Rijken MJ, McGready R, Jullien V, Tarning J, Lindegardh N, Phyo AP, et al. Pharmacokinetics of amo-diaquine and desethylamoamo-diaquine in pregnant and postpartum women with Plasmodium vivax malaria. Antimicrob Agents Chemother. 2011; 55: 4338–4342.https://doi.org/10.1128/AAC.00154-11PMID: 21709098
8. Price RN, von Seidlein L, Valecha N, Nosten F, Baird JK, White NJ. Global extent of chloroquine-resis-tant Plasmodium vivax: a systematic review and meta-analysis. Lancet Infect Dis. 2014; 14: 982–991. https://doi.org/10.1016/S1473-3099(14)70855-2PMID:25213732
9. Hawkins VN, Joshi H, Rungsihirunrat K, Na-Bangchang K, Sibley CH. Antifolates can have a role in the treatment of Plasmodium vivax. Trends Parasitol. 2007; 23: 213–222.https://doi.org/10.1016/j.pt.2007. 03.002PMID:17368986
10. Baird JK. Resistance to therapies for infection by Plasmodium vivax. Clin Microbiol Rev. 2009; 22: 508– 534.https://doi.org/10.1128/CMR.00008-09PMID:19597012
11. Abdelraheem MH, Albsheer MMA, Mohamed HS, Amin M, Mahdi Abdel Hamid M. Transmission of Plasmodium vivax in Duffy-negative individuals in central Sudan. Trans R Soc Trop Med Hyg. 2016; 110: 258–260.https://doi.org/10.1093/trstmh/trw014PMID:27076512
12. Carvalho TAA, Queiroz MG, Cardoso GL, Diniz IG, Silva ANLM, Pinto AYN, et al. Plasmodium vivax infection in Anaja´s, State of Para´ : no differential resistance profile among Duffy-negative and Duffy-pos-itive individuals. Malar J. 2012; 11: 430.https://doi.org/10.1186/1475-2875-11-430PMID:23259672
13. Me´nard D, Barnadas C, Bouchier C, Henry-Halldin C, Gray LR, Ratsimbasoa A, et al. Plasmodium vivax clinical malaria is commonly observed in Duffy-negative Malagasy people. Proc Natl Acad Sci U S A. 2010; 107: 5967–5971.https://doi.org/10.1073/pnas.0912496107PMID:20231434
14. Woldearegai TG, Kremsner PG, Kun JFJ, Mordmu¨ller B. Plasmodium vivax malaria in Duffy-negative individuals from Ethiopia. Trans R Soc Trop Med Hyg. 2013; 107: 328–331.https://doi.org/10.1093/ trstmh/trt016PMID:23584375
15. Wurtz N, Mint Lekweiry K, Bogreau H, Pradines B, Rogier C, Ould Mohamed Salem Boukhary A, et al. Vivax malaria in Mauritania includes infection of a Duffy-negative individual. Malar J. 2011; 10: 336. https://doi.org/10.1186/1475-2875-10-336PMID:22050867
16. Koepfli C, Rodrigues PT, Antao T, Orjuela-Sa´nchez P, Van den Eede P, Gamboa D, et al. Plasmodium vivax Diversity and Population Structure across Four Continents. PLoS Negl Trop Dis. 2015; 9: e0003872.https://doi.org/10.1371/journal.pntd.0003872PMID:26125189
17. Karunaweera ND, Ferreira MU, Munasinghe A, Barnwell JW, Collins WE, King CL, et al. Extensive microsatellite diversity in the human malaria parasite Plasmodium vivax. Gene. 2008; 410: 105–112. https://doi.org/10.1016/j.gene.2007.11.022PMID:18226474
18. Gunawardena S, Karunaweera ND, Ferreira MU, Phone-Kyaw M, Pollack RJ, Alifrangis M, et al. Geo-graphic structure of Plasmodium vivax: microsatellite analysis of parasite populations from Sri Lanka, Myanmar, and Ethiopia. Am J Trop Med Hyg. 2010; 82: 235–242.https://doi.org/10.4269/ajtmh.2010. 09-0588PMID:20133999
19. Schousboe ML, Ranjitkar S, Rajakaruna RS, Amerasinghe PH, Konradsen F, Morales F, et al. Global and local genetic diversity at two microsatellite loci in Plasmodium vivax parasites from Asia, Africa and South America. Malar J. 2014; 13: 392.https://doi.org/10.1186/1475-2875-13-392PMID:25277367
20. Iwagami M, Fukumoto M, Hwang S-Y, Kim S-H, Kho W-G, Kano S. Population structure and transmis-sion dynamics of Plasmodium vivax in the Republic of Korea based on microsatellite DNA analysis. PLoS Negl Trop Dis. 2012; 6: e1592.https://doi.org/10.1371/journal.pntd.0001592PMID:22509416
21. Jennison C, Arnott A, Tessier N, Tavul L, Koepfli C, Felger I, et al. Plasmodium vivax populations are more genetically diverse and less structured than sympatric Plasmodium falciparum populations. PLoS Negl Trop Dis. 2015; 9: e0003634.https://doi.org/10.1371/journal.pntd.0003634PMID:25874894
22. Beaumont MA, Nichols RA. Evaluating loci for use in the genetic analysis of population structure. Proc R Soc Lond B Biol Sci. 1996; 263: 1619–1626.https://doi.org/10.1098/rspb.1996.0237
23. Antao T, Lopes A, Lopes RJ, Beja-Pereira A, Luikart G. LOSITAN: a workbench to detect molecular adaptation based on a Fst-outlier method. BMC Bioinformatics. 2008; 9: 323.https://doi.org/10.1186/ 1471-2105-9-323PMID:18662398
24. Nei M, Chesser RK. Estimation of fixation indices and gene diversities. Ann Hum Genet. 1983; 47: 253– 259.https://doi.org/10.1111/j.1469-1809.1983.tb00993.xPMID:6614868
25. Goudet J. hierfstat, a package for r to compute and test hierarchical F-statistics. Mol Ecol Notes. 2005; 5: 184–186.https://doi.org/10.1111/j.1471-8286.2004.00828.x
26. Mantel N. The Detection of Disease Clustering and a Generalized Regression Approach. Cancer Res. 1967; 27: 209–220. PMID:6018555
27. Cavalli-Sforza LL, Edwards AW. Phylogenetic analysis. Models and estimation procedures. Am J Hum Genet. 1967; 19: 233–257. PMID:6026583
28. Paradis E, Schliep K. ape 5.0: an environment for modern phylogenetics and evolutionary analyses in R. Bioinformatics. 2019; 35: 526–528.https://doi.org/10.1093/bioinformatics/bty633PMID:30016406
29. Dray S, Dufour A-B. The ade4 Package: Implementing the Duality Diagram for Ecologists. J Stat Softw. 2007; 22: 1–20.https://doi.org/10.18637/jss.v022.i04
30. Pritchard JK, Stephens M, Donnelly P. Inference of population structure using multilocus genotype data. Genetics. 2000; 155: 945–959. PMID:10835412
31. Auburn S, Bo¨hme U, Steinbiss S, Trimarsanto H, Hostetler J, Sanders M, et al. A new Plasmodium vivax reference sequence with improved assembly of the subtelomeres reveals an abundance of pir genes. Wellcome Open Res. 2016; 1: 4.https://doi.org/10.12688/wellcomeopenres.9876.1PMID: 28008421
32. Liu W, Li Y, Shaw KS, Learn GH, Plenderleith LJ, Malenke JA, et al. African origin of the malaria para-site Plasmodium vivax. Nat Commun. 2014; 5: 3346.https://doi.org/10.1038/ncomms4346PMID: 24557500
33. Loy DE, Liu W, Li Y, Learn GH, Plenderleith LJ, Sundararaman SA, et al. Out of Africa: origins and evo-lution of the human malaria parasites Plasmodium falciparum and Plasmodium vivax. Int J Parasitol. 2017; 47: 87–97.https://doi.org/10.1016/j.ijpara.2016.05.008PMID:27381764
34. Carter R, Mendis KN. Evolutionary and historical aspects of the burden of malaria. Clin Microbiol Rev. 2002; 15: 564–594.https://doi.org/10.1128/CMR.15.4.564-594.2002PMID:12364370
35. Gilabert A, Otto TD, Rutledge GG, Franzon B, Ollomo B, Arnathau C, et al. Plasmodium vivax-like genome sequences shed new insights into Plasmodium vivax biology and evolution. PLoS Biol. 2018; 16: e2006035.https://doi.org/10.1371/journal.pbio.2006035PMID:30142149
36. Tanabe K, Mita T, Jombart T, Eriksson A, Horibe S, Palacpac N, et al. Plasmodium falciparum accom-panied the human expansion out of Africa. Curr Biol CB. 2010; 20: 1283–1289.https://doi.org/10.1016/ j.cub.2010.05.053PMID:20656209
37. de Oliveira TC, Rodrigues PT, Menezes MJ, Gonc¸alves-Lopes RM, Bastos MS, Lima NF, et al. Genome-wide diversity and differentiation in New World populations of the human malaria parasite Plasmodium vivax. PLoS Negl Trop Dis. 2017; 11: e0005824.https://doi.org/10.1371/journal.pntd. 0005824PMID:28759591
38. Rodrigues PT, Valdivia HO, de Oliveira TC, Alves JMP, Duarte AMRC, Cerutti-Junior C, et al. Human migration and the spread of malaria parasites to the New World. Sci Rep. 2018; 8: 1993.https://doi.org/ 10.1038/s41598-018-19554-0PMID:29386521
39. Gelabert P, Sandoval-Velasco M, Olalde I, Fregel R, Rieux A, Escosa R, et al. Mitochondrial DNA from the eradicated European Plasmodium vivax and P. falciparum from 70-year-old slides from the Ebro Delta in Spain. Proc Natl Acad Sci U S A. 2016; 113: 11495–11500.https://doi.org/10.1073/pnas. 1611017113PMID:27671660