A Catalog of New Eclipsing Binaries in the
Kepler Database
by
Michael Christopher Kotson
Submitted to the Department of Physics
JW'SACHU
L 1P1
in partial fulfillment of the requirements for the degree of
Bachelor of Science in Physics
at the
MASSACHUSETTS INSTITUTE OF TECHNOLOGY
June 2012
©
Massachusetts Institute of Technology 2012. All rights reserved.
A
Author ...
Department of Physics May 17, 2012Certified by...
Saul A. Rappaport Professor Emeritus Thesis SupervisorA Catalog of New Eclipsing Binaries in the
Kepler Database
by
Michael Christopher Kotson
Submitted to the Department of Physics on May 17, 2012, in partial fulfillment of the
requirements for the degree of Bachelor of Science in Physics
Abstract
In this thesis, we present a catalog of binary stars discovered in the publicly available
Kepler database, none of which were included in previous such catalogs published
by the Kepler science team. A brief review of other binary star catalogs is given,
including the Prsa et al. catalog on which we are expanding. We detail the means
by which the Kepler data were downloaded and reduced to produce light curves, and
we explain the FFT selection algorithm and visual inspections which were used to find new candidates for binary systems. Finally, the classifications by which these candidates were sorted are explained in full, and the binary catalog itself is presented as Appendix A. In all, we found 173 new binary systems not listed in the Kepler team's binary catalog of 2,176 systems. We were also able to successfully find ~1,400 of the 2,074 binary stars which the Kepler team had identified and which were available in the public Kepler data release, thereby providing some indication of the efficiency of our search. Further appendices list RR Lyrae type stars found during the research and peculiar objects of interest which may merit further study.
Thesis Supervisor: Saul A. Rappaport Title: Professor Emeritus
Acknowledgments
The author would like to extend his thanks to Dr. Robert Szabo of the Konkoly Ob-servatory in Budapest, Hungary, for his help in identifying a few of the more unusual light curves we encountered during this study. We are also grateful to Dr. Katrien Kolenberg of Harvard and Dr. Gerald Handler of the Copernicus Astronomical Center in Poland for providing similar help. Dr. Handler also helped us in our study of KIC
7740983, and in particular, with the evolution of the folded light curves as a function
of time. The object is discussed in Appendix C. And of course, the author extends his deepest gratitude to Dr. Alan Levine and Prof. Saul Rappaport for welcoming him on to their team and directing this research. Prof. Rappaport's assistance in compiling and revising this thesis is especially appreciated.
Contents
1 Introduction 17
1.1 Binary Stars and Catalogs . . . . 17
1.2 The K epler M ission ... ... .. 20
1.2.1 T he Satellite . . . . 20
1.2.2 Prsa's Catalog . . . . 21
2 Data Reduction and Processing 25 2.1 Data Download and Description . . . . 25
2.2 Data Reduction and Transformation . . . . 26
2.3 Analysis and Candidate Determination . . . . 28
2.3.1 The FFT Selection Algorithm . . . . 28
2.3.2 Automation and Output . . . . 29
2.3.3 Visual Inspection . . . . 30
2.3.4 Phase-Folding Analysis . . . . 35
3 Searching for EBs and Other Interesting Systems 37 3.1 Binary Stars . . . . 38
3.1.1 Parameters of Binary Stars . . . . 38
3.1.2 Detached Binaries . . . . 41
3.1.3 Semi-Detached Binaries . . . . 42
3.1.4 Overcontact Binaries . . . . 42
3.1.5 Ellipsoidal Light Variables . . . . 45
3.3 Sub-Giants with Solar-Like Oscillations . . . . 48
A The Catalog of New Eclipsing Binaries in the Kepler Database 51
B A Catalog of RR Lyrae Stars Found in the Kepler Database 61
List of Figures
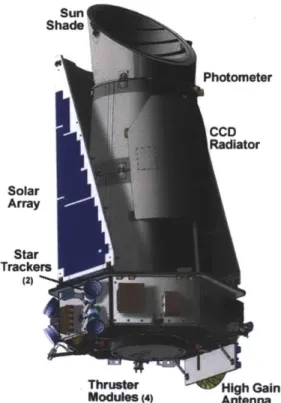
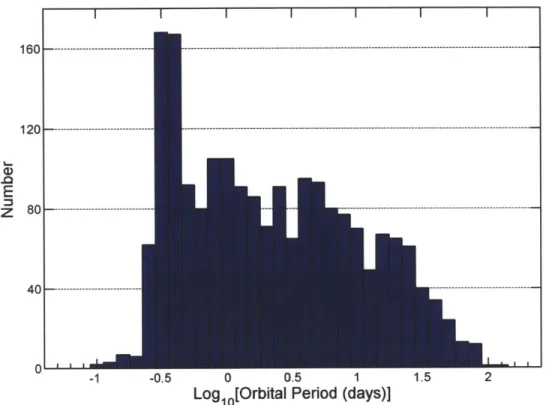
1-1 The distribution of Kepler planetary candidates by orbital period, us-ing the catalog provided by Batalha et al., 2012. . . . . 21 1-2 An artist's conception of the Kepler Spacecraft, including illustrations
of its photometer. (Image courtesy of NASA's Kepler Quick Guide.) . 22
1-3 The field of view of the Kepler satellite, courtesy of the MAST Archive.
The 42 rectangles show how Kepler's 42 CCDs are arranged in the focal p lan e. . . . . 23
1-4 The distribution of orbital periods among the objects listed in the most recent Kepler binary star catalog. . . . . 24
2-1 An illustrative 4-panel plot of the light curve and FFT for KIC 4281068. The panels are (counter-clockwise from the upper left): (i) the raw
Ke-pler data (flux vs. time), (ii) the corrected flux, (iii) the low frequency
portion of the FFT, and (iv) the entire FFT (up to the Nyquist limit of ~25 cycles/day). The pattern of peaks in the FFT is clearly repre-sentative of an EB. The two "glitches: in the data at days 15 and 82 were due to "safeholds" of the satellite and are therefore instrumental
in origin . . . . 31
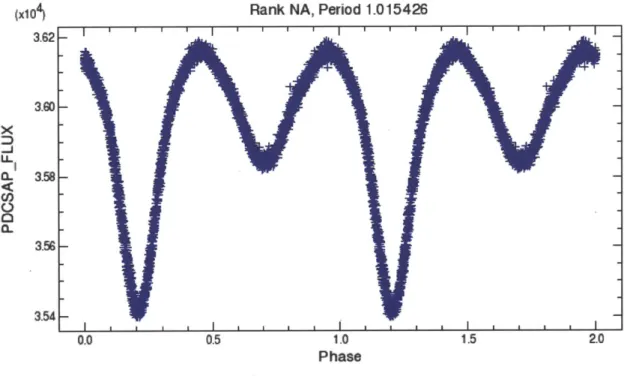
2-2 The light curve of KIC 4281068 phase-folded about the orbital period
1.015 days. The primary and secondary eclipses are clearly visible,
showing that this system is an EB. It is likely that these two stars are orbiting each other essentially in Roche lobe contact. . . . . 33
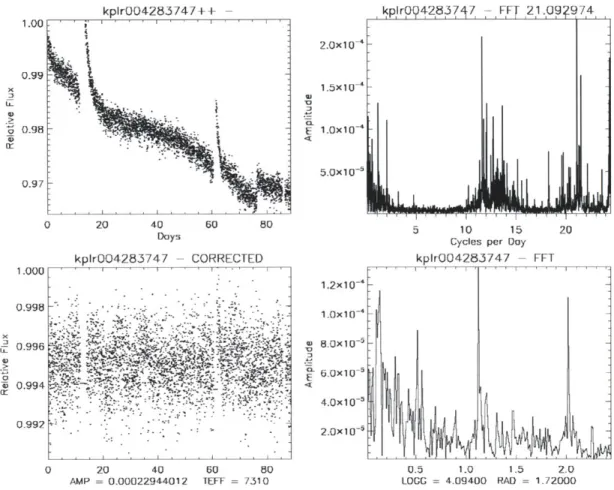
2-3 The light curve and FFT of KIC 4283747, which passed the FFT
selec-tion algorithm, but only as a false positive. The FFT is chaotic, which allowed it to exhibit one or more accidental "harmonic pairs" among its many significant peaks. Note the temperature of the star is -7,300
K, making this a likely 8-Scuti pulsator. . . . . 34
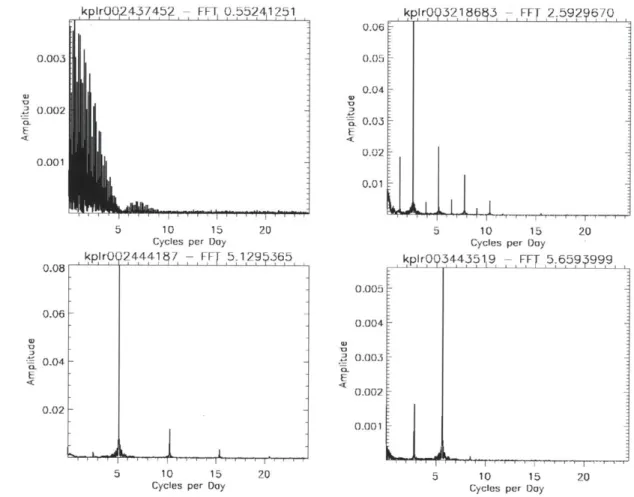
3-1 These sample FFT patterns illustrate the following (clockwise from
upper left): (i) the dense envelope of peaks representative of a detached
(D) binary with a long period; (ii) the harmonic pattern with a clear
peak at the base frequency seen in most semi-detached (SD) binaries (here, the peak at the first harmonic is larger than that at the base frequency); (iii) the harmonic pattern with a barely discernable base frequency peak of an overcontact (OC) binary; and (iv) the FFT of an ellipsoidal light variable (ELV), with a single dominant peak at twice the base frequency and few harmonics. . . . . 39
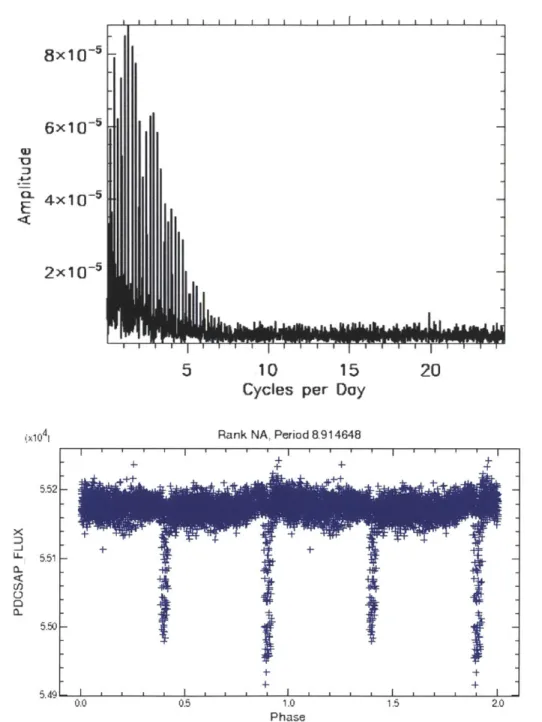
3-2 The detached binary KIC 8589731. Top: The FFT of the star's light
curve, which demonstrates the representative pattern of detached bi-naries. Bottom: When the light curve is folded about a period of 8.915 days, the primary and secondary eclipses of this system are clearly vis-ible, even though their depth is only one part in 500. The modulation that is seen in the out-of-eclipse region is likely due to sunspots on one or both stars. . . . . 43
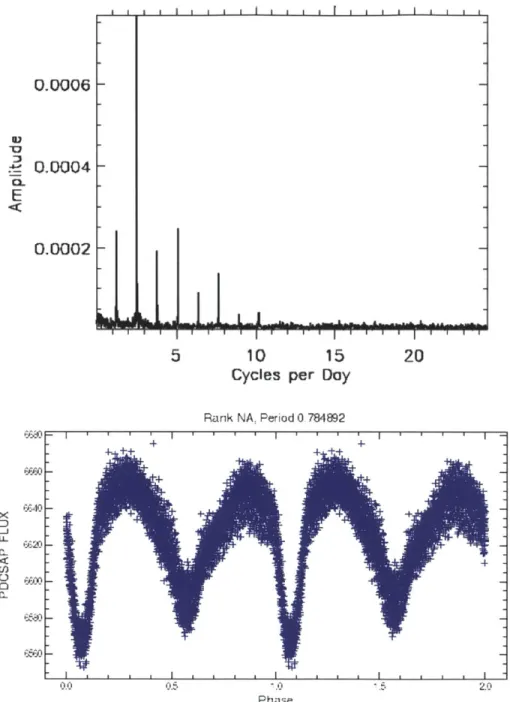
3-3 The semi-detached binary KIC 9935242. Top: The FFT of the star's
light curve, which demonstrates the representative pattern of semi-detached binaries. Bottom: When the light curve is folded about a period of 0.785 days, the primary and secondary eclipses and out-of-eclipse variations are clearly visible. . . . . 44
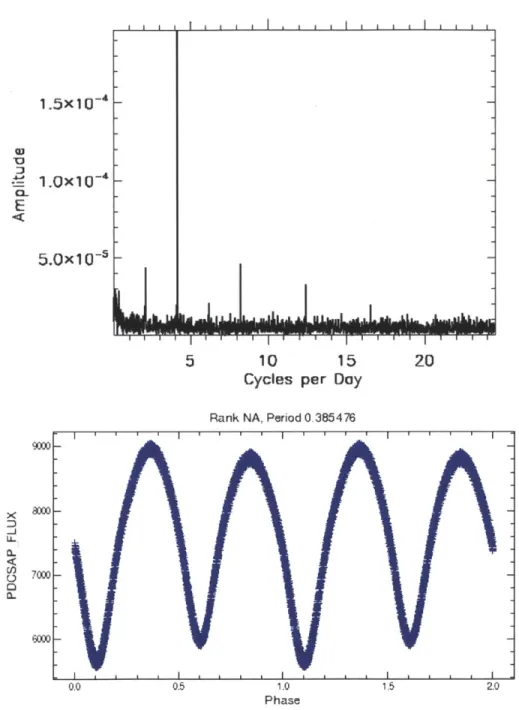
3-4 The overcontact binary KIC 4859432. Top: The FFT of the star's light curve, which demonstrates the representative pattern of eclipsing binaries. Bottom: when the light curve is folded about a period of
0.385 days, the near-sinusoidal variation of the over-contact system is
evident. . . . . 46
3-5 The ELV binary KIC 7900367. Top: The FFT of the star's light curve,
which contains only two significant peaks, one at the base frequency and a larger one at its first harmonic. Bottom: Phase-folding the light curve at twice the system's orbital frequency produces this sharp-featured, nearly sinusoidal curve, which is representative of ELV binaries. 47
3-6 The RR Lyrae type of pulsating star KIC 6763132. Top: The equally spaced pattern of significant peaks in this FFT are reminiscent of D or
SD binaries, making it easy to mistake RR Lyrae stars for EBs given
only this information. Bottom: When phase-folded about the period of pulsation, the short dips followed by sudden and dramatic rises in brightness of an RR Lyrae star are very distinctive. . . . . 49
3-7 Example FFTs of sub-giant pulsators. Top: KIC 1027337 follows the
i/f envelope expected of these sub-giants with solar-like oscillations,
with a cluster of peaks near 6 cycles/day. Bottom: KIC 9873127 is a similar sub-giant, but with its cluster of peaks appearing at a much higher frequency, near 18 cycles/day. . . . . 50
A-i The distribution among orbital periods of the Kepler targets classified
as "new" binaries by this research. . . . . 52
B-i The distribution among pulsation periods of the RR Lyrae type stars found in this research. Note that the range of this distribution is less than 0.3 days. . . . . 63
C-1 KIC 8263752. An additional example of a D binary, the orbital period
C-2 KIC 9851142. Another D binary, but of particular note because of
its flat-bottomed secondary eclipse and clear orbital eccentricity. The secondary star of this system is hypothesized to be a low-mass M or K star. ... ... .... .68
C-3 KIC 12367017. A third D binary, the eclipses of which have relatively
small amplitudes when compared to the out-of-eclipse sunspot varia-tion and S/N levels. . . . . 69
C-4 KIC 4377638. An example of an eccentric SD system with large ELV am plitudes. . . . . 70
C-5 KIC 11671429. This is a D binary with an orbital period of -112 days.
Only one eclipse was visible in the Q2 data, so multiple quarters had to be concatenated to fully study this object Were it included, this would be the second longest orbital period of all the binaries in the Prsa et al. catalog. . . . . 71
C-6 KIC 8759967. This strange "double-M" object has a light curve with
a very odd modulation pattern and has been exceedingly difficult to classify. It could be a pulsator or a binary, but no certain label can be assigned without further observation. . . . . 72
C-7 KIC 7740983. Careful inspection of the FFT (left) reveals three
sepa-rate base frequencies, each with a corresponding set of harmonics. We have determined that the three independent periods are 3.36, 0.403, and 0.519 days. Spectroscopic observations suggest the target is a low-mass M star, but whether the modulations are due to pulsations or eclipses is still uncertain. The sequence of phase-folds (right) was prepared by Gerald Handler of the Copernicus Astronomical Center. . 73
C-8 KIC 12557548. This object was discovered via the FFT selection
algo-rithm and has been extensively reviewed by our team. Eclipses which vary in depth occur every 15.685 hours, and we hypothesize the cause of these events to be the occultation a super-mercury planet which is evaporating via dust [Rappaport et al., in press]. Clockwise from the top left, these plots show (i) the discovery FFT which was produced for this object by the selection algorithm, (ii) a phase-fold about 15.685 hours to highlight the eclipse, and (iii) the long-term light curve of this target. . . . . 74
List of Tables
2.1 Utilized Data Fields of Kepler FITS . . . . 26 A.1 Catalog of Eclipsing Binaries . . . . 53
Chapter 1
Introduction
1.1
Binary Stars and Catalogs
Of the various methods used to determine the physical parameters of stars, such as
their masses and radii, the study of light curves produced by observations of eclipsing binary systems is exceptionally straightforward and direct. And because knowledge of these physical parameters is crucial to determining distances and the theoretical development of stellar evolution, any catalog which lists examples of these eclipsing binary systems would prove to be a worthwhile astrophysical tool.
A binary system consists of two stars - the more massive star is usually called the "primary" and its partner the "secondary" - orbiting about their common center of mass. In the special case where the line of sight to the system lies roughly in the system's orbital plane, each star will periodically block some or all of the light from its companion star from reaching the observer; such stars comprise what is known as an eclipsing binary (EB) system. By combining photometric and spectroscopic observations (to produce light curves and radial-velocity curves, respectively), it is possible to accurately determine the masses, radii, and luminosities of each com-ponent star of an eclipsing binary, which facilitates studies of stellar structure and evolution [Andersen, 1991]. The same physical parameters, in principle, can be used to determine the distance to an eclipsing binary by comparing the luminosity of each star to its apparent brightness. Applications of this method have allowed distances to
neighboring galaxies to be determined to an impressive 5% accuracy [Bonanos, 2006]. Several catalogs of binary systems have been compiled to aid astronomical studies. The first were created in the late 18th Century by William Herschel, who observed
and published catalogs of approximately 700 double stars (stars which are seen near to each other in the sky). A number of these stars were later determined to be bound physical binary systems via astrometric studies
[Heintz,
1978]. More modernefforts include the Washington Double Star Catalogi, an ongoing project of the US Naval Observatory which has measured the separations, magnitudes, spectral types, and proper motions of 115,769 systems; the Budding et al. "Catalogue of Algol-type binary stars"2, which provides information on 411 semi-detached binary stars and was last updated in 2004; and the 1980 Brancewicz and Dworak "Catalogue of Parameters for Eclipsing Binaries"', which contains the physical and geometric parameters of 1048 eclipsing binaries. Furthermore, the General Catalog of Variable Stars (GCVS)4, which is a reference source of all presently known variable stars, also
contains many binaries in its catalog of ~46,000 systems5.
Also, many catalogs of extragalactic EBs have been constructed to aid distance measurements. Most notable are the catalogs constructed as byproducts of gravi-tational microlensing surveys of the Large and Small Magellanic Clouds (LMC and
SMC). While searching for evidence of massive compact halo objects, projects such
as the Microlensing Observations in Astrophysics experiments and OGLE-II Project have discovered a total of approximately 1300 EBs in the SMC and 2500 in the LMC; the MACHO project has revealed an additional 2000 binaries in the LMC [Bonanos,
2006].
Projects intended to search for exoplanets have also found some success in cat-aloging binary stars. These include the ground-based SuperWASP mission, which has so far identified at least 53 binaries [Norton et al., 2011], and the satellite-based CoRoT mission, which has published its own light curve studies of binaries discovered
ihttp: //www .usno .navy.mil/USNO/astrometry/optical-IR-prod/wds/WDS
2
http: //vizier. cf a.harvard. edu/viz-bin/ftp-index?J/A+A/417/263
3
http: //vizier. cf a.harvard. edu/viz-bin/ftp-index?II/150A
4
http: //heasarc .gsfc .nasa. gov/W3Browse/all/gcvs .html 5
in its field of view [Maciel et al.].
Note that all of these catalogs arose from studies which were not originally in-tended to discover EBs. Any collection of precise time-series photometric data on a field of stars can be used to search for new binaries and construct such a catalog. This includes the light curves released by the Kepler mission, which was launched with the purpose of discovering Earth-like exoplanets but nonetheless provides all the resources necessary to identify and classify binary systems.
While the lists above may seem to imply that binary systems are well-monitored and further catalogs are unnecessary, none of these projects had photometric preci-sion nearly as high as those available from the Kepler mispreci-sion. The unprecedented photometric precision of the Kepler detectors (measured in 10-100 parts per million) above the Earth's scintillating atmosphere have provided an incredible opportunity to further study the light curves of binary star systems with previously unattainable accuracy. For this reason, a collection of binary star classifications and measurements derived from the available Kepler light curves should provide an invaluable addition to the study of binary systems.
This work is meant to expand upon one such catalog, initially published by Andrej Prea and the Kepler team in February 2011 [Prsa et al., 2011] and developed further in November of the same year [Slawson et al., 2011]. Specifically, by combining a selection algorithm based on Fourier transformations of Kepler light curves with a follow-up visual inspection of the phase-folded light curves, this catalog has been created to identify EB systems which were missed by the Prsa et al. study.
In chapter two of this thesis, we detail the methods by which the Kepler data were prepared for inspection in Fourier space, as well as the qualifications used to identify periodically variable systems.
Chapter three describes and provides illustrative examples of the different searches which were performed to find new EB candidates, including searches for non-EB sys-tems which were nonetheless interesting and could possibly merit further investiga-tion.
iden-tifying Kepler Input Catalog ("KIC") numbers, periods, radii, temperatures, and ten-tative classifications of all confirmed binary systems. Appendix B provides a similar catalog for RR Lyrae type stars we have identified in the Kepler data, and Appendix
C contains figures illustrating some other interesting objects which were encountered
during this study.
1.2
The Kepler Mission
NASA's Kepler satellite was launched on 6 March, 2009, with the stated goal of identifying planets (especially those with Earth-like properties) in orbit around other stars in the Milky Way6. The method by which Kepler detects an exoplanet is entirely photometric: when a planet passes in front of its host star and the observer, it blocks a portion of the star's light, and this "transit" event is evident as a dip in the star's brightness7. This is closely related to the means by which EB systems are detected, so the light curves released by the Kepler mission can serve the additional purpose of EB discovery.
The search for planets by the Kepler team has so far produced 2,321 planet can-didates around 1,790 separate stars according to Batalha et al., 2012'. Figure 1-1 shows how these planet candidates are distributed by orbital period.
1.2.1
The Satellite
The Kepler satellite (see Figure 1-2, from the Kepler Quick Guide9
)
occupies an Earth-trailing heliocentric orbit so as to allow near-continuous observation of the same field in Cygnus-Lyra (see Figure 1-3, from the MAST Archive10). This field covers a large 100 square degrees of the sky containing well over 100,000 stars above 1 6th magnitude, the light from which is captured by a 1.4 meter primary mirror anda total of 95 mega pixels spread among 42 CCDs.
6
http: //www .nasa. gov/mission\_pages/kepler/launch/index.html
7
http: //kepler .nasa.gov/Mission/QuickGuide/
8
http://archive. stsci .edu/kepler/planetcandidates .html
9
http://kepler.nasa.gov/Mission/QuickGuide/
200 1606---120 - ---80 ---40 ---0 -0.5 0 0.5 1 1.5 2 2.5
Logl
0[Orbital Period (days)]
Figure 1-1: the catalog
The distribution of Kepler planetary candidates by orbital period, using provided by Batalha et al., 2012.
Kepler's original intended lifetime was 3.5 years, though the mission has recently
been extended beyond that. Its operation is only interrupted for data downlinks (monthly) and 90 degree rotations every three months to keep its solar arrays pointed toward the sun. It is able to observe stars between 8th and 1 6th magnitude to the
precision necessary to detect transits of Earth-sized planets, which often produce decreases in flux of less than 0.1% or even 0.01%.
1.2.2
Prsa's Catalog
The Kepler team led by Andrej Prea has published a catalog of 2165 EB systems discovered in the Quarter 2 (Q2) Kepler data [Slawson et al., 2011], expanding upon their previous catalog of 1879 systems [Prsa et al., 2011]. Among other parameters,
-o
E
Z
I I I
Solar Array
Star
Trackers
12)
Thruster igh Gain
Modules (4) Antenna
Figure 1-2: An artist's conception of the Kepler Spacecraft, including illustrations of
its photometer. (Image courtesy of NASA's Kepler Quick Guide.)
this catalog lists the period, effective temperature, B-V color, and some orbital pa-rameters of each identified system. Furthermore, most systems are classified by the separation of the constituent stars relative to their radii, from over-contact (OC), to
semi-detached (SD), to detached (D). Prea also identifies binary systems in which
there are no eclipses, but which are thought to be binary because of the so-called
"ellipsoidal light variations" (ELV) caused by their gravitational interaction.
Our preliminary searches through the same Q2 data revealed a number of clear EB
systems which were not included in the catalog. These objects have been classified, to the best of the author's ability, according to the same scheme used by Prsa et al.
The catalog constructed in this thesis, therefore, is an attempt to modestly expand upon and clarify the work conducted by Prea, so the two catalogs can be considered
together as a somewhat more complete and accurate list of EB systems in the Kepler field of view.
Figure 1-3: The field of view of the Kepler satellite, courtesy of the MAST Archive. The 42 rectangles show how Kepler's 42 CCDs are arranged in the focal plane.
80---
40---' ' '
-1 -0.5 0 0.5 1
Logl0[Orbital Period (days)]
Figure 1-4: The distribution of orbital periods among the recent Kepler binary star catalog.
objects listed in the most
160|--- 1200--- .-E z 0 1.5 2 --- - ---I i
Chapter 2
Data Reduction and Processing
This chapter will detail the means by which the light curve data were obtained from the Kepler database and the methods of reduction used to correct unphysical trends in these data and convert them into a more usable form. In addition, the procedure that was followed to detect the harmonics expected in the light curves of binary or planetary systems will be thoroughly described. This technique succeeded in ana-lyzing ~160,000 Kepler targets and producing summary plots of 4,674 candidates as potential eclipsing binaries. As we shall see, this number still includes a large number of false positives (for reasons to be explained). Chapter 3 will describe the search
performed on this shortened list of light curves to identify objects of interest.
All computations were performed using the IDL programming language.
2.1
Data Download and Description
All light curve data were downloaded in FITS format from the Quarter 2 publicly
released data available at the Multimission Archive at STScI (MAST)1 as of Septem-ber 2010. At the time of its initial release, this set contained data from -160,000 stars and star systems observed between 20 June and 16 September 2009 (an 88-day interval). As reserved targets have become public, the number of available FITS files has increased slightly.
Table 2.1: Utilized Data Fields of Kepler FITS Data Field Description
BARYTIME Barycentric corrected, reduced Julian day APRAWFLUX Aperture photometry "uncorrected" flux
APCORRFLUX Aperture photometry processed for planetary search TEFF Derived effective temperature
LOGG Derived log1O surface gravity
RADIUS Estimated stellar radius
A single FITS file provides the measured values of a wide range of physical
param-eters of the star system, as well as the measurements of time and flux necessary to construct a light curve. A summary of the available data fields which were of impor-tance to this research is provided in Table 2.1. Some gaps and anomalies in the data are present, but are well-understood as systematic effects due to the repositioning and maintenance of the Kepler satellite, as detailed in the Kepler Data Release 7 notes [Christiansen and Machalek, 2010]. Light curve data are reported in either
short-(SC) or long-cadence (LC) period, with SC data coadded in 58.85-second intervals
and LC data coadded in 1766-second (or 0.49-hour) intervals. As such, any separation betweeen two consecutive data points in a single light curve which is greater than the standard cadence qualifies as a gap, and no two consecutive data points are separated
by less than the light curve's standard cadence.
From the fields of data available in the downloaded FITS files, only BARYTIME and APCORRFLUX were used in the frequency-space search for eclipsing candi-dates, though APRAWFLUX was often studied in case physical trends in the flux data were accidentally removed by the Kepler team's correction algorithms. For the remainder of this thesis, references to the "flux" of a system will be to the data from APCORRFLUX unless otherwise noted.
2.2
Data Reduction and Transformation
Even for the corrected flux data, some procedures had to be followed to remove artifacts and prepare the data for a discrete Fourier transform. The most common
artifacts encountered were flux data points whose values were missing and hence set equal to (-INF). These points stand as markers for the gaps in the data due to the systematic processes in the Kepler data pipeline explained above and can be safely ignored [Christiansen and Machalek, 2010]. Any such data points - and their corresponding points from BARYTIME - were removed from the flux before further
processing.
Next, the discrepancies in the cadence of each individual light curve -the amount of time separating any two consecutive data points - had to be reconciled. By con-struction, the fast Fourier transform (FFT) assumes equal spacing between data points on the time axis. Otherwise, the linear correlation between bin number and time is broken, and the resultant frequencies reported out of the FFT will be invalid. Each light curve was reconstructed by dividing the time series into a number of bins whose widths were equal to the standard cadence of the light curve in question (utilizing a slight modification of code the author had constructed for a previous project). If the portion of the time series to which a bin corresponded contained a data point, the flux value of this data point was assigned to the bin. If the bin corresponded to a gap in the time series, it was assigned the flux value of the last bin before the gap. That is, if bin n had a flux value of
f,
but the next x consecutive bins n+
1, n+
2, ...n+
x each corresponded to no flux value, all x empty bins were assigned a flux off.
This correction was expected to minimize the window-function artifacts introduced into the FFT.The final alterations made to the light curve were meant to remove any linear trends, as linear rises or falls in flux over an 88-day period could be attributed to instrumental drifts for all cases of interest to this research. A linear approximation was fit to each curve and subsequently divided out of the flux. The flux was then normalized, with its maximum value set to unity, so the relative changes in brightness could be more easily evaluated.
With the gaps in its cadence corrected and all linear trends removed, each light curve was ready to be studied in frequency space. To achieve this, a simple FFT was performed on the reduced flux data after subtracting out the mean flux to center the
data about zero. The modulus of the FFT was then calculated to combine the sine and cosine components inferred from the complex FFT. In all frequency-space plots presented in this thesis, the y-axis (often referred to as "amplitude") corresponds to this modulus, not to the modulus-squared (or "power") as is common practice.
2.3
Analysis and Candidate Determination
In the following subsections we describe (i) the coarse-grained screening algorithm which detected harmonics in frequency space, (ii) the quick visual inspection to dis-card false positives; and (iii) the phase-folding of all surviving candidates about the period(s) detected in the FFTs. These inspections of the reduced data and FFTs (ob-tained by the methods described in the previous section) determined whether or not each light curve represented an EB or other interesting periodically variable system.
2.3.1
The FFT Selection Algorithm
As illustrated in Figure 2-1, the dips that are representative of EB systems can be rec-ognized in frequency-space by the distinctive pattern of equally-spaced FFT "peaks" they produce. The first of these peaks occurs at the "base frequency", which is the inverse of the orbital period, and the subsequent peaks occur at integral multiples (or "harmonics") of the base frequency. It turns out that any sharp-featured periodic dips or peaks in a light curve can be expected to produce this effect, including some stellar pulsators. However, identifying a harmonic pattern of peaks is an efficient first step in identifying a binary.
In the algorithm developed to search for harmonic patterns, a significant peak was defined to be an FFT value whose amplitude exceeded the mean amplitude of its near-est neighbors by more than a factor of 4. The definition of "nearnear-est neighbors" varied: for the sixth to one-hundredth frequency bins, the five previous lower-frequency bins and five next higher-frequency bins were used to compute the mean; for bin number
101 to the Nyquist limiting bin, the fifteen previous lower and fifteen next higher
frequencies because there are fewer bins separating the harmonics of a low-frequency signal. The first five frequency bins were ignored due to the fact that most FFTs of real data are subject to a modest amount of 1/f noise. The requirement of a peak that is a factor of 4 above background-noise was an arbitrary choice decided by trial-and-error. If no significant peaks were found in frequency space for a given object, the search skipped forward to the next Kepler target.
With the previous step completed, all significant peaks were identified and the search for harmonics could begin. Starting with the lowest-frequency peak, corre-sponding to a frequency bin fo, the fifteen bins that fell in the range -fo + 2, 2fo ± 2,
and 3fo ± 2 were identified. If the amplitude in any of these bins exceeded the mean
of its nearest neighbors (defined in the same way as above) by a factor of 3, this was interpreted as a harmonic pair with the peak at fo, and the star system in question was labeled as an EB candidate. If no such harmonic was found, the search would continue again from the next peak at
fi,
then f2 and so on. Only a single harmonicpair identification was required for EB candidacy.
2.3.2
Automation and Output
The data reduction and Fourier transformation described in Section 2.2 and the har-monic inspection described in Section 2.3.1 were performed automatically on each of the ~160,000 Kepler targets in succession using an IDL script. In addition, by com-paring the KIC number of each target against an ASCII list of the binaries identified
by the Prsa team [Slawson et al., 2011] and a similar list of planetary candidates
compiled by the team led by William Borucki2, the systems which had already been
included in either of these catalogs were identified by the script.
If a Kepler target was determined to be an EB candidate by the harmonic
screen-ing algorithm, a four-panel plot was produced to allow further inspection. The four components of the plot (an example of which can be seen in Figure 2-1) were as
follows: 2
1. Top Left: Uncorrected, normalized AP-RAWFLUX versus time, with a label
if the system is part of Prsa's or Borucki's catalog
2. Bottom Left: APCORRFLUX with cadence and linear corrections, normal-ized, versus time
3. Top Right: The FFT used in the selection algorithm, with the frequency axis
labelled in "Cycles per Day" and extending out to the Nyquist frequency; the frequency of the "tallest" peak is noted at the top of the subplot
4. Bottom Right: Same as Top Right, but with the frequency axis only covering low-frequency behavior, allowing for closer inspection of this regime
Using the information provided by the header of the target's FITS file, the four-panel plot was also labeled with the system's TEFF, RADIUS, and LOGG values as measured by Kepler (see Table 2.1). It was also noted on the plot if the source appears in either the Prea or Borucki catalogs. Section 2.3.3 will explain how these plots were used for the next stage of binary identification.
2.3.3 Visual Inspection
Of the initial -160,000 light curves, 4,674 were chosen for further consideration by the
FFT selection algorithm described above. However, these included a large number of systems which were already listed in the Prsa et al. catalog, as well as a substan-tial number of stellar pulsators. The goal of the next step of the procedure was to determine and eliminate the false positives.
A false positive is here defined as a system whose FFT shows peaks which allow it
to pass the selection algorithm, but which can be determined by visual inspection not to be an EB or any of the "interesting cases" to be discussed in the next chapter. Such stars exhibit some other type of periodic behavior, such as pulsations in brightness or sunspots on their rapidly rotating surfaces.
We show an example of one of the four-panel plots in Figure 2-1 to illustrate the visual inspection process. The subject of this figure is KIC 4281068, a binary
1.00 0.99 0.97-0 20 40 G0 8 Days kplrO04281068 CORRECTED 1.000 II 0.990 V 0.985 0.980 0.975 0.970 0 20 40 60 80 AMP = 0.0028508060 TEFF = 6070 0.0025 0.0020 0.0015 E 0.0010 0.0005 0.0025 0.0020 0.0015 E 0.0010 0.0005 kpirO94281098 FFT 1 9725876 A-5 10 15 20
Cycles per Day kplrO04281068 - FFT
0.5 1.0 1.5 2.0 LOGG = 4.50700 RAD = 0.965000
Figure 2-1: An illustrative 4-panel plot of the light curve and FFT for KIC 4281068. The panels are (counter-clockwise from the upper left): (i) the raw Kepler data (flux vs. time), (ii) the corrected flux, (iii) the low frequency portion of the FFT, and (iv) the entire FFT (up to the Nyquist limit of ~25 cycles/day). The pattern of peaks in the FFT is clearly representative of an EB. The two "glitches: in the data at days
15 and 82 were due to "safeholds" of the satellite and are therefore instrumental in
origin.
*1-system which is included in Prea's catalog. This is a typical FFT of an EB (of the "over-contact" variety), and the primary and secondary eclipses are fairly obvious in the light curves. The FFT peak with the greatest amplitude occurs near 1.973 cycles per day and lies at the first harmonic of the base frequency, so the period should be approximately 2 x (1.973)-i or 1.014 t 0.001 days. The error on this calculation comes from the fact that each frequency bin (for a long-cadence light curve) has a width of (1766 sec)-1 or ~0.006 cycles per second, and without Fourier interpolation we obtain the frequency to better than half a bin.
As demonstrated by the phase-folded light curve in Figure 2-2, the period is approximately 1.015 days, which is in agreement with our FFT determination above. In a phase-fold, the time axis of a light curve is divided into a number of segments, each with a length equal to the period in question. These segments are then overlaid atop each other so that data points corresponding to the same phase of the orbit will overlap. Since the phase-fold of KIC 4281068 at a period of 1.015 forms a very coherent light curve with clear primary and secondary eclipses, we can confirm the system to be an EB.
On the other hand, take the case of KIC 4283747, as illustrated in Figure
2-3. There are so many random peaks in this FFT that this object passed the FFT
selection algorithm by pure chance. There is no distinct harmonic pattern, so this is clearly not an EB and no coherent phase-fold can be constructed. Nor is there a pattern present that is representative of any of the special cases to be discussed in the next chapter. This system is one of many which was not of particular interest to this research, but should prove useful in asteroseismology studies.
fX10 1 3.62 iJ u. 0 M. 3.58 3.58 3.54
Rank NA, Period 1.015426
0.0 0.5 1.0 1.5 2.0
Phase
Figure 2-2: The light curve of KIC 4281068 phase-folded about the orbital period
1.015 days. The primary and secondary eclipses are clearly visible, showing that this
system is an EB. It is likely that these two stars are orbiting each other essentially in Roche lobe contact.
I . .
I i a
kpIrO942374 FF- 2,1.9974 0 20 40 G0 80 Days kplrOO4283747 CORRECTED qj.3 9 -0 20 40 AMP = 0.00022944012 60 80 TEFF = 7310 E 2.0x10⁻⁴ 1.5X 10 1.Ox10-4 5.0x10-S 5 10 15
Cycles per Day
E
20
0.5 1.0 1.5 2.0
LOGG = 4.09400 RAD = 1.72000
Figure 2-3: The light curve and FFT of KIC 4283747, which passed the FFT selection algorithm, but only as a false positive. The FFT is chaotic, which allowed it to exhibit one or more accidental "harmonic pairs" among its many significant peaks. Note the temperature of the star is ~7,300 K, making this a likely 6-Scuti pulsator.
0.99 ) 8 0.98 0.97 1.000 0.998 S0.996 0.994 0.992
2.3.4
Phase-Folding Analysis
The final step in identifying the EB systems and other interesting objects involved phase-folding the light curves which had passed the previous two screening processes. This utilized the resources available through the NASA Exoplanet Archive3, which allows users to fold the light curve of any available Kepler object about a period which is calculated by a Lomb-Scargle algorithm. Further details of this method will be discussed in the next chapter.
3
Chapter 3
Searching for EBs and Other
Interesting Systems
The first two steps of the selection process reduced the number of EB candidates or periodically variable systems of interest from -160,000 to -500 (setting aside the ~1,400 objects we found that were already in the Prea catalogi, which were tentatively assumed to be true EBs). Since this number was much more manageable than the full
Kepler set of targets, a third step could be utilized to classify each of the remaining
candidates according to the shape of its phase-folded light curve.
As mentioned in the previous chapter, all phase-folds were produced using the
NASA Exoplanet Archive's Periodogram resource2, which utilized a Lomb-Scargle
algorithm to determine the most accurate period about which to fold each light curve. The Lomb-Scargle algorithm is analogous to an FFT, but is designed to work on non-uniformly spaced data [Scargle, 1982].
The sections of this chapter will describe the qualities of phase-folded light curves and FFT patterns by which certain classifications were defined. The classifications covered by this work are the following: Binary stars, RR-Lyrae pulsating stars, and
'While the Prsa et al. catalog contains 2,176 objects at the time of this writing, only 2,074 of those were targets which were included in the publicly released Q2 data at the time of our download. Therefore, the FFT selection algorithm succeeded in identifying ~1,400 of a total possible 2,074 Prsa binaries.
2
sub-giant stars with solar-like oscillations. Figure 3-1 is provided as an example of the FFT patterns which are representative of each binary sub-classification.
3.1
Binary Stars
As mentioned before, a binary star system consists of a primary and a secondary star in orbit about a common center of mass. Following the lead of Prea et al., our search for these systems focused on identifying four separate classes of binaries: Detached
(D), Semi-Detached (SD), Overcontact (OC), and Ellipsoidal Light Variables (ELV). The next subsection will detail the parameters by which these classes can be distin-guished; the following subsections will describe how each class can be identified by studying the FFTs and phase-folds of their light curves at the orbital period.
3.1.1
Parameters of Binary Stars
It is worthwhile to note here how some physical properties of the component stars in an EB can be inferred from the light curve. This will not only explain how the study of EBs can benefit studies of stellar evolution or distance scales (which require measurements of each star's mass and radius), but it will also explain some key differences between the EB classifications soon to be discussed.
The simplest measurements to make from an EB light curve are those of the orbital period and eclipse duration. The full width of an eclipse, dT, can be determined directly from the light curve, and this can be converted to the eclipse half-angle,
#,
as follows:
dT
2# = 27r ,T (3.1)
P
where P is the orbital period. In the case that the orbital inclination of the binary system is nearly 900 with a circular orbit, we can further relate the stellar radii and orbital separation to the eclipse angle by
sin(#) = , (3.2)
kplrOO43745~ FFT .55241 251
5 10 15 20
Cycles per Day
kpIrOy244417 -FFT 57129365
5 10 15
Cycles per Day
0.06 0.05 0.04 'CL 0.03 E 0.02 0.01 0.005 0.004 20.003 E 0.002 0.001 20 kplrO9328693 FFT 2.5929670 5 10 15 20
Cycles per Day
kplr0q3443519 - FFT 57659 999
5 10 15
Cycles per Day 20
Figure 3-1: These sample FFT patterns illustrate the following (clockwise from upper left): (i) the dense envelope of peaks representative of a detached (D) binary with a long period; (ii) the harmonic pattern with a clear peak at the base frequency seen in most semi-detached (SD) binaries (here, the peak at the first harmonic is larger than that at the base frequency); (iii) the harmonic pattern with a barely discernable base frequency peak of an overcontact (OC) binary; and (iv) the FFT of an ellipsoidal light variable (ELV), with a single dominant peak at twice the base frequency and few harmonics. 0.003 0.002 0.001 0.05 0.06 0.04 E 0.02
7-with R1 and R2 being the radius of each constituent star and a being the separation between them. Thus the simple measurement of dT can tell how separated the stars are with respect to the sum of their radii, which is a key ratio differentiating among D, SD, and OC binaries. For eccentric and/or inclined orbits, the corresponding expressions are more complicated.
The degree to which each component star fills its Roche lobe is another key differ-ence between the EB classifications. The Roche lobe is the critical potential surface around each star in a frame of reference that rotates with the binary. Any mass be-yond this surface is subject to being lost from the system or transferred to the other star. The radius of a star's Roche lobe in units of orbital separation, RL, depends only upon the binary system's mass ratio, q, where
q = M1/M2, (3.3)
with Mi being the mass of the star in question (primary or secondary) and M2 the
mass of its companion. If q is known, RL can be approximated using Peter Eggleton's formula [Eggleton, 1983] as follows:
RL - 0.49 q 2/3(34
RL 0. 0..49
0.6 q2/3 + ln(1 + qi/3)'
for all values of q. In highly-detached D binaries, R1 and R2 are both much smaller than RL. In semi-detached cases, either R1 or R2 is near in size to RL, but not both. If both radii are nearly equal to RL, the binary is an OC system.
Lastly, the amplitude of the ellipsoidal light variations often seen in an EB light curve outside of the eclipse regions can also be used to study the masses and radii of component stars. These variations are the result of tidal distortions of the star's surfaces, and thus the amplitude of the effect is highly sensitive to the size of the star compared to its respective
RL-In the case where only one star has a radius that is a significant fraction of its Roche lobe (e.g., as in an SD binary), the amplitude of the ellipsoidal light variations,
Ae,, is approximately
M2 (R1N3
Aeiv 1.5 Ma Mi a (3.5)
where M1 and R1 are the mass and radius of the star which is being tidally distorted [Carter et al., 20111. If both stars have significant tidal distortion (as in something approaching an OC binary), Aev is simply a sum of the previous calculation for each star:
M 2 R1 3 M1 (R 2 3
Aev = 1.5 + 1.5 . (3.6)
Mi a M2 a
For example, if each star has a radius of ~10% of the orbital separation, and q ~ 1, then AELV ~ 0.003. Such an amplitude is easily detectable with Kepler photometry.
3.1.2
Detached Binaries
A detached binary system is one in which the separation between the constituent
stars is large relative to their radii [Prsa et al., 2011]. In these cases, the duration of the eclipses is relatively short compared to the orbital period, so the dips in the light curve of a D binary are typically narrow. It is usually possible to identify one deep (primary) and one shallow (secondary) eclipse event per orbital period. Exceptions to this rule include systems with substantial eccentricities - in which case only one
of the stars may eclipse - and systems in which the constituent stars are equal in
size and brightness - in which case the primary and secondary eclipses may be nearly
indistinguishable from each other.
Furthermore, because the stars in these systems are usually too separated to tidally deform each other's surfaces, the primary out-of-eclipse variations seen in the light curve of a D binary may be due to stellar oscillations in the component stars themselves. To be exact, AELV for a system where q ~- 1 will drop below 10-5 (approximately the lowest fractional amplitude which Kepler can reliably detect) if R1/a < 0.02. While ellipsoidal light variations can still be present, they are typically more noticeable in SD binaries.
The FFT of a D binary light curve is easily recognizable. Typically, the base
binaries tend to have larger periods). As such, the pattern of harmonics in the FFT is dense. These harmonics often form a broad envelope of peaks at low frequencies as seen in Figures 3-1 and 3-2. Figure 3-2 illustrates both the FFT pattern and phase-folded light curve of KIC 8589731, which we have found and identified as a D binary, and which is not in the Prsa catalog.
3.1.3
Semi-Detached Binaries
Prea et al. define an SD binary to be a system in which one component star has filled or nearly filled its Roche lobe while the other remains detached [Prea et al., 2011]. The separation between the stars relative to their radii is thus intermediate between
D and OC systems. Eclipses in SD binaries are usually still well-defined, though they
are typically wider relative to the orbital period than those of D binaries.
Out-of-eclipse regions in the light curves of SD binaries tend to be rounded as a result of tidal deformations of the surface of one or both component stars. These ellipsoidal light variations differ in amplitude from system to system but are relatively constant within one light curve.
While no pattern in frequency space uniquely identifies an SD system, the FFT of an SD light curve will usually contain a series of peaks at the base frequency and its harmonics. If the two eclipse events are similar in depth and width, the peak at the base frequency and its even-numbered harmonics may nearly disappear, as the system appears to be varying at twice the base frequency, i.e., at the frequency of the first harmonic (see Figure 3-1).
As an example of an SD binary that was identified in this research, KIC 9935242 is examined in Figure 3-3.
3.1.4
Overcontact Binaries
If the two stars of a binary system are so close that they both essentially fill their
Roche lobes (i.e., they share a common envelope), they constitute an OC binary [Prea et al., 2011]. In these cases, eclipses are no longer identifiable as sharp dips
8x10⁻⁵ 6x10-cL 4x10⁻⁵ E 2x10~5 (X104 I 5.52-5.51 5.50 5 10 Cycles I+-15 per Day -I-20
Rank NA, Period 8.914648
-I-4* 0.0 ±
I
Iz
III
-1- -1-I 4- I -~ 0.5 1.0 Phase 1.5Figure 3-2: The detached binary KIC 8589731. Top: The FFT of the star's light curve, which demonstrates the representative pattern of detached binaries. Bottom: When the light curve is folded about a period of 8.915 days, the primary and secondary eclipses of this system are clearly visible, even though their depth is only one part in
500. The modulation that is seen in the out-of-eclipse region is likely due to sunspots
on one or both stars. LL.
C',
0.0006 0.. E 0.0004 0.0002 5 10 15 20
Cycles per Day
Rank NA. Period 0. 784892
. . f
LL
2.0
'.0
Phase
Figure 3-3: The semi-detached binary KIC 9935242. Top: The FFT of the star's light curve, which demonstrates the representative pattern of semi-detached binaries. Bottom: When the light curve is folded about a period of 0.785 days, the primary and secondary eclipses and out-of-eclipse variations are clearly visible.
in flux, as the flux of the system is constantly changing, and no well-defined out-of-eclipse regions exist. When phase-folded at the orbital period, the light curve of an
OC system appears to modulate continuously, and there are often two distinct local
minima of disparate depths per period (the primary and secondary eclipses).
The FFT of an OC binary can be similar to that of an SD, except that the peak at the base frequency of an OC system is often very low compared to the peak at its first harmonic, and the peaks at the even-numbered harmonics may be nearly nonexistent (see Figure 3-1). KIC 4859432, an OC system not found in the Prea catalog, is shown in Figure 3-4 as representative of this class.
3.1.5 Ellipsoidal Light Variables
All three of the classifications discussed so far are more generally known as eclipsing
binaries. But a fourth class of binary in which no eclipses occur can also be identified photometrically. If the components of a binary are near enough to distort each other's surface, but the inclination of the orbital plane is such that neither star passes between its companion and the observer, it is still possible to detect changes in brightness due to the changing cross-sections and surface gravities of each star [Prea et al., 2011]. The light curves of these ellipsoidal light variation (ELV) systems are near-sinusoids with no detectable eclipse events and a dominant period at twice the orbital frequency. As such their FFTs usually show little more than a single tall peak at the first harmonic of the base frequency, and perhaps small peaks at the base frequency and its second harmonic (see Figure 3-1). Figure 3-5 shows KIC 7900367, an example of this class which was discovered in this work.
3.2
RR Lyrae Stars
The variable star RR Lyrae is located near the boundary between the Lyra and Cygnus constellations, fortuitously placing it within Kepler's field of view. RR Lyrae serves as the archetype of a class of low-mass pulsating stars which are late in their evolutionary lives [Nemec et al., 2011], burning He in their cores after descending
1.5x10~* W 4-0 a-E 1.Oxl 0-5.Ox10-5 5 10 15 20
Cycles per Day
Rank NA. Period 0.385476
CL 0- 70 00 0.0 0.5 1.0 Phase 1.5 2.0
Figure 3-4: The overcontact binary KIC 4859432. Top: The FFT of the star's light curve, which demonstrates the representative pattern of eclipsing binaries. Bottom: when the light curve is folded about a period of 0.385 days, the near-sinusoidal vari-ation of the over-contact system is evident.
I
I . .
0.0010 0.0006 0.0006 E 0.0004 0.0002 I I I I lI I I I I I I I I I I I I I I 5 10 15 20
Cycles per Day
Rank NA. Period 0.150948
4.78 C-) CL 4.76 4.74 I'~'' I ± -I-4 I I I I 0.5 1.0 1.5 0.0 2.0 Phase
Figure 3-5: The ELV binary KIC 7900367. Top: The FFT of the star's light curve, which contains only two significant peaks, one at the base frequency and a larger one at its first harmonic. Bottom: Phase-folding the light curve at twice the sys-tem's orbital frequency produces this sharp-featured, nearly sinusoidal curve, which is representative of ELV binaries.
4 44
from their first ascent of the giant branch. As shown in the work by Nemec et al., these stars are useful to the study of stellar evolution, and efforts to catalog their numbers in the Kepler FOV (estimated to be ~ 80) have been ongoing since 2010
[Kolenberg et al., 2010].
Over the course of one pulsation cycle, the brightness of an RR Lyrae type star will dip slightly, then rise quickly and dramatically (by a whole magnitude), and finally gradually fall to quiescent levels [Kolenberg et al., 2010]. This periodic brightening effect makes the stars readily identifiable.
Since the FFTs of RR Lyrae stars follow nearly the same pattern as D and SD systems, it is easy to mistake these stars for binaries until phase-folds reveal their distinctive shape and very large amplitudes. We offer a catalog of the RR Lyrae stars we found during this research in Appendix C. Figure 3-6 gives the FFT and phase-fold of KIC 6763132, a clear RR Lyrae star.
3.3
Sub-Giants with Solar-Like Oscillations
Our early studies of the candidates which passed the FFT selection algorithm revealed a commonly recurring pattern in approximately 200 of the 4, 674 candidates. The FFTs of these light curves have an overall envelope shape similar to
f-
1, wheref
is the frequency of oscillation, except with the addition of a significant cluster of peaksusually between 5 and 10 oscillations per day.
Further research found these features were characteristic of sub-giant or red giant stars which are undergoing solar-like oscillations. These oscillations provide direct information on the mean densities and surface gravities of these stars, from which one can infer their masses and radii. Considerable research on the phenomena within the Kepler database has already been conducted [Hekker et al., 2011]. An example of the FFT patterns of these sub-giants is provided below. Due to the large number of such cases present in the data and the thoroughness of recent research by the Kepler team, we did not attempt to catalog these objects. Figure 3-7 shows the FFT pattern representative of these systems using KIC 1027337 and KIC 9873127 as examples.
0.08 0.06 7a E <c 0.04 0.02 5 10 15 20
Cycles per Day
Rank NA. Period 0.587982
-,
CL.
C-,
Phase
Figure 3-6: The RR Lyrae type of pulsating star KIC 6763132. Top: The equally spaced pattern of significant peaks in this FFT are reminiscent of D or SD binaries, making it easy to mistake RR Lyrae stars for EBs given only this information. Bot-tom: When phase-folded about the period of pulsation, the short dips followed by sudden and dramatic rises in brightness of an RR Lyrae star are very distinctive.
11
III
hi . I 15 20 per DayI
.
5 10 Cycles 1.5x10⁻⁵[ 1.Ox10-~ 5.Oxl 0-I ' I 'I N I 10 15Cycles per Day
Figure 3-7: Example FFTs of sub-giant pulsators. Top: KIC 1027337 follows the
1/f envelope expected of these sub-giants with solar-like oscillations, with a cluster
of peaks near 6 cycles/day. Bottom: KIC 9873127 is a similar sub-giant, but with its cluster of peaks appearing at a much higher frequency, near 18 cycles/day.
11
3x10~5 2x10~5 1x10~5 a-E I I S I a. E 20 . . . .. . I
. . .. .. . . I -1 IAppendix A
The Catalog of New Eclipsing
Binaries in the Kepler Database
Here we present the primary product of this thesis, a catalog of 173 proposed binary systems which were discovered in the Kepler database, but which were not found in the Kepler team's catalog of binaries [Slawson et al., 2011]. Figure A-1 shows how these systems were distributed by orbital period.
For each system, we provide the identifying Kepler Input Catalog (KIC) number, the orbital period (in days) as determined via phase-fold, the tentative binary clas-sification, the effective temperature (in Kelvin), the logarithm of surface gravity (in cgs units), and the radius (with RO = 1).
The binary classifications include detached (D), semi-detached (SD), overcontact
(OC), and ellipsoidal light variable (ELC), which are explained in detail in Chapter 3.
Borderline cases are labelled with the author's best attempt at a proper classification followed by question marks. A system labelled "SD ??" is therefore thought to be semi-detached, but the light curve and FFT stray too far from the SD prototype for this classification to be certain. Another eleven systems which exhibit clear periodic behavior, but could not be classified certainly as binary or any known type of pulsator, are labelled only with question marks and appended to the end of this table.
All values of TEFF, LOGG, and RADIUS are taken from the headers of the