DOI: 10.1093/jnci/djs208 © The Author 2012. Published by Oxford University Press. All rights reserved.
Advance Access publication on April 23, 2012. For Permissions, please e-mail: journals.permissions@oup.com.
Neuroendocrine neoplasms of the pancreas, also known as islet cell tumors, are relatively rare, although they are diagnosed with increasing
incidence and high prevalence (1). Because of their overall indolent
but malignant course, pancreatic neuroendocrine neoplasms have not
been well studied, and standard staging tools have been lacking (2).
A TNM staging system for neuroendocrine neoplasms of the pancreas was proposed for the first time in the year 2006 by the
European Neuroendocrine Tumor Society (ENETS TNM) (3).
More recently, the International Union for Cancer Control devel-oped a TNM staging system, which is now endorsed by both the American Joint Cancer Committee and the World Health
Organization (UICC/AJCC/WHO 2010 TNM) (4–6).
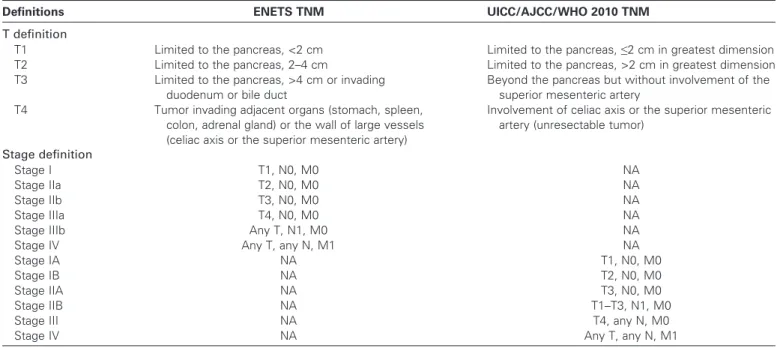
However, the tumor definition and derived stages of the ENETS TNM and the UICC/AJCC/WHO 2010 TNM staging
systems greatly differ (Table 1). Specifically, the UICC/AJCC/
WHO 2010 TNM is the same as for the ductal adenocarcinoma and is not meant for high-grade neuroendocrine neoplasms. The ENETS TNM is based on the published experience of single centers and not on a uniform database; since its earliest publication,
it has been validated by at least six independent series (7–12). In
contrast, the UICC/AJCC/WHO 2010 TNM is built on a cancer registry database publication and is thus based on somewhat
limited data (13). Recently, this system was validated on a
mono-institutional series (14).
ARTICLE
TNM Staging of Neoplasms of the Endocrine Pancreas: Results
From a Large International Cohort Study
G. Rindi, M. Falconi, C. Klersy, L. Albarello, L. Boninsegna, M. W. Buchler, C. Capella, M. Caplin, A. Couvelard, C. Doglioni, G. Delle Fave, L. Fischer, G. Fusai, W. W. de Herder, H. Jann, P. Komminoth, R. R. de Krijger, S. La Rosa, T. V. Luong, U. Pape, A. Perren, P. Ruszniewski, A. Scarpa, A. Schmitt, E. Solcia, B. Wiedenmann
Manuscript received September 9, 2011; revised March 9, 2012; accepted March 16, 2012.
Correspondence to: Guido Rindi, MD, PhD, Institute of Anatomic Pathology, Università Cattolica del Sacro Cuore, Histopathology and Cytodiagnosis Unit, Policlinico Gemelli, Largo A. Gemelli, 8, Roma I-00168, Italy (e-mail: guido.rindi@rm.unicatt.it).
Background Both the European Neuroendocrine Tumor Society (ENETS) and the International Union for Cancer Control/ American Joint Cancer Committee/World Health Organization (UICC/AJCC/WHO) have proposed TNM staging systems for pancreatic neuroendocrine neoplasms. This study aims to identify the most accurate and useful TNM system for pancreatic neuroendocrine neoplasms.
Methods The study included 1072 patients who had undergone previous surgery for their cancer and for which at least 2 years of follow-up from 1990 to 2007 was available. Data on 28 variables were collected, and the performance of the two TNM staging systems was compared by Cox regression analysis and multivariable analyses. All statistical tests were two-sided.
Results Differences in distribution of sex and age were observed for the ENETS TNM staging system. At Cox regression analysis, only the ENETS TNM staging system perfectly allocated patients into four statistically significantly different and equally populated risk groups (with stage I as the reference; stage II hazard ratio [HR] of death = 16.23, 95% confidence interval [CI] = 2.14 to 123, P = .007; stage III HR of death = 51.81, 95% CI = 7.11 to 377, P < .001; and stage IV HR of death = 160, 95% CI = 22.30 to 1143, P < .001). However, the UICC/AJCC/WHO 2010 TNM staging system compressed the disease into three differently populated classes, with most patients in stage I, and with the patients being equally distributed into stages II–III (statistically similar) and IV (with stage I as the reference; stage II HR of death = 9.57, 95% CI = 4.62 to 19.88, P < .001; stage III HR of death = 9.32, 95% CI = 3.69 to 23.53, P = .94; and stage IV HR of death = 30.84, 95% CI = 15.62 to 60.87, P < .001). Multivariable modeling indicated curative surgery, TNM staging, and grading were effective predictors of death, and grading was the second most effective independent predictor of survival in the absence of staging information. Though both TNM staging systems were independent predictors of survival, the UICC/AJCC/WHO 2010 TNM stages showed very large 95% confidence intervals for each stage, indicating an inaccurate predictive ability.
Conclusion Our data suggest the ENETS TNM staging system is superior to the UICC/AJCC/WHO 2010 TNM staging system and supports its use in clinical practice.
The presence of two different TNM systems raised concerns of
potential confusion in patient management (15,16). The aim of our
study was to provide information on use of the two systems by a head-to-head comparison using a large, international single database. In addition, the predictive ability of the ENETS/WHO 2010 histological grading for digestive NETs and of several other relevant clinical–pathological variables was assessed.
Materials and Methods
Data CollectionEight European cancer centers provided data on pancreatic neuroendocrine neoplasms. The centers were selected because they had either already published their series to test the ENETS TNM or have previously published studies on pancreatic neuro-endocrine neoplasms. Data from 1072 neoplasms from the following centers were included in the analysis: Verona-Roma
(n = 365 neoplasms) (12), Berlin-Charité (n = 170 neoplasms)
(10), Varese-Milano San Raffaele-Pavia (n = 144 neoplasms) (9),
Heidelberg (n = 118 neoplasms) (8), Zurich (n = 114 neoplasms),
Clichy (n = 111 neoplasms), London-UCL (n = 32 neoplasms), and Erasmus-Rotterdam (n = 18 neoplasms). None of the neo-plasms analyzed in this study has been analyzed in previously published reports aiming at the development of the ENETS TNM system. The internal ethics committees of each center gave their approval for the study. The study enrollment criteria included the following: the patient had undergone surgery for their cancer, and at least 2 years of follow-up data were available; as well, the patient had been under observation for at least 2 years during 1990–2007. We analyzed 27 variables including age, sex, ethnicity, date of diagnosis, date of last follow-up, time of follow-up, status at last follow-up, curative surgery, genetic status, site, number of lesions, functioning tumor, type of syndrome, WHO 2000 class,
ENETS-WHO 2010 grading (17), mitotic count, Ki67 index,
size, ENETS TNM Stage, ENETS T (tumor definition), N (lymph node status), number of lymph nodes, M (distant metastases), CONTEXT AND CAVEATS
Prior knowledge
Two TNM staging systems for pancreatic neuroendocrine neo-plasms have been proposed by the European Neuroendocrine Tumor Society (ENETS) and the International Union for Cancer Control/American Joint Cancer Committee /World Health Organization (UICC/AJCC/WHO), respectively.
Study design
Data from 1072 patients who underwent surgery for neuroendocrine neoplasms of the pancreas were used to compare the performance of the two TNM staging systems.
Contribution
Unlike the UICC/AJCC/WHO 2010 TNM staging system, the patients were divided into four different and equally populated risk groups when the ENETS TNM staging system was used. Both TNM staging systems were found to be independent predictors of survival, although the UICC/AJCC/WHO 2010 TNM staging system was observed to have inaccurate predictive ability.
Implication
The ENETS TNM staging system should be the preferred method for staging pancreatic neuroendocrine neoplasms.
Limitations
Because this was a retrospective study, there may have been some variation in the methods used when the data was collected. Also, variability in the pathologists and treatments at different institutions may also be present in the dataset.
From the Editors
Table 1. T and stage definitions in the European Neuroendocrine Tumor Society (ENETS) and the International Union for Cancer
Control/American Joint Cancer Committee/World Health Organization (UICC/AJCC/WHO) 2010 TNM staging systems (3–6)*
Definitions ENETS TNM UICC/AJCC/WHO 2010 TNM
T definition
T1 Limited to the pancreas, <2 cm Limited to the pancreas, ≤2 cm in greatest dimension
T2 Limited to the pancreas, 2–4 cm Limited to the pancreas, >2 cm in greatest dimension
T3 Limited to the pancreas, >4 cm or invading
duodenum or bile duct
Beyond the pancreas but without involvement of the superior mesenteric artery
T4 Tumor invading adjacent organs (stomach, spleen,
colon, adrenal gland) or the wall of large vessels (celiac axis or the superior mesenteric artery)
Involvement of celiac axis or the superior mesenteric artery (unresectable tumor)
Stage definition
Stage I T1, N0, M0 NA
Stage IIa T2, N0, M0 NA
Stage IIb T3, N0, M0 NA
Stage IIIa T4, N0, M0 NA
Stage IIIb Any T, N1, M0 NA
Stage IV Any T, any N, M1 NA
Stage IA NA T1, N0, M0
Stage IB NA T2, N0, M0
Stage IIA NA T3, N0, M0
Stage IIB NA T1–T3, N1, M0
Stage III NA T4, any N, M0
Stage IV NA Any T, any N, M1
M site, UICC/AJCC/WHO 2010 TNM Stage, UICC/AJCC/ WHO 2010 T (tumor definition), type of surgery. Particular attention was paid to homogenous pathology assessment accord-ing to the ENETS Guidelines, ENETS/WHO 2010 gradaccord-ing, and
WHO 2000 classification (6,18). Deaths were classified as related
to the underlying tumor by each hospital center based on each patient’s medical chart. Tumor-related death was defined as death directly or indirectly (eg, therapy-related mortality) associated with the pancreatic neuroendocrine neoplasm. Empty electronic datasheets with instructions were provided to participating centers and, on compilation, were centrally reviewed by G. Rindi and C. Klersy.
The first data round collection was completed by October 2009. All data were cross-checked for inconsistencies by G. Rindi and C. Klersy. When necessary, centers were directly asked to clarify or amend the records. The whole database was revised by representatives from the participating centers during a dedicated session of the ENETS Advisory Board Meeting held in Rome, Italy, on November 11–13, 2009. Further important details were requested in a second round of data collection, and complete data-sheets were submitted during the first half of the year 2010. Every effort was made to minimize missing or incomplete data.
Statistical Analysis
Continuous data were described as the mean and standard devia-tion (SD) or median and 25th to 75th percentiles and were com-pared by Kruskall–Wallis tests. Categorical data were described as
counts and percentages and were compared by x2 tests. Median
follow-up was calculated by the inverse Kaplan–Meier method. Tumor-related death was calculated and follow-up time was deter-mined from the date of diagnosis to the date of tumor-related death or the last follow-up for survivors, and tumor-related death-free survival was estimated with the Kaplan–Meier method. Patients dying from causes other than their cancer were censored at their date of death. Death rates per 100 person-years were reported. The Cox model was used to assess the prognostic value of a series of patient and tumor characteristics. Hazard ratios (HRs) and 95% confidence intervals (CIs) were also calculated. The proportional hazard assumption (Schoenfeld residuals) was always satisfied, and model fit was assessed graphically with Cox–Snell residuals.
The performance of the two TNM systems was informally compared through Royston explained variation and the Harrell C or the Somer D discrimination statistics in which the higher value was representative of better system performance. The model was fitted on a training sample and validated in a testing sample, after
a random 1:1 split of the case series (19,20). Only cancers with data
for both TNM systems were used for head-to-head comparative tests.
To identify the optimal cutoff for predicting 5-year tumor mortality for cancers by tumor size, number of positive lymph nodes, mitotic count, and Ki67 index, receiver operating curve (ROC) analysis was performed. Cox models for these variables, dichotomized by the identified optimal cutoffs, were fitted over the entire follow-up in the training sample, and the performance of the dichotomized variable was assessed on the testing sample by means of the Harrell C statistic.
Given the collinearity of ENETS, the UICC/AJCC/WHO 2010 stage, and the WHO 2000 class, different multivariable models were fitted including either one of the three variables while also controlling for other noncollinear predictors for which P was less than .1 for the univariable analysis. Model validation and informal comparisons were on the basis of the Royston and explained variation, shrinkage coefficient (for calibration), and the
Harrell C statistic (for discrimination) (20). Graphical
discrimina-tion was assessed by plotting the Kaplan–Meier curves by the tertiles of the distribution of the predictor index (linear combina-tion of predictors) obtained from each model. The lower tertile identified patients at low risk of dying from their tumor, the middle tertile included patients with intermediate risk, and the upper tertile included patients at high risk. The Akaike infor-mation criterion was also computed, the lower value indicating
the better performance of the model (21). A series of sensitivity
analyses were done to assess the robustness of our conclusions regarding ENETS TNM and UICC/AJCC/WHO 2010 staging systems. We assessed the role of both TNM systems on tumor-free survival for each center separately, and with Cox models stratified by center, age, and/or sex, as well as the role of both classifications on overall survival. Analysis by race/ethnicity was done, but the data are not reported here because only limited information was obtained.
Data were analyzed with Stata (version 11; Stata Corporation, College Station, TX) and MedCalc (version 11; MedCalc Software, Mariakerke, Belgium). A two-sided P value of less than .05 was considered statistically significant. All statistical tests were two-sided.
Results
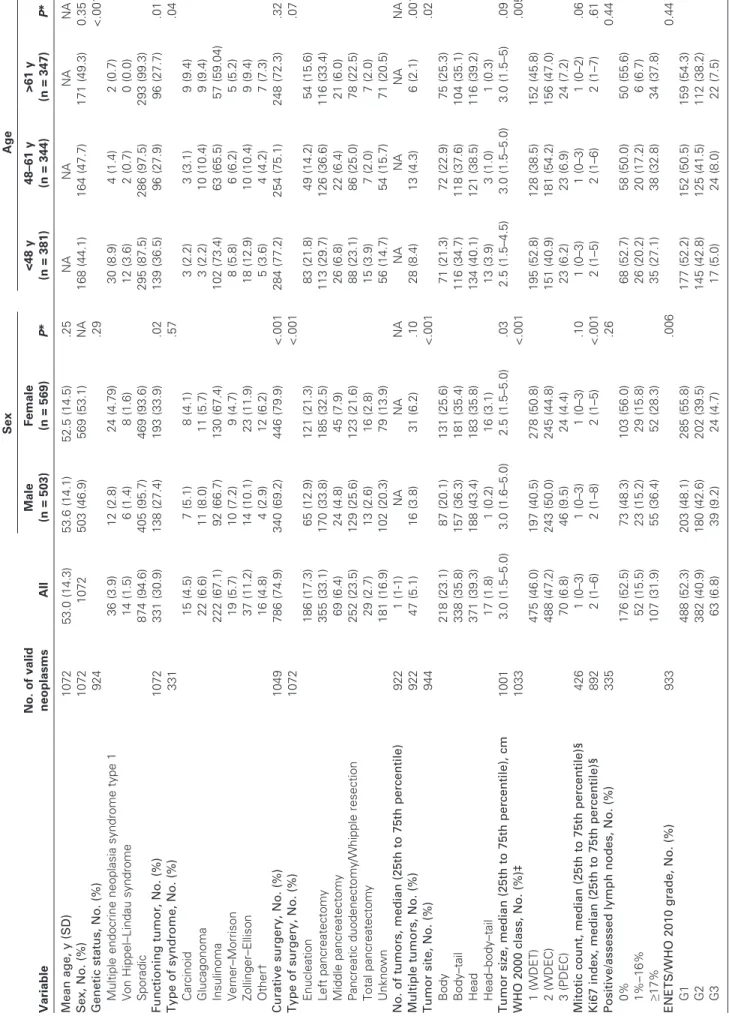
Emerging Clinicopathologic Features
The clinicopathologic data at diagnosis for patients included in the
study are summarized in Table 2. Of 1072 patients included in the
database, 503 (46.9%) were male. The mean age was 53 years (SD = 14 years). A median of 116 patients was enrolled in each Center (25th to 75th percentiles = 71–157 patients). One-third of the patients had a functioning neoplasm, of which insulinoma was the most frequent (67.1%). The tumor site was evenly distributed between head, body, and body–tail, with a small minority of patients (17 [1.8%] of 1072 patients) having whole-organ involve-ment (head–body–tail). Curative surgery was performed in 74.9% of patients. Few patients were in WHO 2000 class 3 (70 patients, 6.78%) and in ENETS/WHO 2010 grade G3 (63 patients, 6.75%). All ENETS and UICC/AJCC/WHO 2010 TNM stages were observed among the study cohort. Some differences in distribution by sex and age were observed across the ENETS TNM staging system, which persisted for age only after high-grade neoplasms were excluded, as required by the UICC/AJCC/WHO
2010 TNM staging system (Table 2).
Sporadic neoplasms were more frequent in older patients, whereas the multiple endocrine neoplasia syndrome type 1 genetic variant was more frequent among younger patients (P < .001). No differences in genetic status were observed between males and females. A functioning neoplasm was more often observed among females vs males (P = .02) and younger vs older patients (P = .01).
Table 2. Clinical and pathological features of pancreatic neuroendocrine neoplasms at the time of diagnosis by sex and age group Variable No. of valid neoplasms All Sex Age Male (n = 503) Female (n = 569) P * <48 y (n = 381) 48–61 y (n = 344) >61 y (n = 347) P * Mean age, y (SD) 1072 53.0 (14.3) 53.6 (14.1) 52.5 (14.5) .25 NA NA NA NA Sex, No. (%) 1072 1072 503 (46.9) 569 (53.1) NA 168 (44.1) 164 (47.7) 171 (49.3) 0.35 Genetic status, No. (%) 924 .29 <.001 Multiple endocrine neoplasia syndrome type 1 36 (3.9) 12 (2.8) 24 (4.79) 30 (8.9) 4 (1.4) 2 (0.7) Von Hippel–Lindau syndrome 14 (1.5) 6 (1.4) 8 (1.6) 12 (3.6) 2 (0.7) 0 (0.0) Sporadic 874 (94.6) 405 (95.7) 469 (93.6) 295 (87.5) 286 (97.5) 293 (99.3) Functioning tumor, No. (%) 1072 331 (30.9) 138 (27.4) 193 (33.9) .02 139 (36.5) 96 (27.9) 96 (27.7) .01 Type of syndrome, No. (%) 331 .57 .04 Carcinoid 15 (4.5) 7 (5.1) 8 (4.1) 3 (2.2) 3 (3.1) 9 (9.4) Glucagonoma 22 (6.6) 11 (8.0) 11 (5.7) 3 (2.2) 10 (10.4) 9 (9.4) Insulinoma 222 (67.1) 92 (66.7) 130 (67.4) 102 (73.4) 63 (65.5) 57 (59.04) Verner–Morrison 19 (5.7) 10 (7.2) 9 (4.7) 8 (5.8) 6 (6.2) 5 (5.2) Zollinger–Ellison 37 (11.2) 14 (10.1) 23 (11.9) 18 (12.9) 10 (10.4) 9 (9.4) Other† 16 (4.8) 4 (2.9) 12 (6.2) 5 (3.6) 4 (4.2) 7 (7.3) Curative surgery, No. (%) 1049 786 (74.9) 340 (69.2) 446 (79.9) <.001 284 (77.2) 254 (75.1) 248 (72.3) .32 Type of surgery, No. (%) 1072 <.001 .07 Enucleation 186 (17.3) 65 (12.9) 121 (21.3) 83 (21.8) 49 (14.2) 54 (15.6) Left pancreatectomy 355 (33.1) 170 (33.8) 185 (32.5) 113 (29.7) 126 (36.6) 116 (33.4) Middle pancreatectomy 69 (6.4) 24 (4.8) 45 (7.9) 26 (6.8) 22 (6.4) 21 (6.0) Pancreatic duodenectomy/Whipple resection 252 (23.5) 129 (25.6) 123 (21.6) 88 (23.1) 86 (25.0) 78 (22.5) Total pancreatectomy 29 (2.7) 13 (2.6) 16 (2.8) 15 (3.9) 7 (2.0) 7 (2.0) Unknown 181 (16.9) 102 (20.3) 79 (13.9) 56 (14.7) 54 (15.7) 71 (20.5) No. of tumors, median (25th to 75th percentile) 922 1 (1-1) NA NA NA NA NA NA NA Multiple tumors, No. (%) 922 47 (5.1) 16 (3.8) 31 (6.2) .10 28 (8.4) 13 (4.3) 6 (2.1) .001 Tumor site, No. (%) 944 <.001 .02 Body 218 (23.1) 87 (20.1) 131 (25.6) 71 (21.3) 72 (22.9) 75 (25.3) Body–tail 338 (35.8) 157 (36.3) 181 (35.4) 116 (34.7) 118 (37.6) 104 (35.1) Head 371 (39.3) 188 (43.4) 183 (35.8) 134 (40.1) 121 (38.5) 116 (39.2) Head–body–tail 17 (1.8) 1 (0.2) 16 (3.1) 13 (3.9) 3 (1.0) 1 (0.3) Tumor size, median (25th to 75th percentile), cm 1001 3.0 (1.5–5.0) 3.0 (1.6–5.0) 2.5 (1.5–5.0) .03 2.5 (1.5–4.5) 3.0 (1.5–5.0) 3.0 (1.5–5) .09 WHO 2000 class, No. (%)‡ 1033 <.001 .005 1 (WDET) 475 (46.0) 197 (40.5) 278 (50.8) 195 (52.8) 128 (38.5) 152 (45.8) 2 (WDEC) 488 (47.2) 243 (50.0) 245 (44.8) 151 (40.9) 181 (54.2) 156 (47.0) 3 (PDEC) 70 (6.8) 46 (9.5) 24 (4.4) 23 (6.2) 23 (6.9) 24 (7.2) Mitotic count, median (25th to 75th percentile)§ 426 1 (0–3) 1 (0–3) 1 (0–3) .10 1 (0–3) 1 (0–3) 1 (0–2) .06 Ki67 index, median (25th to 75th percentile)§ 892 2 (1–6) 2 (1–8) 2 (1–5) <.001 2 (1–5) 2 (1–6) 2 (1–7) .61 Positive/assessed lymph nodes, No. (%) 335 .26 0.44 0% 176 (52.5) 73 (48.3) 103 (56.0) 68 (52.7) 58 (50.0) 50 (55.6) 1%–16% 52 (15.5) 23 (15.2) 29 (15.8) 26 (20.2) 20 (17.2) 6 (6.7) ≥17% 107 (31.9) 55 (36.4) 52 (28.3) 35 (27.1) 38 (32.8) 34 (37.8) ENETS/WHO 2010 grade, No. (%) 933 .006 0.44 G1 488 (52.3) 203 (48.1) 285 (55.8) 177 (52.2) 152 (50.5) 159 (54.3) G2 382 (40.9) 180 (42.6) 202 (39.5) 145 (42.8) 125 (41.5) 112 (38.2) G3 63 (6.8) 39 (9.2) 24 (4.7) 17 (5.0) 24 (8.0) 22 (7.5) (Table continues)
Variable No. of valid neoplasms All Sex Age Male (n = 503) Female (n = 569) P * <48 y (n = 381) 48–61 y (n = 344) >61 y (n = 347) P * Stage, No. (%) All neoplasms ENETS 1034 .03 .03 I 290 (28.0) 112 (23.2) 178 (32.2) 115 (31.5) 87 (26.4) 88 (25.9) IIA 146 (14.1) 67 (13.9) 79 (14.1) 62 (17.0) 35 (10.6) 49 (14.4) IIB 77 (7.4) 36 (7.5) 41 (7.4) 27 (7.4) 17 (5.2) 33 (9.7) IIIA 39 (3.8) 21 (4.4) 18 (3.3) 10 (2.7) 13 (3.9) 16 (4.7) IIIB 198 (19.2) 98 (20.3) 100 (18.1) 64 (17.5) 69 (21.0) 65 (19.1) IV 284 (27.5) 148 (30.7) 136 (24.6) 87 (23.8) 108 (32.8) 89 (26.2) UICC/AJCC/WHO 2010 903 .07 .26 IA 266 (29.5) 103 (25.3) 163 (32.9) 106 (32.6) 81 (27.9) 79 (27.4) IB 142 (15.7) 59 (14.5) 83 (16.7) 56 (17.2) 37 (12.8) 49 (17.0) IIA 71 (7.9) 38 (9.3) 33 (6.6) 26 (8.0) 18 (6.2) 27 (9.4) IIB 125 (13.8) 63 (15.5) 62 (12.5) 40 (12.3) 41 (14.1) 44 (15.3) III 48 (5.3) 21 (5.2) 27 (5.4) 18 (5.5) 18 (6.2) 12 (4.2) IV 251 (27.8) 123 (30.2) 128 (25.8) 79 (24.3) 95 (32.8) 77 (26.7) High-grade neoplasms excluded ENETS 964 .14 .01 I 290 112 (38.6) 178 (61.4) 115 (39.7) 87 (30.0) 88 (30.3) IIA 144 65 (45.1) 79 (54.9) 62 (43.1) 33 (22.9) 49 (34.0) IIB 76 36 (47.4) 40 (52.6) 27 (35.5) 16 (21.0) 33 (43.5) IIIA 32 15 (46.9) 17 (53.1) 9 (28.1) 11 (34.4) 12 (37.5) IIIB 177 85 (48.0) 92 (52.0) 56 (31.6) 63 (35.6) 58 (32.8) IV 245 123 (50.2) 122 (49.8) 73 (29.8) 96 (39.2) 76 (31.0) UICC/AJCC/WHO 2010 846 .15 .15 IA 266 103 (38.7) 163 (61.3) 106 (39.8) 81 (30.5) 79 (29.7) IB 141 58 (41.1) 83 (58.9) 56 (39.7) 36 (25.5) 49 (34.7) IIA 68 36 (52.9) 32 (47.1) 26 (38.2) 17 (25.0) 25 (36.8) IIB 109 52 (47.7) 57 (52.3) 34 (31.2) 36 (33.0) 39 (35.8) III 43 17 (39.5) 26 (60.5) 17 (39.5) 16 (37.2) 10 (23.3) IV 219 105 (47.9) 114 (52.1) 67 (30.6) 86 (39.3) 66 (30.1) * Continuous data were described as the mean and standard deviation (SD) or median and 25th to 75th percentiles and were compared by Kruskall–Wallis tests. Categorical data were described as counts and per -centages and were compared by x 2 tests. All statistical tests were two-sided. AJCC = American Joint Cancer Committee; ENETS = European Neuroendocrine Tumor Society; PDEC = poorly differentiated endocrine carcinoma (WHO 2000 Class 3); UICC = International Union for Cancer Control; WDEC = well-differentiated endocrine carcinoma (WHO 2000 Class 2); WDET = well-differentiated endocrine tumor (WHO 2000 Class 1); WHO = World Health Organization. † Other rare syndromes include those with unregulated production of adrenocorticotropic hormone, calcitonin, ghrelin, growth hormone–releasing factor, parathyroid hormone, or somatostatin. ‡ Definitions in accordance with Solcia et al. ( 18 ). § Mitotic count was expressed as per 10 high power field and Ki67 index as a percentage of 2000 cells ( 3 ). Table 2 (Continued).
The distribution of the type of syndrome was independent of sex, although it was statistically significantly dependent on age (P = .04), for which insulinomas and Zollinger–Ellison syndrome/ gastrinomas were more frequent among younger vs older patients and glucagonomas and serotonin-producing “carcinoid” more frequent among older vs younger patients. The tumor site was differently distributed between the sexes (P < .001) and age groups (P = .02), with the entire organ involvement being more frequently observed among females and younger patients. Curative surgery more likely occurred in females (P < .001), though with no statis-tically significant difference by age. Along the same lines, the type of surgery performed was differently distributed among the sexes. Finally, male patients proved to have statistically significantly larger tumor size (P = .03), higher WHO 2000 class (P < .001), Ki67 index (P < .001), ENETS/WHO 2010 grade (P = .006), and stage (P = .03) compared with females. WHO 2000 class and ENETS/WHO 2010 stage was also dependent on age (P = .005 and .03, respectively).
Survival and Staging Systems: Head to Head Comparison A comparison was run on the series with or without high-grade
neoplasms, as required by UICC/AJCC (Table 3 and Supplementary
Table 1, available online). Among 1064 patients, the median time of follow-up was 67 months (25th to 75th percentiles = 30–125); 262 patients died of their cancer, which corresponded to a death rate of 4.5 deaths per 100 persons per year (95% CI = 4.0 to 5.1). The cumulative survival at 5 years was 82.7% (95% CI = 80.0% to 85.2%)
and 73.6% (95% CI = 69.7% to 77.0%) at 10 years (Figure 1, A).
Survival curves for different tumor types show improved survival for insulinoma patients vs patients with other functioning or
non-functioning neoplasms (Figure 1, B and Table 4; for the survival
curves in different types of functioning neoplasm types, see Supplementary Figure 1, available online).
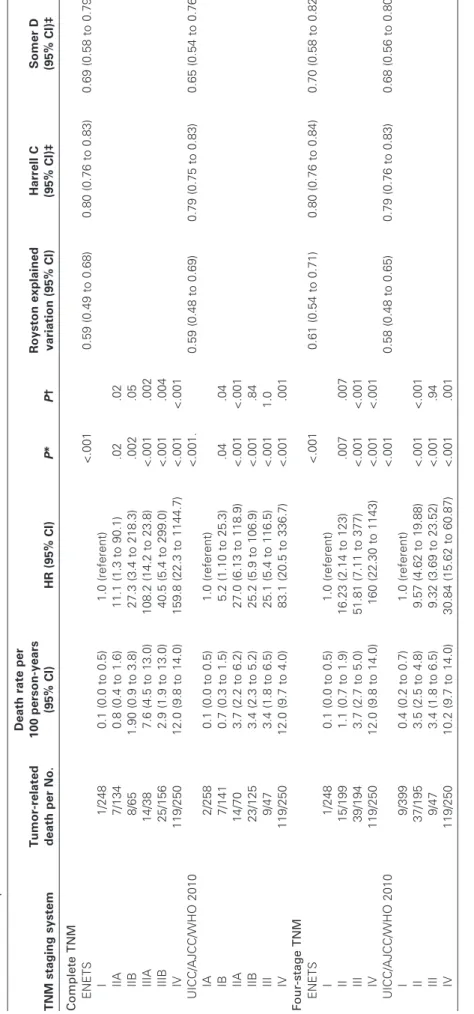
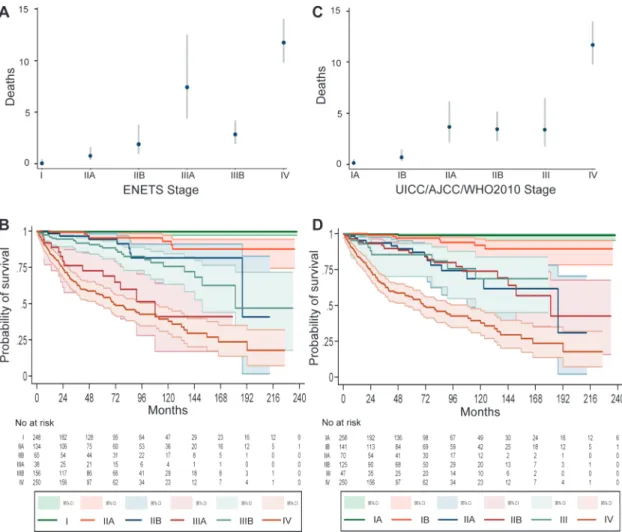
Of 1072 neoplasms, data for 1034 included the ENETS TNM stage and data on the UICC/AJCC/WHO 2010 TNM stage were available for 903 neoplasms. Both TNM staging systems were available in 891 patients and were statistically significantly associ-ated with tumor mortality (P < .001 for both staging systems) (Table 3 and Figure 2). For the ENETS TNM stage, death rates uniformly progressed from class I to IIIA, were lower in class IIIB, increased further in class IV, and statistically significant differences were observed between each subsequent stage, although stages IIA and IIB were not statistically significantly different. Conversely, for UICC/AJCC/WHO 2010 TNM stage, death rates increased from class IA to IIA and remained stable until class III at which point death rates markedly increased in class IV. Statistically significant differences were observed only between stages IA and IB (death rate = 0.1 vs 0.7, respectively; HR of death = 5.25, 95% CI = 1.1 to 25.3, P = .04), stages IB and IIA (death rate = 0.7 and 3.7, respectively; HR of death = 5.1, 95% CI = 2.1 to 12.8, P < .001), and stages III and IV (death rate = 3.4 and 12.0, respectively; HR
of death = 3.3, 95% CI = 1.7 to 6.5, P = .001) (Table 3 and Figure 3).
Grouping stages (for the ENETS system, stages IIA–IIB were grouped in stage II and stages IIIA–IIIB were grouped in stage III; for the UICC/AJCC/WHO 2010 system, stages IA–IB grouped in stage I and stages IIA–IIB in stage II) in four stage classes (I–IV) demonstrated statistically significant and progressive separation in
the four classes by the ENETS TNM (stage I served as the refer-ence; stage II HR of death = 16.23, 95% CI = 2.14 to 123, P = .007; stage III HR of death = 51.81, 95% CI = 7.11 to 377, P < .001; stage IV HR of death = 160, 95% CI = 22.30 to 1143, P < .001) in contrast to the overlap of stages II–III observed when the UICC/ AJCC/WHO 2010 TNM was applied to the same data (stage I served as the reference; stage II HR of death = 9.57, 95% CI = 4.62 to 19.88, P < .001; stage III HR of death = 9.32, 95% CI = 3.69 to 23.53, P = .94; stage IV HR of death = 30.84, 95% CI = 15.62 to
60.87, P < .001) (Table 3 and Figure 3).
The Royston explained variation for prediction of tumor-related death was similar for both TNM systems, indicating good model performance (Royston explained variation for ENETS = 0.59, 95% CI = 0.49 to 0.68 vs UICC/AJCC/WHO 2010 = 0.59,
95% CI = 0.48 to 0.69) (Table 3). Nonetheless, the discrimination
ability for tumor-related death measured by the Harrell C and the Somer D statistics were slightly better for the ENETS TNM relative to the UICC/AJCC/WHO 2010 TNM (Harrell C statistic for ENETS TNM vs UICC/AJCC/WHO 2010 TNM = 0.8 vs 0.79; Somer D statistic for ENETS TNM vs UICC/AJCC/WHO
2010 TNM = 0.69 vs 0.65) (Table 3). The difference in
discrimi-nation ability for tumor-related death between the two TNMs remained similar when high-grade neoplasms were excluded from the analysis, as required by the UICC/AJCC/WHO 2010 TNM (Harrell C statistic for ENETS TNM vs UICC/AJCC/WHO 2010 TNM = 0.79 vs 0.67; Somer D statistic for ENETS TNM vs UICC/AJCC/WHO 2010 TNM = 0.67 vs 0.62) (Supplementary Table 1 available on line). Overlap of the IA–IB and IIA–IIB con-secutive stages was also observed when high-grade neoplasms were excluded from analysis of tumor-related, death and UICC/AJCC/ WHO 2010 TNM vs the ENETS TNM Harrell C and Somer D statistics values also remained similar when compared with analyses that included high-grade neoplasms (Supplementary Table 1 and Supplementary Figure 2, available online). When high-grade neoplasms were excluded from the analysis, the differ-ence in discriminatory ability for tumor-related death of the two TNMs was further confirmed when stages were grouped into four classes and the Harrel C and Somer D statistics were calculated (stages I–IV: ENETS TNM vs UICC/AJCC/WHO 2010 Harrell C statistic = 0.78 vs 0.77; Somer D statistic = 0.63 vs 0.60) (Supplementary Table 1 and Supplementary Figure 3, available online).
Further sensitivity analyses of the role of both TNM staging systems on tumor-free survival were performed for each center separately, and with Cox models stratified by study center, age, and/or sex (data not shown). All tests provided results consistent with those observed for the whole series, and, although with higher variability, the ENETS TNM staging system proved to be more sensitive in predicting tumor-free survival when compared with the UICC/AIJCC/WHO 2010 TNM system. Furthermore, a sensitivity analysis on the role of both tumor staging systems on
overall survival gave results comparable with those of Table 3,
with similar Royston explained variation for prediction of tumor-related death for both TNM systems and slightly better discrim-ination ability measured by the Harrell C and the Somer D statistics for the ENETS system (Supplementary Table 2, avail-able online).
Table 3. Comparison of tumor-related death among 891 patients using the European Neuroendocrine Tumor Society (ENETS) vs the International Union for Cancer Control/American Joint Cancer Committee/World Health Organization (UICC/AJCC/WHO) 2010 TNM staging systems including four tumor stages for pancreatic neuroendocrine neoplasms TNM staging system Tumor-related death per No. Death rate per 100 person-years (95% CI) HR (95% CI) P * P † Royston explained variation (95% CI) Harrell C (95% CI)‡ Somer D (95% CI)‡ Complete TNM ENETS <.001 0.59 (0.49 to 0.68) 0.80 (0.76 to 0.83) 0.69 (0.58 to 0.79) I 1/248 0.1 (0.0 to 0.5) 1.0 (referent) IIA 7/134 0.8 (0.4 to 1.6) 11.1 (1.3 to 90.1) .02 .02 IIB 8/65 1.90 (0.9 to 3.8) 27.3 (3.4 to 218.3) .002 .05 IIIA 14/38 7.6 (4.5 to 13.0) 108.2 (14.2 to 23.8) <.001 .002 IIIB 25/156 2.9 (1.9 to 13.0) 40.5 (5.4 to 299.0) <.001 .004 IV 119/250 12.0 (9.8 to 14.0) 159.8 (22.3 to 1144.7) <.001 <.001 UICC/AJCC/WHO 2010 <.001. 0.59 (0.48 to 0.69) 0.79 (0.75 to 0.83) 0.65 (0.54 to 0.76) IA 2/258 0.1 (0.0 to 0.5) 1.0 (referent) IB 7/141 0.7 (0.3 to 1.5) 5.2 (1.10 to 25.3) .04 .04 IIA 14/70 3.7 (2.2 to 6.2) 27.0 (6.13 to 118.9) <.001 <.001 IIB 23/125 3.4 (2.3 to 5.2) 25.2 (5.9 to 106.9) <.001 .84 III 9/47 3.4 (1.8 to 6.5) 25.1 (5.4 to 116.5) <.001 1.0 IV 119/250 12.0 (9.7 to 4.0) 83.1 (20.5 to 336.7) <.001 .001 Four-stage TNM ENETS <.001 0.61 (0.54 to 0.71) 0.80 (0.76 to 0.84) 0.70 (0.58 to 0.82) I 1/248 0.1 (0.0 to 0.5) 1.0 (referent) II 15/199 1.1 (0.7 to 1.9) 16.23 (2.14 to 123) .007 .007 III 39/194 3.7 (2.7 to 5.0) 51.81 (7.11 to 377) <.001 <.001 IV 119/250 12.0 (9.8 to 14.0) 160 (22.30 to 1143) <.001 <.001 UICC/AJCC/WHO 2010 <.001 0.58 (0.48 to 0.65) 0.79 (0.76 to 0.83) 0.68 (0.56 to 0.80) I 9/399 0.4 (0.2 to 0.7) 1.0 (referent) II 37/195 3.5 (2.5 to 4.8) 9.57 (4.62 to 19.88) <.001 <.001 III 9/47 3.4 (1.8 to 6.5) 9.32 (3.69 to 23.52) <.001 .94 IV 119/250 10.2 (9.7 to 14.0) 30.84 (15.62 to 60.87) <.001 .001 * Cox models were used to calculate two-sided P values with stage I or IA as the reference for the ENETS and UICC/AJCC/WHO TNM classification systems, respectively. CI = confidence interval; HR = hazard ratio. † Cox models were used to calculate two-sided P values with the previous stage as the reference. ‡ Comparison of model performance was done informally.
Predictors of Tumor-Related Death: Cutoff Identification and Univariable Analysis
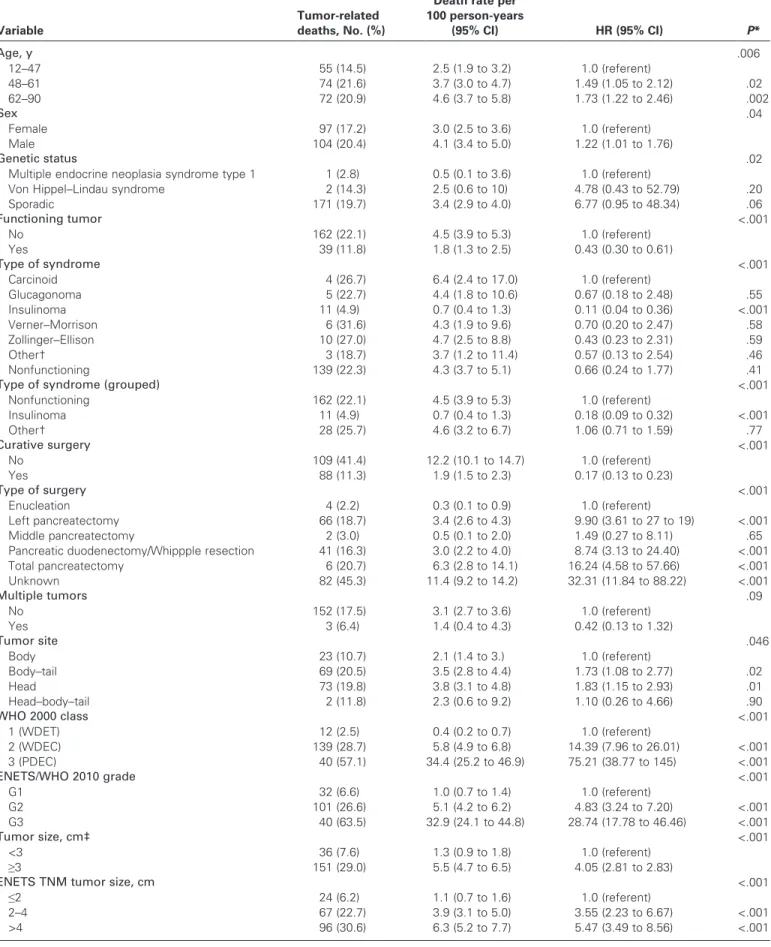
The relationship between potential risk factors and tumor-related death and corresponding mortality rates were investigated. In ROC analysis, optimal cutoffs for prediction of tumor-related death at 5 years were identified for size (≥3 cm, ROC-AUC = 0.65), number of positive lymph nodes (≥1, AUC = 0.67), number of mitoses (≥2, AUC = 0.77), and Ki67 index (≥4.85, AUC = 0.81) (Table 4). The association of each dichotomized marker and tumor-related death was assessed during the long-term follow-up in the test sample. Their performance was suboptimal for size (Harrell C statistic = 0.61, 95% CI = 0.56 to 0.66), number of positive lymph nodes (Harrell C statistic = 0.68, 95% CI = 0.62 to 0.65), and number of mitoses (Harrell C statistic = 0.68, 95% CI = 0.61 to 0.76), whereas performance was relatively better for Ki67 index (Harrell C statistic = 0.73, 95% CI = 0.68 to 0.78).
With the exception of the multiple tumors variable, all predic-tors were statistically significantly associated with tumor-related
death at follow-up (Table 4). Specifically, death rates were higher
for older vs younger patients (death rate for older patients = 4.6, 95% CI = 3.7 to 5.8 vs death rate for younger patients = 2.5, 95% CI = 1.9 to 3.2), males vs females (death rate for males = 4.1, 95% CI = 3.4 to 5.0 vs death rate for females = 3.0, 95% CI = 2.5 to 3.6), sporadic vs non-sporadic tumors (death rate for sporadic tumors = 3.4, 95% CI = 2.9 to 4.0 vs death rate for non-sporadic tumors with multiple endocrine neoplasia syndrome type I = 0.5, 95% CI = 0.1 to 3.6 and with Von Hippel-Lindau syndrome = 2.5, 95% CI = 0.6 to 10), and nonfunctioning vs functioning tumors (death rate for non-functioning tumors = 4.5, 95% CI = 3.9 to 5.3 vs death rate for
functioning tumors = 1.8, 95% CI = 1.3 to 2.5; Table 4). Among
func-tioning tumors, the lowest death rate was observed for insulinomas (death rate = 0.7, 95% CI = 0.4 to 1.3), the highest for neoplasms asso-ciated with the carcinoid syndrome (death rate = 6.4, 95% CI = 2.4 to
17.0) (Table 4). Death rates were also relatively higher when curative
surgery could not be performed, when a single tumor was present, and when the tumor involved the head of the pancreas. The death rate
increased as WHO 2000 class, ENETS/WHO 2010 grade (Figure 4),
tumor size, number of positive lymph nodes, mitotic cell counts, or Ki67 index increased (Supplementary Figure 4, available online). Predictors of Tumor-Related Death: Multivariable Analysis Although statistically significant at univariable analysis, mitotic cell counts and number of lymph nodes yielded too many missing values and were not considered for the multivariable analysis. Given the high collinearity between WHO 2000 class and stage on the one hand, and between Ki67 index and ENETS/WHO 2010 grade (in both cases largely expected) on the other, six non-nested multivariable models were fitted (models 1.1, 1.2, 2.1, 2.2, 3.1, and 3.2), including the ENETS and UICC/AJCC/WHO 2010 TNM
stages and the noncollinear predictors (Table 5; for details on the
risk associated with each category of the considered predictors per multivariable model, see Supplementary Table 3, available online). It was expected that the optimal model would provide the highest explained variation, shrinkage coefficient, and the Harrell C statistic, and the lowest Akaike information criterion.
All models performed remarkably well, with well-explained variations, a high shrinkage coefficient, and optimal discrimination (both by Harrell C and graphically), the best performance being observed for both models with the ENETS TNM stage (model 1.1, Akaike Information Criterion = 1357.85; Royston explained variation = 0.77, 95% CI = 0.74 to 0.8; shrinkage coefficient = 0.93; Harrell C statistic = 0.88; model 1.2 Akaike Information Criterion = 1360.48; Royston explained variation = 0.75, 95% CI = 0.69 to
0.84; shrinkage coefficient = 0.93, Harrell C statistic = 0.87) (Table 5)
also including either the ENETS-WHO 2010 grade or Ki67 index. ENETS stage, UICC/AJCC/WHO 2010 stage, curative surgery, ENETS/WHO 2010 grade, and Ki67 index were consis-tently identified as independent predictors of the outcome in the six models (Supplementary Table 3, available online). However, when considering the variable “stage,” the UICC/AJCC/WHO 2010 TNM displayed unusually elevated hazard ratios of death with extremely wide 95% confidence intervals (model 2.1: stage IB HR = 6.04, 95% CI = 0.6 to 52.52, P = .10; stage IIA HR = 23.86, 95% CI = 2.87 to 198.57, P = .003; stage IIB HR = 24.64, 95% CI = 3.06 to 198.58, P = .003; stage III HR = 21.46, 95% CI = 2.47 Figure 1. Kaplan–Meier survival curves for pancreatic neuroendocrine
neoplasms (n = 1064) overall and by functioning status. A) The Kaplan– Meier survival curve is shown with the number of patients at risk. B) The neoplasms were grouped by functioning status, and Kaplan–Meier survival was calculated. Continous 95% confidence intervals are shown. The number of patients at risk is given below the graph. INS = insulinoma, NON = nonfunctioning neoplasms, OTH = other rare syndromes include those with unregulated production of adrenocorticotropic hormone, calcitonin, ghrelin, growth hormone–releasing factor, parathyroid hormone, or somatostatin.
Table 4. Other predictors of tumor-related death among 891 patients with pancreatic neuroendocrine neoplasms for whom data was available
Variable
Tumor-related deaths, No. (%)
Death rate per 100 person-years (95% CI) HR (95% CI) P* Age, y .006 12–47 55 (14.5) 2.5 (1.9 to 3.2) 1.0 (referent) 48–61 74 (21.6) 3.7 (3.0 to 4.7) 1.49 (1.05 to 2.12) .02 62–90 72 (20.9) 4.6 (3.7 to 5.8) 1.73 (1.22 to 2.46) .002 Sex .04 Female 97 (17.2) 3.0 (2.5 to 3.6) 1.0 (referent) Male 104 (20.4) 4.1 (3.4 to 5.0) 1.22 (1.01 to 1.76) Genetic status .02
Multiple endocrine neoplasia syndrome type 1 1 (2.8) 0.5 (0.1 to 3.6) 1.0 (referent)
Von Hippel–Lindau syndrome 2 (14.3) 2.5 (0.6 to 10) 4.78 (0.43 to 52.79) .20
Sporadic 171 (19.7) 3.4 (2.9 to 4.0) 6.77 (0.95 to 48.34) .06 Functioning tumor <.001 No 162 (22.1) 4.5 (3.9 to 5.3) 1.0 (referent) Yes 39 (11.8) 1.8 (1.3 to 2.5) 0.43 (0.30 to 0.61) Type of syndrome <.001 Carcinoid 4 (26.7) 6.4 (2.4 to 17.0) 1.0 (referent) Glucagonoma 5 (22.7) 4.4 (1.8 to 10.6) 0.67 (0.18 to 2.48) .55 Insulinoma 11 (4.9) 0.7 (0.4 to 1.3) 0.11 (0.04 to 0.36) <.001 Verner–Morrison 6 (31.6) 4.3 (1.9 to 9.6) 0.70 (0.20 to 2.47) .58 Zollinger–Ellison 10 (27.0) 4.7 (2.5 to 8.8) 0.43 (0.23 to 2.31) .59 Other† 3 (18.7) 3.7 (1.2 to 11.4) 0.57 (0.13 to 2.54) .46 Nonfunctioning 139 (22.3) 4.3 (3.7 to 5.1) 0.66 (0.24 to 1.77) .41
Type of syndrome (grouped) <.001
Nonfunctioning 162 (22.1) 4.5 (3.9 to 5.3) 1.0 (referent) Insulinoma 11 (4.9) 0.7 (0.4 to 1.3) 0.18 (0.09 to 0.32) <.001 Other† 28 (25.7) 4.6 (3.2 to 6.7) 1.06 (0.71 to 1.59) .77 Curative surgery <.001 No 109 (41.4) 12.2 (10.1 to 14.7) 1.0 (referent) Yes 88 (11.3) 1.9 (1.5 to 2.3) 0.17 (0.13 to 0.23) Type of surgery <.001 Enucleation 4 (2.2) 0.3 (0.1 to 0.9) 1.0 (referent) Left pancreatectomy 66 (18.7) 3.4 (2.6 to 4.3) 9.90 (3.61 to 27 to 19) <.001 Middle pancreatectomy 2 (3.0) 0.5 (0.1 to 2.0) 1.49 (0.27 to 8.11) .65
Pancreatic duodenectomy/Whippple resection 41 (16.3) 3.0 (2.2 to 4.0) 8.74 (3.13 to 24.40) <.001
Total pancreatectomy 6 (20.7) 6.3 (2.8 to 14.1) 16.24 (4.58 to 57.66) <.001 Unknown 82 (45.3) 11.4 (9.2 to 14.2) 32.31 (11.84 to 88.22) <.001 Multiple tumors .09 No 152 (17.5) 3.1 (2.7 to 3.6) 1.0 (referent) Yes 3 (6.4) 1.4 (0.4 to 4.3) 0.42 (0.13 to 1.32) Tumor site .046 Body 23 (10.7) 2.1 (1.4 to 3.) 1.0 (referent) Body–tail 69 (20.5) 3.5 (2.8 to 4.4) 1.73 (1.08 to 2.77) .02 Head 73 (19.8) 3.8 (3.1 to 4.8) 1.83 (1.15 to 2.93) .01 Head–body–tail 2 (11.8) 2.3 (0.6 to 9.2) 1.10 (0.26 to 4.66) .90 WHO 2000 class <.001 1 (WDET) 12 (2.5) 0.4 (0.2 to 0.7) 1.0 (referent) 2 (WDEC) 139 (28.7) 5.8 (4.9 to 6.8) 14.39 (7.96 to 26.01) <.001 3 (PDEC) 40 (57.1) 34.4 (25.2 to 46.9) 75.21 (38.77 to 145) <.001 ENETS/WHO 2010 grade <.001 G1 32 (6.6) 1.0 (0.7 to 1.4) 1.0 (referent) G2 101 (26.6) 5.1 (4.2 to 6.2) 4.83 (3.24 to 7.20) <.001 G3 40 (63.5) 32.9 (24.1 to 44.8) 28.74 (17.78 to 46.46) <.001 Tumor size, cm‡ <.001 <3 36 (7.6) 1.3 (0.9 to 1.8) 1.0 (referent) ≥3 151 (29.0) 5.5 (4.7 to 6.5) 4.05 (2.81 to 2.83)
ENETS TNM tumor size, cm <.001
≤2 24 (6.2) 1.1 (0.7 to 1.6) 1.0 (referent)
2–4 67 (22.7) 3.9 (3.1 to 5.0) 3.55 (2.23 to 6.67) <.001
>4 96 (30.6) 6.3 (5.2 to 7.7) 5.47 (3.49 to 8.56) <.001
to 186.53, P = .005; stage IV HR = 65.46, 95% CI = 8.17 to 524.55,
P = 0; model 2.2: stage IB HR = 6.38, 95% CI = 0.74 to 55.06, P = .09; stage IIA HR = 22.40, 95% CI = 2.74 to 183.35, P = .004;
stage IIB HR = 23.27, 95% CI = 2.93 to 184.80, P = .003; stage III HR = 24.29, 95% CI = 2.88 to 205.17, P = .003; stage IV HR = 55.62, 95% CI = 7.03 to 439.85, P = .000), thus indicating an imprecise predictive ability. When considering the variable grade or Ki67 index, the two-tiered system for Ki67 index with the cutoff value defined by the ROC curve (<4.85 vs ≥4.85) were independent predictors of survival in all fitted models (models 1.2, 2.2, and 3.2). Conversely, statistically significant separation between the three ENETS grades was observed only in model 3.1 which did not include the stage variable, thus indicating its efficacy in the absence of staging information (stage G2 HR = 6.18, 95% CI = 2.84 to 13.45, P = .02; stage G3 HR = 5.84, 95% CI = 1.95 to 15.43,
P = .001).
Discussion
TNM staging represents a simple and accurate instrument for death-risk assessment and patient management at diagnosis, provided, it accurately reflects the biology and natural history of the cancer for which it was designed. Evidence is essential for
TNM development (22), and this is dramatically true for rare
“orphan” cancers (23). We tested two TNM staging systems to
determine which was superior in terms of performance when a large series of pancreatic neuroendocrine neoplasms was used. All results were resistant to a series of sensitivity analyses.
Our data indicate that the ENETS TNM is superior in perfor-mance to the UICC/AJCC/WHO 2010 TNM and is more accu-rate. We observed some differences in distribution of sex and age across the ENETS staging system, whereas this was not observed for the UICC/AJCC/WHO 2010 TNM. Cox regression analysis showed that only the ENETS TNM perfectly allocated patients in four risk groups that were statistically significantly different for death risk and almost equally populated, whereas the UICC/AJCC/ WHO 2010 TNM compressed the disease into three differently populated classes with most patients being in stage I, in the equally populated stages II and III (which were similar in terms of death risk) and in stage IV. Furthermore, multivariable modeling demon-strated that although both TNM systems’ stages resulted in inde-pendent predictors of survival, the UICC/AJCC/WHO 2010 TNM stages consistently showed very large 95% confidence inter-vals per stage, indicating its inconsistent prediction ability. This latter observation deserves one further comment. The fact that the UICC/AJCC/WHO 2010 TNM staging results an independent predictor of survival at multivariable analysis indicates that mea-suring the cancer extent is per se relevant, as confirmed by a recent
single series investigation (14). This does not necessarily translate
into an effective description of cancer course, as demonstrated here. Building a TNM system requires the use of parameters proven as important for treatment-aimed patient stratification. This appears not to be the case for the UICC/AJCC/WHO 2010 TNM, fitting more the aggressive course of ductal adenocarcinoma (smaller size and early invasion of nearby tissues/vessels) rather than the slow malignant pace of neuroendocrine neoplasms (larger Variable
Tumor-related deaths, No. (%)
Death rate per 100 person-years
(95% CI) HR (95% CI) P*
Positive lymph nodes‡ <.001
<1 35 (8.1) 1.3 (0.9 to 1.8) 1.0 (referent) ≥1 73 (27.6) 5.3 (4.2 to 6.7) 4.03 (2.69 to 6.05) Mitotic count‡ <.001 <2 28 (10.8) 1.3 (0.9 to 2.0) 1.0 (referent) ≥2 52 (32.5) 5.9 (4.5 to 7.8) 4.30 (2.69 to 6.87) Ki67 index‡ <.001 <4.8 48 (8.3) 1.3 (1.0 to 1.7) 1.0 (referent) ≥4.8 124 (40.0) 9.5 (8.0 to 11.3) 6.81 (4.87 to 9.54) Ki67 (ENETS/WHO 2010) <.001 0–2 38 (8.0) 1.2 (0.9 to 1.7) 1.0 (referent) >2–20 96 (27.5) 5.4 (4.4 to 6.6) 4.25 (2.92 to 6.21) <.001 >20 38 (64.5) 33.9 (24.7 to 46.6) 24.64 (15.46 to 39.26) <.001 Ki67 modified§ <.001 0–5 69 (10.6) 1.7 (1.3 to 2.2) 1.0 (referent) >5–20 65 (37.1) 8.1 (6.3 to 10.3) 4.56 (3.24 to 6.43) <.001 >20 38 (64.4) 33.9 (24.7 to 46.6) 18.02 (12.92 to 27.24) <.001
* Two-sided Cox univariable analysis was done. CI = confidence interval; ENETS = European Neuroendocrine Tumor Society; HR = hazard ratio; PDEC = poorly differentiated endocrine carcinoma (WHO 2000 Class 3); WDEC = well-differentiated endocrine carcinoma (WHO 2000 Class 2); WDET = well-differentiated endocrine tumor (WHO 2000 Class 1); WHO = World Health Organization.
† Other rare syndromes include those with unregulated production of adrenocorticotropic hormone, calcitonin, ghrelin, growth hormone–releasing factor, parathy-roid hormone, or somatostatin.
‡ Cutoff values derived from the receiver operating curve analysis identifying the optimal cutoff for predicting 5-year tumor mortality. The Ki67 index was calculated as a percentage of 2000 cells that stained positively for Ki67 (3).
§ Modifications to the Ki67 staining analysis were in accordance with that of Scarpa et al. (12) with grading definitions as G1 = ≤5%, G2 = >5–20%, and G3 = >20%.
size, rare invasion, and late course to metastasis) (24). Indeed, the perfect patient stratification in four risk classes by the ENETS TNM allows for the progressive approach to more aggressive
treatment options, as supported by current guidelines (25–27).
Ki67 grading is a useful instrument for the management of
patients with neuroendocrine tumors (27). The ENETS/WHO
2010 grade and a two-step proliferation grading by Ki67 were independent predictors of outcome in a multivariable analysis, confirming previously published analysis of single institution series
(9,10,28) and strongly supporting the adoption of the recent
WHO 2010 classification (17). Of note, the WHO grading
acquires outmost efficacy in the absence of staging information, supporting its use for small biopsy analysis and in the absence of other clinical information, which is a frequent event in daily pathology practice. The recent proposal of 5% Ki67 as cutoff for
G1 (12) fits our finding of 4.8% Ki67 at analysis of data under the
ROC curve. However, the substantial efficacy overlap of both systems observed in this series does not justify a change in the current WHO grading, which is otherwise meant for all sites of the
gut. In view of the large range for G2 grading (3% to <20%), as defined by the ENETS-WHO 2010 grading, this finding suggests 5% as the actual border for the more aggressive disease. This other piece of information may result in more accurate tailoring of therapy to the individual patient.
Potentially curative surgery resulted also in an independent predictor of outcome at multivariable analysis in the present series. This observation strongly supports the adoption of aggressive strategies for curative surgery in the treatment of neuroendocrine
neoplasms of the pancreas, as previously emphasized (29). It may
be interpreted consequently that a more aggressive surgical attitude should be pursued even for small size (≤2 cm) lesions, especially in the sporadic setting. Along these lines, the ROC curve analysis for size identified 3 cm as a possible cutoff for more aggressive disease, in part supporting previous observation made on the basis of a
limited case series (9,10,12). Caution should be used, however,
in interpreting the effect of treatment in an observational study. A higher malignancy of the tumor might in fact hamper the use or success of surgery.
Figure 2. Death incidence and survival by European Neuroendocrine Tumor Society (ENETS) and the International Union for Cancer Control/American Joint Cancer Committee/World Health Organization (UICC/AJCC/WHO) 2010 TNM staging systems. A) Tumor-related death incidence for 891 patients by ENETS stage is shown with 95% confidence intervals (error bars). B) Kaplan–Meier survival curves for patients (n = 891) by ENETS TNM stage. Continous 95% confidence
intervals are shown. The number of patients at risk is given below the curve. C) Tumor-related death incidence for 891 patients by AJCC/ UICC/WHO 2010 TNM stage is shown with 95% confidence intervals (error bars). D) Kaplan–Meier survival curves for patients (n = 891) by AJCC/UICC/WHO 2010 TNM stage. Continous 95% confidence inter-vals are shown. The number of patients at risk is given below the curve.
Figure 3. Death incidence and survival by European Neuroendocrine Tumor Society (ENETS) and the International Union for Cancer Control/ American Joint Cancer Committee/World Health Organization (UICC/ AJCC/WHO) 2010 TNM staging systems when stages were grouped into four classes. A) Tumor-related death incidence for 891 patients by ENETS stage is shown with 95% confidence intervals (error bars). B) Kaplan–Meier survival curves for patients (n = 891) by ENETS TNM
stage. Continuous 95% confidence intervals are shown. The number of patients at risk is given below the curve. C) Tumor-related death inci-dence for 891 patients by AJCC/UICC/WHO 2010 TNM stage is shown with 95% confidence intervals (error bars). D) Kaplan–Meier survival curves for patients (n = 891) by AJCC/UICC/WHO 2010 TNM stage. Continuous 95% confidence intervals are shown. The number of patients at risk is given below the curve.
Figure 4. Kaplan–Meier survival curves of 926 neoplasms by the European Neuroendocrine Tumor Society /World Health Organization 2010 grade. Continuous 95% confidence intervals are shown. The number of patients at risk is given below the curve.
The cutoff number of lymph nodes identified as potentially being associated with adverse survival, as identified by ROC curve analysis, was one. This indicates that a single lymph node metasta-sis is per se a clinically significant adverse event. However, the ENETS TNM stage IIIB (any T, N1, M0) unexpectedly identified patients with better fare than patients in Stage IIIA (T4, N0, M0). This could be explained by size differences of the two patient groups (N.39 for IIIA and N.156 for IIIB), or by differences in surgical techniques and lymph node sampling, or may simply indicate that T4 is per se a more adverse parameter than N1.
Alternatively, given the T definition (see Table 1), stage IIIA may
well contain a large number of patients not amenable to curative surgery. These observations suggest the need for TNM
adjust-ment as recently proposed (12). Along these lines and more
impor-tantly, when grouped into a single stage III class, the separation in risk group was statistically significant and progressive, confirming the efficacy of the ENETS TNM staging. Thus, a simplification
of the ENETS staging system into four single stage classes only is suggested. In contrast, the UICC/AJCC/WHO 2010 TNM stage system was unable to separate intermediate groups, possibly because of the extremely broad T definition of stages IIA and IIB.
Other interesting findings emerged by the descriptive and uni-variable analysis of this series, specifically, the overall good perfor-mance of neuroendocrine neoplasm patients with net separation of insulinomas and the substantial course overlap of nonfunctioning and other non-insulinoma functioning neoplasms. This corre-sponds with the somehow unique signature of insulinomas as
compared with other pancreas neoplasms (9,30). The same applies
for high-grade G3 neoplasms, which, similar to the few published series, fare the worst and represent a minority of patients (ie, less
than 10% of this series) (24,31,32). The most typical profile of the
patient with sporadic neuroendocrine neoplasm is male and of the 6th decade, whereas younger female are patients with familial (most likely multiple endocrine neoplasia syndrome type 1) disease. Adverse features observed were being male, older age, non-curative surgery, and sporadic nonfunctioning neoplasms, again confirming previously reported data from the registry and single institution
series (11,12,28).
This cohort is the largest ever published on neuroendocrine neoplasms of the pancreas listing such detailed information to our knowledge. This series results from the retrospective collection of neoplastic tissues obtained at surgery from 11 European Insti-tutions known as referral centers for oncology, endocrinology, gastroenterology/pancreatology, and pancreas surgery for neuro-endocrine neoplasm patients. To reduce the various selection bias expected and to reflect on the daily clinical practice, our strategy was to collect data representing all settings of presentation/cure of this type of patient. Certainly, and this is largely expected, the most obvious and positive effect is the overall elevated survival observed here at 5 and 10 years, likely depending on a mixture of early diagnosis, accurate surgery, tailored medical therapy, and effective follow-up. The combination of such positive features goes along with what is recommended for the cure of rare cancer disease and for neuroendocrine neoplasms specifically. Along these lines, the widespread adoption of common guidelines based on the WHO classification together with the universal health system in European countries may both explain the overall excellent survival reported here.
The major limitation of this study is its retrospective nature, which implies some degree of variation in collecting relevant data. For example, surgical techniques and lymph node sampling may slightly vary among different institutions and surgical teams, potentially resulting in different nodal status definition. Also, the interpretation of Ki67 staining of cancer cells may slightly vary in different pathology laboratories and by the pathologists’ expertise, leading to differential proliferation grading assessments. Additionally, variability in treatment at different centers may have influenced patient survival. Collection of relevant data in a large prospective series with uniform protocols for data entry is needed to confirm our findings.
In conclusion, neuroendocrine cancer patient survival depends on multiple factors, certainly one of the most important being therapy. Accurate selection of patients for therapy is needed when
the extent of neuroendocrine cancer disease is measured (33). This
Table 5. Performance of multivariable Cox models for predicting endocrine pancreatic neoplasm tumor-related death* Model characteristics Model 1.1 Model 1.2 Model 2.1 Model 2.2 Model 3.1 Model 3.2 Variable ENETS stage* ENETS stage* UICC/AJCC/WHO 2010 stage* UICC/AJCC/WHO 2010 stage* WHO 2000 class* WHO 2000 class* Age Age Age Age Age Age Sex Sex Sex Sex Sex Sex Genetic status Genetic status Genetic status Genetic status Genetic status Genetic status Functioning tumor Functioning tumor Functioning tumor Functioning tumor Functioning tumor Functioning tumor Curative surgery* Curative surgery* Curative surgery* Curative surgery* Curative surgery* Curative surgery* Multiple lesions Multiple lesions Multiple lesions Multiple lesions Multiple lesions Multiple lesions Tumor site Tumor site Tumor site Tumor site Tumor site Tumor site ENETS/WHO 2010 grade* Ki67 index* ENETS/WHO 2010 grade* Ki67 index* ENETS/WHO 2010 grade* Ki67 index* Tumor size Tumor size Tumor size Tumor size Tumor size Tumor size Akaike information criterion 1356.5 1359.9 1361.9 1368.4 1393.1 1374.0 Royston explained variation (95% CI) 0.77 (0.73 to 0.86) 0.75 (0.69 to 0.86) 0.76 (0.71 to 0.86) 0.73 (0.68 to 0.85) 0.72 (0.68 to 0.85) 0.73 (0.66 to 0.86) Shrinkage coefficient 0.93 0.93 0.93 0.93 0.93 0.94 Harrell C statistic (95% CI) 0.88 (0.85 to 0.90) 0.87 (0.85 to 0.90) 0.88 (0.85 to 0.90) 0.87 (0.85 to 0.90) 0.86 (0.83 to 0.89) 0.86 (0.83 to 0.89) Graphical Discrimination Optimal Optimal Optimal Optimal Optimal Optimal * Independent predictors with two-sided P of less than .05 are indicated. Cut-points for the multivariable models: ENETS stage (I–IV), age (12–47, 48–61, or 62–90 y), sex (male or female), genetic status (multiple endocrine neoplasia syndrome type 1, Von Hippel–Lindau syndrome, or sporadic), functioning tumor (yes or no), curative surgery (yes or no), multiple lesions (yes or no), site (body, body–tail, head, or head–body– tail), Ki67 index (<4.8 or ≥4.8 cm), and tumor size (<3 or ≥3 cm) were included. CI = confidence interval; ENETS = European Neuroendocrine Tumor Society; UICC/AJCC/WHO = International Union for Cancer Control/American Joint Cancer Committee/World Health Organization.
can be achieved only by accurate surgical staging. Our data suggest the ENETS TNM staging system as superior and support its use in current clinical practice.
References
1. Yao JC, Hassan M, Phan A, et al. One hundred years after “carcinoid”: epidemiology of and prognostic factors for neuroendocrine tumors in 35,825 cases in the United States. J Clin Oncol. 2008;26(18):3063–3072. 2. Modlin IM, Moss SF, Chung DC, et al. Priorities for improving the
man-agement of gastroenteropancreatic neuroendocrine tumors. J Natl Cancer
Inst. 2008;100(18):1282–1289.
3. Rindi G, Kloppel G, Alhman H, et al. TNM staging of foregut (neuro) endocrine tumors: a consensus proposal including a grading system.
Virchows Arch. 2006;449(4):395–401.
4. Sobin L, Gospodarowicz M, Wittekind C. TNM Classification of Malignant
Tumours. 7th ed. Bognor Regis, UK: Wiley Blackwell; 2009.
5. Edge SB, Byrd DR, Compton CC, et al. AJCC Cancer Staging Manual. New York, NY: Springer; 2010.
6. Bosman F, Carneiro F, Hruban RH, et al. WHO Classification of Tumours
of the Digestive System. Lyon, France: IARC Press; 2010.
7. Ekeblad S, Skogseid B, Dunder K, et al. Prognostic factors and survival in 324 patients with pancreatic endocrine tumor treated at a single institution.
Clin Cancer Res. 2008;14(23):7798–7803.
8. Fischer L, Kleeff J, Esposito I, et al. Clinical outcome and long-term survival in 118 consecutive patients with neuroendocrine tumours of the pancreas. Br J Surg. 2008;95(5):627–635.
9. La Rosa S, Klersy C, Uccella S, et al. Improved histologic and clinicopath-ologic criteria for prognostic evaluation of pancreatic endocrine tumors.
Hum Pathol. 2009;40(1):30–40.
10. Pape UF, Jann H, Muller-Nordhorn J, et al. Prognostic relevance of a novel TNM classification system for upper gastroenteropancreatic neuro-endocrine tumors. Cancer. 2008;113(2):256–265.
11. Zerbi A, Falconi M, Rindi G, et al. Clinicopathological features of pancre-atic endocrine tumors: a prospective multicenter study in Italy of 297 sporadic cases. Am J Gastroenterol. 2010;105(6):1421–1429.
12. Scarpa A, Mantovani W, Capelli P, et al. Pancreatic endocrine tumors: improved TNM staging and histopathological grading permit a clinically efficient prognostic stratification of patients. Mod Pathol. 2010;23(6): 824–833.
13. Bilimoria KY, Bentrem DJ, Merkow RP, et al. Application of the pancre-atic adenocarcinoma staging system to pancrepancre-atic neuroendocrine tumors.
J Am Coll Surg. 2007;205(4):558–563.
14. Strosberg JR, Cheema A, Weber J, et al. Prognostic validity of a novel American Joint Committee on Cancer Staging Classification for pancreatic neuroendocrine tumors. J Clin Oncol. 2011;29(22):3044–3049.
15. Kloppel G, Rindi G, Perren A, et al. The ENETS and AJCC/UICC TNM classifications of the neuroendocrine tumors of the gastrointestinal tract and the pancreas: a statement. Virchows Archiv. 2010;456(6):595–597. 16. Rossi G, Nannini N, Mengoli MC, et al. Neuroendocrine tumors: what
staging system? Am J Surg Pathol. 2010;34(8):1228–1230.
17. Rindi G, Arnold R, Capella C, et al. Nomenclature and classification of digestive neuroendocrine tumours. In: Bosman F, Carneiro F, Hruban RH, et al., eds. WHO Classification of Tumours of the Digestive System. Lyon, France: IARC Press; 2010:10–12.
18. Solcia E, Klöppel G, Sobin LH. Histological Typing of Endocrine Tumours. 2nd ed. New York, NY: Springer-Verlag; 2000.
19. Newson RB. Comparing the predictive powers of survival models using Harrell’s C or Somers’ D. Stata J. 2010;10(3):339–358.
20. Harrell FE Jr, Lee KL, Mark DB. Multivariable prognostic models: issues in developing models, evaluating assumptions and adequacy, and mea-suring and reducing errors. Stat Med. 1996;15(4):361–387.
21. Akaike H. A new look at the statistical model identification. IEEE Trans
Auto Cont. 1974;19(6):716–723.
22. Quirke P, Cuvelier C, Ensari A, et al. Evidence-based medicine: the time has come to set standards for staging. J Pathol. 2010;221(4):357–360. 23. Modlin IM, Oberg K, Chung DC, et al. Gastroenteropancreatic
neuroen-docrine tumours. Lancet Oncol. 2008;9(1):61–72.
24. Klimstra DS, Arnold R, Capella C, et al. Neuroendocrine neoplasms of the pancreas. In: Bosman F, Carneiro F, Hruban RH, et al., eds. WHO
Classification of Tumours. Lyon, France: IARC; 2010:322–326.
25. Rindi G, de Herder WW, O’Toole D, et al. Consensus guidelines for the management of patients with digestive neuroendocrine tumors: why such guidelines and how we went about It. Neuroendocrinology. 2006;84(3): 155–157.
26. Kulke MH, Anthony LB, Bushnell DL, et al. NANETS treatment guidelines: well-differentiated neuroendocrine tumors of the stomach and pancreas. Pancreas. 2010;39(6):735–752.
27. Oberg K, Jelic S. Neuroendocrine gastroenteropancreatic tumors: ESMO clinical recommendations for diagnosis, treatment and follow-up. Ann
Oncol. 2008;19(suppl 2):ii104–ii105.
28. Bettini R, Boninsegna L, Mantovani W, et al. Prognostic factors at diagnosis and value of WHO classification in a mono-institutional series of 180 non-functioning pancreatic endocrine tumours. Ann Oncol. 2008; 19(5):903–908.
29. Yao JC, Rindi G, Evans DB. Pancreatic neuroendocrine tumors. In: DeVita VT, Lawrence TS, Rosenberg SA, eds. Cancer Principles and
Practice of Oncology. 9th ed. Philadelphia, PA: Wolters-Kluwer/Lippincott
Williams and Wilkins; 2011:1489–1502.
30. Missiaglia E, Dalai I, Barbi S, et al. Pancreatic endocrine tumors: expres-sion profiling evidences a role for AKT-mTOR pathway. J Clin Oncol. 2010;28(2):245–255.
31. Solcia E, Capella C, Klöppel G. Tumours of the Pancreas. 3rd Series ed. Washington, DC: Armed Force Institute of Pathology; 1997.
32. Hruban RH, Pitman MB, Klimstra DS. Tumors of the Pancreas. 4th Series ed. Washington, DC: The American Registry of Pathology and the Armed Force Institute of Pathology; 2007.
33. Rindi G, Wiedenmann B. Neuroendocrine neoplasms of the gut and pancreas: new insights. Nat Rev Endocrinol. 2012;8(1):54–64.
Funding
This work was in part supported by internal research grants from the Università Cattolica del Sacro Cuore (line D1/2010 and 2011 to GR).
Notes
G. Rindi, M. Falconi, and C. Klersy equally contributed to this article. The funders had no role in the study design and data analysis. We are thankful to Ms Elizabeth Zach (European Neuroendocrine Tumor Society, Central Office, Berlin, Germany) for language editing.
Affiliations of authors: Institute of Pathology, Università Cattolica del Sacro Cuore—Histopathology and Cytodiagnosis Unit, Policlinico A. Gemelli 8, Largo A. Gemelli, Rome, Italy (GR); Department of Surgical and Gastroenterological Science (MF, LB) and Department of Pathology and Diagnostics (ASca), University of Verona, Verona, Italy; Service of Biometry & Clinical Epidemiology, Research Department, IRCCS Fondazione Policlinico San Matteo, Pavia, Italy (CK); Pathology Unit, San Raffaele Scientific Institute, Milan, Italy (LA, CD); Department of Surgery, University Hospital Heidelberg, Neu Heidelberg, Germany (MWB, LF); Department of Surgical and Morphological Sciences, Unit of Pathology, University of Insubria, Varese, Italy (CC); Neuroendocrine Tumour Unit, Centre for Gastroenterology, UCL Cancer Institute, University College, Royal Free Hospital, London, UK (MC); Department of Pathology (AC) and Department of Gastroenterology and Pancreatology (PR), Hopital Beaujon, Clichy, France; Department of Digestive and Liver Disease, II School of Medicine, University “La Sapienza”, Sant’Andrea Hospital, Rome, Italy (GDF); Department of Surgery (GF) and Department of Pathology (TVL), Royal Free Hospital, London, UK; Department of Medicine (WWdH) and Department of Pathology (RRdK), Erasmus University Medical Center Rotterdam, CE Rotterdam, the Netherlands; Department of Hepatology and Gastroenterology, Charité, Campus Virchow Klinikum, University Medicine Berlin, Berlin, Germany (HJ, UP, BW); Institute of Pathology, Stadtspital Triemli, Zurich, Switzerland (PK); Department of Pathology, Ospedale di Circolo, Varese, Italy (SLR); Institute of Pathology, University of Bern, Bern, Switzerland (AP, ASch); ARC-NET Research Center, University of Verona, Verona, Italy (ASca); Department of Pathology and Human Genetics, University of Pavia, Pavia, Italy (ES).