Tissue microarray technology for high-throughput molecular profiling of cancer
6
0
0
Texte intégral
(2) 658. Human Molecular Genetics, 2001, Vol. 10, No. 7. Figure 1. Principle of TMA analysis. Cylindrical core biopsies are obtained from up to 1000 individual, formalin-fixed, paraffin-embedded tissue blocks. These are transferred to a TMA block. Multiple TMA blocks can be generated at the same time. Each TMA block can be sectioned up to 300 times. All the resulting TMA slides have the same tissues in the same coordinate positions. The individual slides can be used for a variety of molecular analyses, such as H&E staining to ascertain tissue morphology, mRNA ISH or protein immunostaining or analysis of genetic alterations using FISH.. Figure 2. Comparison of conventional section analysis (A) and TMA analysis (B). The same laboratory procedure, such as an antibody staining or ISH, produces information on one molecular target in one tissue using conventional methods, whereas up to 1000 specimens can be simultaneously evaluated using TMAs.. 1000 individual slides. The analyses carried out on TMAs also provide information on the cellular origin of the molecular targets, thereby extending the information available from gene expression microarrays. Construction of TMAs is usually performed from archival formalin-fixed tissue materials. The ability to use archival specimens in high-throughput molecular analyses is a significant advantage. Such specimens cannot be used in other high-throughput technologies, such as cDNA microarray analysis, SAGE or proteomic screens. TECHNOLOGY FOR TMA CONSTRUCTION Most of the time and effort in TMA construction is spent in the search, organization, pathological review and processing of the tissue specimens to be included in the array. Donor tissue blocks should be histologically representative and at least 1 mm and preferably 3–4 mm thick. Archival blocks dating back 20–40 years are usually adequate if they have been fixed in 4% buffered. formalin. Such specimens can be used for immunohistochemistry (IHC) and DNA fluorescence in situ hybridization (FISH). mRNA ISH is more difficult because of the degradation and cross-linking of RNA molecules by formalin fixation. A fresh section is cut from the donor block and stained with hematoxylin and eosin (H&E). This slide is used to guide the sampling from morphologically representative regions of the tissues. We routinely use 0.6 mm diameter core biopsies from the donor blocks and deposit the cores with 0.8 mm spacing in the array block. With this configuration, the maximum number of samples that can be arrayed in a 45 × 25 mm area is about 1000, but usually 400–800 specimens are arrayed per TMA block. Using larger needles, one causes more damage to the original tissue blocks and substantially reduces the number of specimens that can be arrayed. For example, only about 100–150 cores measuring 2 mm in diameter can be placed in a single TMA block. In contrast, reducing the needle size to ∼0.4 mm could enable construction of arrays with 2500 specimens in a single TMA block. The array construction involves making a hole in the recipient TMA block, acquiring a cylindrical core sample from the donor tissue block and depositing this core into the TMA block. This process is repeated with a precision instrument to array hundreds of tissue specimens. We have also constructed an automated tissue arrayer capable of making multiple tissue microarray blocks from a set of donor specimens. For example, one can array a series of 1000 clinical specimens in 20 replicate TMA blocks and cut 300 sections each. This would result in a total of 6000 TMA slides from the set of 1000 tissue specimens. Sampling from up to 20 sites in each tissue usually causes relatively little damage to the original tissue blocks. Using a microtome, 5 µm sections are cut from the TMA blocks to generate TMA slides for molecular analyses. An.
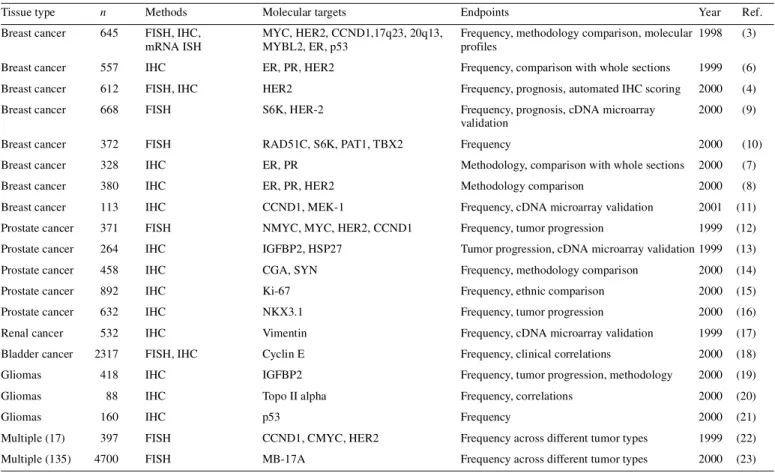
(3) Human Molecular Genetics, 2001, Vol. 10, No. 7. 659. Table 1. Tissue microarray studies in cancer research Tissue type. n. Methods. Molecular targets. Endpoints. Year. Ref.. Breast cancer. 645. FISH, IHC, mRNA ISH. MYC, HER2, CCND1,17q23, 20q13, MYBL2, ER, p53. Frequency, methodology comparison, molecular 1998 profiles. (3). Breast cancer. 557. IHC. ER, PR, HER2. Frequency, comparison with whole sections. 1999. (6). Breast cancer. 612. FISH, IHC. HER2. Frequency, prognosis, automated IHC scoring. 2000. (4). Breast cancer. 668. FISH. S6K, HER-2. Frequency, prognosis, cDNA microarray validation. 2000. (9). Breast cancer. 372. FISH. RAD51C, S6K, PAT1, TBX2. Frequency. 2000. (10). Breast cancer. 328. IHC. ER, PR. Methodology, comparison with whole sections. 2000. (7). Breast cancer. 380. IHC. ER, PR, HER2. Methodology comparison. 2000. (8). Breast cancer. 113. IHC. CCND1, MEK-1. Frequency, cDNA microarray validation. 2001. (11). Prostate cancer. 371. FISH. NMYC, MYC, HER2, CCND1. Frequency, tumor progression. 1999. (12). Prostate cancer. 264. IHC. IGFBP2, HSP27. Tumor progression, cDNA microarray validation 1999. (13). Prostate cancer. 458. IHC. CGA, SYN. Frequency, methodology comparison. (14). 2000. Prostate cancer. 892. IHC. Ki-67. Frequency, ethnic comparison. 2000. (15). Prostate cancer. 632. IHC. NKX3.1. Frequency, tumor progression. 2000. (16). 532. IHC. Vimentin. Frequency, cDNA microarray validation. 1999. (17). FISH, IHC. Cyclin E. Frequency, clinical correlations. 2000. (18). Renal cancer Bladder cancer. 2317. Gliomas. 418. IHC. IGFBP2. Frequency, tumor progression, methodology. 2000. (19). Gliomas. 88. IHC. Topo II alpha. Frequency, correlations. 2000. (20). Gliomas. 160. IHC. p53. Frequency. 2000. (21). Multiple (17). 397. FISH. CCND1, CMYC, HER2. Frequency across different tumor types. 1999. (22). Multiple (135). 4700. FISH. MB-17A. Frequency across different tumor types. 2000. (23). CCND1, cyclin-D1; CGA, chromogranin A; ER, estrogen receptor; FISH, fluorescence in situ hybridization; HSP-27, heat shock protein 27; IGFBP2, insulin growth factor binding protein 2; IHC, immunohistochemistry; PR, progesterone receptor; S6K, ribosomal s6 kinase; SYN, synaptophysin.. adhesive-coated tape sectioning system helps to transfer the precise locations of the tissue spots in the TMA block on to the microscope slides. Sample tracking is based on coordinate positions for each tissue spot in the TMA block which are then transferred on to the TMA slides. This sample tracking system can be linked to a database containing the demographic, clinico-pathological and survival data of the patients, allowing one to rapidly link molecular data with clinical features. Since the morphology of the tissues may change as more sections are cut, we usually stain the first section and every 50th section of the TMA blocks with H&E and monitor the morphology and representativity of the specimens. DETECTION OF MOLECULAR TARGETS ON TMA SLIDES Any antibody staining, ISH or other molecular detection scheme developed for whole tissue sections can also be adapted to TMA sections. The limiting factor is usually the nature and variability of the tissue fixation. The most common application of TMA slides is the detection of protein antigens using IHC. The TMA format provides a number of advantages in the testing and analysis of immunostainings. First, a large number of TMA sections containing different types of tissues, such as a panel of normal tissues, tumors, xenografts or cell. lines, can be produced for testing and optimization of pre-treatment conditions, antibody titers and detection systems. Second, these same control tissues can be placed directly on the actual study slides. This helps in assuring the specificity and sensitivity of IHC. Third, reproducibility of the staining reaction, as well as the speed and reliability of the interpretation, is improved, since all the tissues are on the same slide. Fourth, consecutive slides can be stained with H&E for morphology or with other antibodies against the same or other molecular targets. This permits comparison of multiple antibody stainings in virtually identical, histologically highly controlled regions of the tissues. Analysis and scoring of TMA slides can be carried out with a regular bright-field microscope. Without the use of any sophisticated instruments, pathologists can carry out such scoring very rapidly, up to hundreds of tissue spots per hour. It is also possible to acquire digital images from all of the tissue spots, followed by scoring of the results in silico. This allows construction of image archives linked to the database of molecular and clinical information. A more experimental approach involves automated analysis of staining intensities and features on TMA slides using sophisticated image analysis techniques. We recently demonstrated an excellent correlation between manual and automated scoring of the HER-2 oncoprotein staining intensity on breast cancer TMAs (4)..
(4) 660. Human Molecular Genetics, 2001, Vol. 10, No. 7. Figure 3. Tissue microarrays are powerful for validation, prioritization and extension of findings obtained from genomic surveys, such as cDNA microarrays. The cDNA microarrays enable one to analyze up to 5000 or 50 000 genes, in one specimen at a time. In contrast, TMAs are applicable to the analysis of one target at a time, but in up to 1000 tissues on each slide.. FISH technique is ideally applicable to the analysis of genetic alterations on TMA slides. A single hybridization provides visualization of specific genetic changes in up to 1000 tissues. A rate-limiting step is the scoring of FISH signals, which is very tedious and labor-intensive. We have developed a confocal fluorescence microscope-based system with associated image analysis algorithms for automatically scoring FISH results on TMA slides (5). The fixative used and variability of the fixation time and conditions influence the sensitivity and specificity of mRNA ISH on TMA slides. Moderately and abundantly expressed transcripts may be detectable using routine formalin-fixed tissues, but controlled fixation conditions are necessary for reliable detection of all transcripts. REPRESENTATIVITY OF TMA ANALYSIS OF CANCER A commonly expressed concern is whether the small core samples used in TMA analysis give meaningful information on large tumor specimens. One should keep in mind, however, that the basic principle of TMA analysis is fundamentally different from conventional histological analyses. This technology is a population-level research tool. It is not intended for making clinical diagnoses of individual cases. Obviously, samples measuring 0.6 mm in diameter will not capture all the information from large, sometimes highly heterogeneous tumors. Analysis of molecular targets on TMAs may therefore result in lower prevalence estimates than obtained from conventional tumor sections. This will depend on the degree of heterogeneity of the examined tumor type and the molecular target. Molecular targets that have therapeutic significance are often relatively uniformly expressed in cancer tissues. Sampling methods used for TMAs are therefore suitable for detecting such critically important established or emerging therapy targets.. Three studies have directly compared biomarker expression using TMAs and regular sections of the same breast cancers. All studies report >90–95% concordance for common breast cancer biomarkers such as estrogen and progesterone receptors and the HER-2 oncoprotein (6–8). Moreover, prognostic associations for these markers could be reproduced with the TMAs (6). Some investigators have used core samples that are larger in diameter (>2–4 mm) to improve the representativity. In our experience, this does not substantially increase the information content of TMA analysis, since the likelihood of finding heterogeneity within such a small area is often quite low. In contrast, punching multiple small cores from different regions captures the heterogeneity of the tumors more effectively. Core sampling from different tumor blocks of the same patient, perhaps including metastatic sites, may improve the sampling efficiency of TMAs beyond what can be achieved with a single section of one tumor. Finally, absolute frequencies of molecular targets are often not relevant in the research setting if one can accurately determine relative frequencies. TMAs are ideally applicable to the analysis of relative frequencies of molecular targets. For example, the frequency of a molecular target A can be compared against target B in consecutive sections of the same TMA block. Alternatively, frequency of a target can be compared between tumor stage A and B (or histological type C and D) where all types of tissues have been sampled on the same TMAs with similar methods. APPLICATIONS OF TMA ANALYSIS Twenty TMA studies of cancer have been published (Table 1). The size of the materials used in these studies has ranged from 88 to 4700 tumors, each study reporting data on 1–7 different molecular targets (3,4,6–23). Taken together, the published studies have already generated >15 000 data points (status of a molecular target in a tissue spot) by IHC, FISH and mRNA.
(5) Human Molecular Genetics, 2001, Vol. 10, No. 7. ISH. It is likely that the number and extent of these studies will greatly increase in the near future. The frequencies of molecular alterations found by TMA analysis correspond very well with the published frequencies derived from studies with conventional tissue sampling, supporting the representativity of the core samples. The validity of TMA analysis has been shown by comparisons with whole-section analysis in breast (6–8), prostate (14) and brain cancer (19). TMAs have been extensively used to study gene targets that have been found in genomic surveys by cDNA microarrays and other techniques (Fig. 3). For example, Barlund et al. (9) found overexpression of the ribosomal s6 kinase gene in a breast cancer cell line by cDNA microarrays and then showed, using TMAs, how 9–15% of breast cancers amplify this gene or overexpress the encoded protein. This study also indicated that s6 kinase may be a significant prognostic indicator in breast cancer. This illustrates how TMA analysis facilitates studies of the clinical significance of new genes discovered in genomic screenings of model systems. Similar studies in prostate (13) and renal cancer (17) were reported. Hedenfalk et al. (11) studied breast cancers from BRCA1 and BRCA2 carriers using cDNA microarrays, identified genes that distinguished these tumors and then used IHC on TMAs to analyze protein products encoded by these genes. It is also possible to use TMAs to associate molecular alterations with a specific stage of tumor progression. For example, amplification of the AR gene (12) and overexpression of the IGFBP2 protein (13) were found to be very common in hormone-refractory end-stage prostate cancers, but infrequent in untreated primary tumors. Bubendorf et al. (12,13) and Bowen et al. (16) constructed a prostate cancer ‘progression TMA’ that included all stages of prostate cancer development, starting from normal prostate, benign prostate hyperplasia, prostatic intraepithelial neoplasia, localized clinical cancer, to metastatic and hormone-refractory end-stage cancer. Perrone et al. (15) studied tumor proliferation using TMAs from matched prostate cancer cases from Caucasians and African-Americans. This study indicates the substantial value of TMA analysis in exploring ethnic differences in cancer causation, as well as in linking etiological and risk factors with molecular characteristics of cancer. Finally, Schraml et al. (22) studied the presence of amplifications of specific genes across a spectrum of 17 different malignancies. This ‘multi-tumor TMA’ screening provides an example of the power of TMA analysis in providing a comprehensive screening of molecular alterations not only within a particular tumor type, but across all common malignancies. A larger scale version of this multi-tumor array, containing up to 4700 tumors representing 135 different tumor types (23), has recently been constructed at the University of Basel. TMA analysis is likely to find applications in many fields other than cancer research. These include arrays of individual cells (24), tissues from experimental model systems, animal tissues, development, aging and other diseases, just to mention a few. The methodology can be scaled up in two dimensions: (i) in the number of tissue specimens that can be analyzed at once and (ii) in the number of consecutive sections that can be produced for analysis with different probes and antibodies. Using multi-parametric analyses, TMAs can provide a ‘tissue. 661. profile’ for new gene and protein targets as well as a ‘molecular profile’ for tissue specimens or diseases. ACKNOWLEDGEMENTS Supported in part by the Swiss National Science Foundation, Krebsliga beider Basel, Novartis Foundation and Sigrid Juselius Foundation. REFERENCES 1. DeRisi, J., Penland, L., Brown, P.O., Bittner, M.L., Meltzer, P.S., Ray, M., Chen, Y., Su, Y.A. and Trent, J.M. (1996) Use of a cDNA microarray to analyse gene expression patterns in human cancer. Nature Genet., 14, 457–460. 2. Velculescu, V.E., Zhang, L., Vogelstein, B. and Kinzler, K.W. (1995) Serial analysis of gene expression. Science, 270, 484–487. 3. Kononen, J., Bubendorf, L., Kallioniemi, A., Barlund, M., Schraml, P., Leighton, S., Torhorst, J., Mihatsch, M.J., Sauter, G. and Kallioniemi, O.P. (1998) Tissue microarrays for high-throughput molecular profiling of tumor specimens. Nature Med., 4, 844–847. 4. Bucher, C., Tohorst, J., Kononen, J., Haas, P., Askaa, J., Godtfredsen, S.E., Bauer, K.D., Seelig, S., Kallioniemi, O.P. and Sauter, G. (2000) Automated, high-throughput tissue microarray analysis for assessing the significance of Her-2 involvement in breast cancer. J. Clin. Oncol., Annual Meeting, 2338. 5. Bubendorf, L., Kononen, J., Barlund, M., Kallioniemi, A., Grigorian, A., Sauter, G., Dougherty, E.R. and Kallioniemi, O.P. (1999) Tissue microarray FISH and digital imaging: Towards automated analysis of thousands of tumors with thousands of probes. Am. J. Hum. Genet., 65 (suppl.), 316. 6. Bucher, C., Torhorst, J., Bubendorf, L., Schraml, P., Kononen, J., Moch, H., Mihatsch, M., Kallioniemi, O.P. and Sauter, G. (1999) Tissue microarrays (‘tissue chips’) for high-throughput cancer genetics: Linking molecular changes to clinical endpoints. Am. J. Hum. Genet., 65 (suppl.), 43. 7. Gillett, C.E., Springall, R.J., Barnes, D.M. and Hanby, A.M. (2000) Multiple tissue core arrays in histopathology research: a validation study. J. Pathol., 192, 549–553. 8. Camp, R.L., Charette, L.A. and Rimm, D.L. (2000) Validation of tissue microarray technology in breast carcinoma. Lab. Invest., 80, 1943–1949. 9. Barlund, M., Forozan, F., Kononen, J., Bubendorf, L., Chen, Y., Bittner, M.L., Torhorst, J., Haas, P., Bucher, C., Sauter, G. et al. (2000) Detecting activation of ribosomal protein S6 kinase by complementary DNA and tissue microarray analysis. J. Natl Cancer Inst., 92, 1252–1259. 10. Barlund, M., Monni, O., Kononen, J., Cornelison, R., Torhorst, J., Sauter, G., Kallioniemi, O.P. and Kallioniemi, A. (2000) Multiple genes at 17q23 undergo amplification and overexpression in breast cancer. Cancer Res., 60, 5340–5344. 11. Hedenfalk, I., Duggan, D., Chen, Y., Radmacher, M., Bittner, M., Simon, R., Meltzer, P., Gusterson, B., Esteller, M., Kallioniemi, O.P. et al. (2001) Gene expression profiles of hereditary breast cancer. N. Engl. J. Med., 344, 539–548. 12. Bubendorf, L., Kononen, J., Koivisto, P., Schraml, P., Moch, H., Gasser, T.C., Willi, N., Mihatsch, M.J., Sauter, G. and Kallioniemi, O.P. (1999) Survey of gene amplifications during prostate cancer progression by highthroughout fluorescence in situ hybridization on tissue microarrays. Cancer Res., 59, 803–806. 13. Bubendorf, L., Kolmer, M., Kononen, J., Koivisto, P., Mousses, S., Chen, Y., Mahlamaki, E., Schraml, P., Moch, H., Willi, N. et al. (1999) Hormone therapy failure in human prostate cancer: analysis by complementary DNA and tissue microarrays. J. Natl Cancer Inst., 91, 1758–1764. 14. Mucci, N.R., Akdas, G., Manely, S. and Rubin, M.A. (2000) Neuroendocrine expression in metastatic prostate cancer: evaluation of high throughput tissue microarrays to detect heterogeneous protein expression. Hum. Pathol., 31, 406–414. 15. Perrone, E.E., Theoharis, C., Mucci, N.R., Hayasaka, S., Taylor, J.M., Cooney, K.A. and Rubin, M.A. (2000) Tissue microarray assessment of prostate cancer tumor proliferation in African-American and white men. J. Natl Cancer Inst., 92, 937–933. 16. Bowen, C., Bubendorf, L., Voeller, H.J., Slack, R., Willi, N., Sauter, G., Gasser, T.C., Koivisto, P., Lack, E.E., Kononen, J. et al. (2000) Loss of.
(6) 662. 17.. 18.. 19.. 20.. Human Molecular Genetics, 2001, Vol. 10, No. 7. NKX3.1 expression in human prostate cancers correlates with tumor progression. Cancer Res., 60, 6111–6115. Moch, H., Schraml, P., Bubendorf, L., Mirlacher, M., Kononen, J., Gasser, T., Mihatsch, M.J., Kallioniemi, O.P. and Sauter, G. (1999) Highthroughput tissue microarray analysis to evaluate genes uncovered by cDNA microarray screening in renal cell carcinoma. Am. J. Pathol., 154, 981–986. Richter, J., Wagner, U., Kononen, J., Fijan, A., Bruderer, J., Schmid, U., Ackermann, D., Maurer, R., Alund, G., Knonagel, H. et al. (2000). Highthroughput tissue microarray analysis of cyclin E gene amplification and overexpression in urinary bladder cancer. Am. J. Pathol., 157, 787–794. Sallinen, S.L., Sallinen, P.K., Haapasalo, H.K., Helin, H.J., Helen, P.T., Schraml, P., Kallioniemi, O.P. and Kononen, J. (2000) Identification of differentially expressed genes in human gliomas by DNA microarray and tissue chip techniques. Cancer Res., 60, 6617–6622. Miettinen, H.E., Jarvinen, T.A., Kellner, U., Kauraniemi, P., Parwaresch, R., Rantala, I., Kalimo, H., Paljarvi, L., Isola, J. and Haapasalo, H. (2000) High topoisomerase II alpha expression associates with high proliferation. 21. 22.. 23.. 24.. rate and and poor prognosis in oligo-dendrogliomas. Neuropathol. Appl. Neurobiol., 26, 504–512. Tynninen, O., Paetau, A., von Boguslawski, K., Jääskeläinen, J., Aronen, H.J. and Paavonen, T. (2000) p53 expression in tissue microarray of primary and recurrent gliomas. Brain Pathol., 10, 575–576. Schraml, P., Kononen, J., Bubendorf, L., Moch, H., Bissig, H., Nocito, A., Mihatsch, M.J., Kallioniemi, O.P. and Sauter, G. (1999) Tissue microarrays for gene amplification surveys in many different tumor types. Clin. Cancer Res., 5, 1966–1975. Andersen, C.L., Monni, O.M., Kononen, J., Barlund, M., Bucher, C., Hass, P., Nocicito, A., Bissig, H., Sauter, G., Kallioniemi, O.P. et al. (2000) High-throughput gene copy number analysis in 4700 tumors: FISH analysis on tissue microarrays identifies multiple tumor types with amplification of the MB-174 gene, a novel amplified gene originally found in breast cancer. Am. J. Hum. Genet., 67, 448. Oode, K., Furuya, T., Harada, K., Kawauchi, S., Yamamoto, K., Hirano, T. and Sasaki, K. (2000) The development of a cell array and its combination with laser-scanning cytometry allows a high-throughput analysis of nuclear DNA content. Am. J. Pathol., 157, 723–727..
(7)
Figure


Documents relatifs