THÈSE PRÉSENTÉE À
L'UNIVERSITÉ DU QUÉBEC À TROIS-RIVIÈRES
COMME EXIGENCE PARTIELLE DU DOCTORAT EN GÉNIE ÉLECTRIQUE
PAR
TASHTOUSH ABDULLAH
DÉTECTION D'INTERFACE ET DISPOSITIFS DE TRAITEMENT EN TECHNOLOGIE CMOSP35 POUR LES BIOCAPTEURS VLSI
Université du Québec à Trois-Rivières
Service de la bibliothèque
Avertissement
L’auteur de ce mémoire ou de cette thèse a autorisé l’Université du Québec
à Trois-Rivières à diffuser, à des fins non lucratives, une copie de son
mémoire ou de sa thèse.
Cette diffusion n’entraîne pas une renonciation de la part de l’auteur à ses
droits de propriété intellectuelle, incluant le droit d’auteur, sur ce mémoire
ou cette thèse. Notamment, la reproduction ou la publication de la totalité
ou d’une partie importante de ce mémoire ou de cette thèse requiert son
autorisation.
DOCTORAT EN GÉNIE ÉLECTRIQUE (PH.D.)
Programme offert par l'Université du Québec à Trois-Rivières
DÉTECTION D'INTERFACE ET DISPOSITIFS DE TRAITEMENT EN TECHNOLOGIE CMOSP35 POUR LES BIOCAPTEURS VLSI
PAR
TASHTOUSH ABDULLAH
Adel Omar Dahmane, directeur de recherche Université du Québec à Trois-Rivières
Frédéric Domingue, président du jury Université du Québec à Trois-Rivières
Youcef Fouzar, codirecteur de recherche Advanced Micro Deviees
Otmane Ait Mohamed, évaluateur Université Concordia
Rachid Beguenane, évaluateur externe Collège militaire royal du Canada
Each year, thousands of patients in Canadian hospitals are infected with antibiotic-resistant bacteria, resulting in a cost of at least $100 million to the health-care system. Although most bacteria are harmless to healthy individuals, the symptoms of bacterial infection can be severe for patients with a weakened immune system. Outbreaks of Clostridium difficile (C. difficile) and methicillin-resistant Staphylococcus aureus (MRSA) have occurred in Canadian hospitals, leading, for example, to more than 600 deaths in Québec alone from 2003 to 2005. Early detection is critical for improved patient care and can help in minimizing the risk of cross contamination between patients. The aim of the thesis is to use state of the art technologies for developing handheld biosensors for pathogenic bacteria detection. There is extensive demand for a low-cost, rapid, selective and sensitive method for detecting bacteria in medical diagnosis, and food-safety inspection. Traditional methods, such as polymerase chain reaction and cell culture techniques take several hours to days to give accurate results, and require bulky, expensive equipment. In this work, we introduced new techniques for detecting bacterial pathogen cell at low concentration level based on CMOS/MEMS technology batch process. The methodology of the proposed multibiosensors that is named by multi-Iab-on-a-chip (MLoC); lies on miniaturizing transducers, which is based on optical CMOS technology, charge based capacitance measurements (CBCM), electrochemical impedance spectroscopy (EIS) and CMOS microcoils incorporating with interdigitated microelectrode array (IDMA). The
aforementioned approaches technically proved their capability and reliability overwhelmingly among the used conventional techniques for that reason these techniques havebeen proposed to create compact and portable biosensors for sensitive and rapid detection of bacterial pathogens. While the four proposed biosensors have common objectives they differ in the method and analysis used, and postulates engaged by a discipline to achieve the objectives; the inquiry of the principles of investigation in a particular field. For example, the immunosensors can smooth the progress of point-of-care testing (POCT) and become conscious state-of-the-art molecular analysis without the need of using a state-of-the-art laboratory. In addition; immunosensors reduce the cost of clinic diagnosis by miniaturizing and automate detection, and they can be categorized as capacitive, optical, electrochemical and magnetic techniques; in the light of their sens~ng theory.
Acknowledgements
This project would not have been accomplished if it were not for my thesis director Professor Adel Omar Dahmane and the co-supervisor Dr. Youcef Fouzar for their support and enthusiasm. 1 would like to thank them for having me in their group in the laboratory of microsystems at UQTR, for giving me the opportunity ofworking in the interesting topic of biosensing and for their guidance throughout the project. 1 acknowledge the president of the jury and the jury members for reviewing this work and for their relevant and constructive feedback through comments and questions.
1 would also like to extend my sincerest gratitude to my oldest daughter, Marya Tashtoush, for her aiding in the final written work of the thesis. Moreover, 1 would like to thank my sons and my other daughter for their efforts to make the circumstances easier for me to bring my work to light. Finally and prominently, 1 would like to thank my wife Reem Al-Gtah cordially for her enthusiasm, encouragement, presence, love and support during these years at UQTR.
Table of Contents
Résumé ... iii
Acknowledgements ...
v
Table of Contents ... vi
List of Tables ... xii
List of Figures ...... xiii
List ofsymbols ...... xx
Chapitre 1 -Introduction ... 1
1.1 General Introduction .. ...... 1
1.1.1 Biosensors Techniques ... 9
1.1.2 Biosensors instrumentation and CMOS Technology ........ 13
1.1.3 Immobilization ... 15
1.2 The problem and the general framework of research ... 16
1.3 Originality ... .. 19
1.4 Objectives ...... 20
1.5 The Methodology ... 21
1.5.2 A CMOS Resizing Methodology ... 23
1.5.3 Research tools ... , ... 23
1.5.4 Data analysis ... 23
1.5.5 Limitations and challenges ... 23
1.6 Structure of thesis ... 24
Chapitre 2 - CMOS capacitance s~nsor based on Charge-Based Capacitance Measurements ... 26
2.1 Abstract ... 26
2.2 Preview ... 26
2.3 Sensor System Design ... 28
2.3.1 Interdigitated microelectrodes array (IDMA) ... 28
2.3.2 Biosensor system design and architecture ... 35
2.3.3 Read-out circuitry ... 40
2.3.4 Signal and frequency ... 43
2.3.5 Sensitivity ... 44
2.4 CMOS Charge Based Capacitance Measurement Circuit.. ... .45
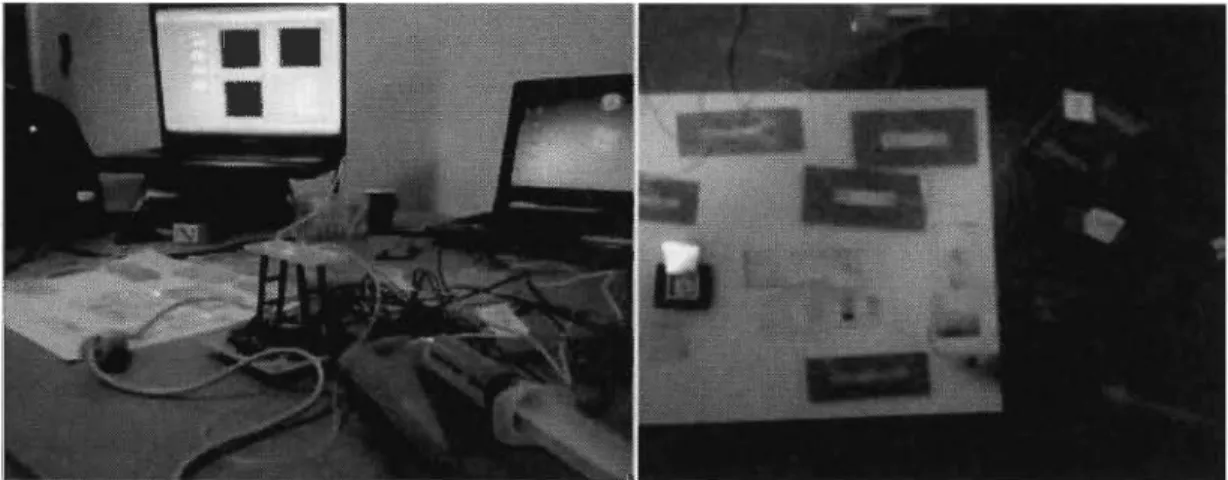
2.5 Experimental Setup and CBCM on MLoC System Validation ... .47
2.6 CBCM Technique Validation ... .49
2.6.1 Simulation Results ... 49
2.6.3 Conclusions ... 51
Chapitre 3 - CMOS single-chip Optical Biosensors ... 53
3.1 Abstract ... 53
3.2 Preview ... 54
3.3 CMOS Phototransistor technique ... 55
3.4 VPNP phototransistor operation ... 59
3.5 VPNP phototransistor Structure and CMOS technology ... 62
3.5.1 Biosensors Responsivity and Quantum Efficiency ... 64
3.5.2 Phototransistor 32x32 array characteristics ... : ... 67
3.5.3 Dark Current (ID) ... 70
3.5.4 Power consumption ... 72
3.6 Layout of one phototransistor pixeL ... 74
3.7 The detector block operation ... 76
3.8 Transduction and amplification ... 78
3.9 Experimental procedures and MLoC system Validation ... 81
3.9.1 Experimental setup ... 81
3.9.2 CMOS microchip instrument ... 83
3.9.3 Phage immobilization and protocol ... 84
3.9.5 Design and Fabrication (MFC) ... 86
3.10 Optical biosensor on MLoC System Validation ... 87
3.10.1 Bacterial pathogens results ... 87
3.10.2 Conclusions ... 93
Chapitre 4 - Electrochemical Impedance Spectroscopy for Electrochemical Sensing Biomolecules ... 94
4.1 Abstract ... 94
4.2 Preview ... ~95
4.3 Electrochemical Biosensors - Sensor Principles and Architectures ... 98
4.4 Electrochemical Detection Techniques ... 98
4.5 CMOS-Integrated potentiostat behavior ... 99
4.5.1 Signal-processing unit. ... 101
4.6 Microfluidic Electrochemical cell ... 106
4.6.1 The characteristics ofIDMA influences and advantages ... .I 09 4.7 Electrochemical impedance spectroscopy Structure and Behavior. ... 112
4.8 Equivalent Circuit modeling of the Immunosensor System ... .121
4.9 Experimental Setup and EIS on MLoC System Validation ... .I35 4.9.1 Impedance measurements ... 135
4.10 Conclusions ... 138
5.1 Abstract ... 140
5.2 Preview ... 140
5.3 CMOS IC Microcoil Array Architecture ... 145
5.3.2· Design Microcoil Array ... 150
5.3.3 Digital control circuit ... 161
5.3.4 Control Circuit for Microcoil Array ... 173
5.4 Impedimetric Biosensors for Magnetic bead-based Immunoassay ... .176
5.4.1 System and components ... 176
5.4.2 Impedimetric Biosensors based on CMOS technology ... 177
5.4.3 Protocols and Detection Mechanism ... 180
5.4.4 The CMOS Microcoil Behavior ... 183
5.4.5 Magnetic Beads ... 186
5.4.6 Magnetic Manipulation ofCells Theory ... 187
5.5 Packaging ... 192
5.6 Experiment Setup and CMOS Microcoil on MLoC System Validation ... 193
5.7 Labview instrumentation, acquisition, and control applications ... 195
5.8 Results and Conclusions ... 197
5.8.1 Magnetic Bead Motion ... 197
5.8.1 EIS technique Validation on MLoC System ... 204
5.8.2 Conclusions ... 207
Chapitre 6 - Conclusions, Contributions and Suggestions for Future Works ... 209
Bibliography ... 212
Appendix A: Labview Programming and Source Code ... 235
Appendix B: Experimental Procedures' Images for (MLoC) system ... 241
Table 1.1 Table 1.2 Table 3.1 Table 3.2 Table 3.3 Table 5.1 Table 5.2 Table 5.3 Table 5.4
List of Tables
Common Biological Recognition Elements ... 3
Design Parameters for Selecting a Transducer for a Biosensor ... .4
The spectrum ofvisible light frequency/wavelength ... 66
VPNP phototransistor specification ... 70
Power consumption with respect to other technologies ... 74
Microcoil specification and parameters ... 154
The most common CMOS parameters ... 170
Susceptibilities of most biological cells ... 190
List of Figures
Figure 1-1 General Model for Biosensors, differentiating between molecular
recognition, transduction and data processing ... 3
Figure 1-2 The organization chart of receptor principles ... 5
Figure 1-3 Biosensors categories ... 6
Figure 1-4. Nyquist plot illustrates the characteristics of the impedance ... .11
Figure 1-5 Microfluidic channel fabrication using photolithography and Rapid prototyping techniques ... 12
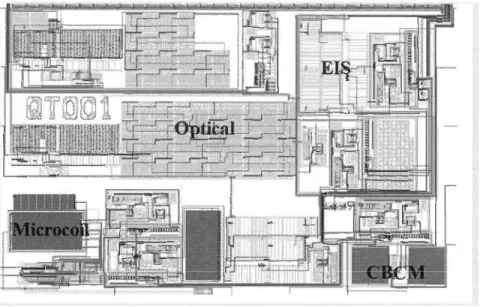
Figure 1-6 The layout of the entire biosensors devices on a single chip ... 22
Figure 2-1 Simplified block diagram of CBCM technique ... 29
Figure 2-2 Schematic diagram of CBCM technique ... 30
Figure 2-3 A schematic diagram of the interdigitated capacitor ... 31
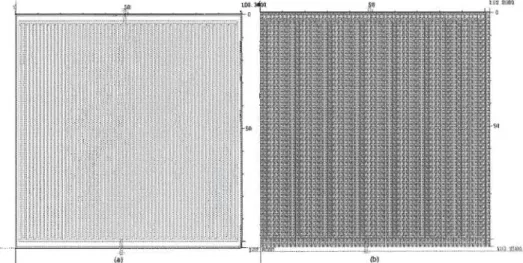
Figure 2-4 Layout of the interdigitated microelectrodes arrays capacitor, (a) the sensor capacitor (b) the reference capacitor. ... 32
Figure 2-5 The dimension of the width and gap for the IDMA ... .33
Figure 2-6 The Block diagram ofthe CBCM integrated with Interdigitated Microelectrode array and signal-processing system ... 34
Figure 2-7 The Layout of the entire CMOS capacitance biosensor ... 34
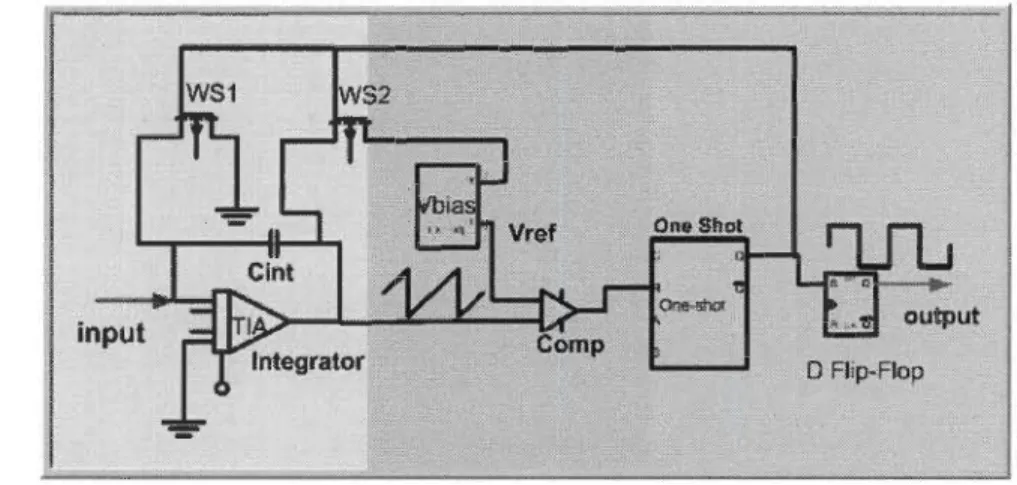
Figure 2-8 The Biosensor circuit based on CBCM ... 35
Figure 2-9 Surface sensing binding with pathogens ... 38
Figure 2-10 An illustration of CMOS capacitive biosensor for MLoC applications ... 40
Figure 2-11 Block diagram of the signal-processing circuit. ... .41
Figure 2-12 IDMA simplified equivalent circuit ... 42
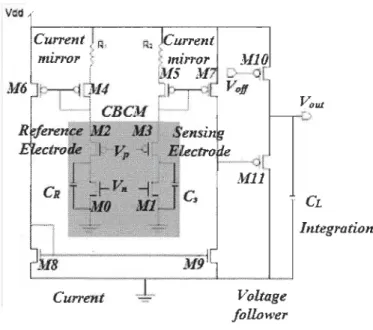
Figure 2-13 Schematic representation of (CBCM) ... .45
Figure 2-14 CBCM interface circuit topology ... .47
Figure 2-15 The experimental setup for Multibiosensors circuit based on CBCM ... 48
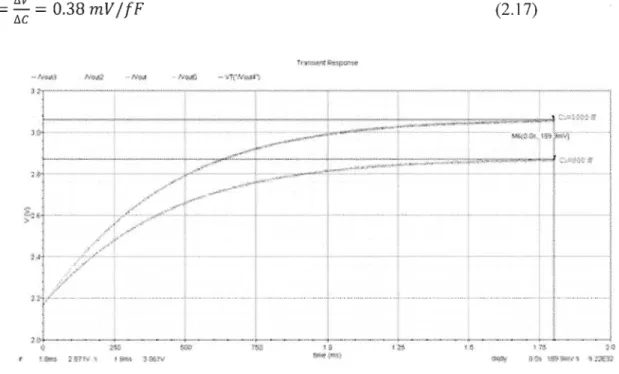
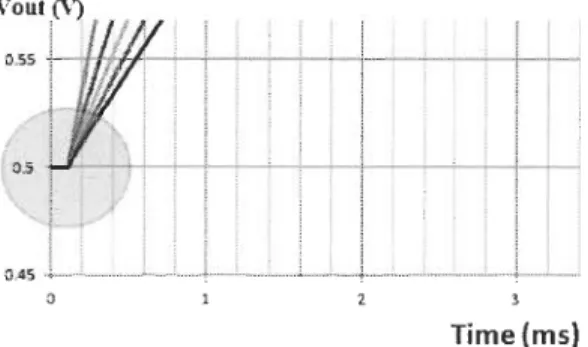
Figure 2-16 Simulation results showing the voltage output of the CBCM
circuit. ... 49
Figure 2-17 The capacitance measurement using CMOS capacitance biosensor ... 50
Figure 2-18 The capacitance measurement shows no significant response at low frequency range ... 51
Figure 3-1 CMOS Detection and Signal-Processing Circuit. ... 56
Figure 3-2 (a) Schematic of the bias generator circuit for rail-to-rail folded-cascade op-amp used in CVC and TIA. (b) Schematic of the folded-cascade and output stages of the op-amp ... 58
Figure 3-3 PNP phototransistor homo-junction planar structure ... 60
Figure 3-4 The PNP phototransistor operation ... 60
Figure 3-5 Schematic diagram of VPNP phototransistor structure ... 62
Figure 3-6 Responsivity ('R.) in optical biosensors varies with the wavelength of the incident light. ... 65
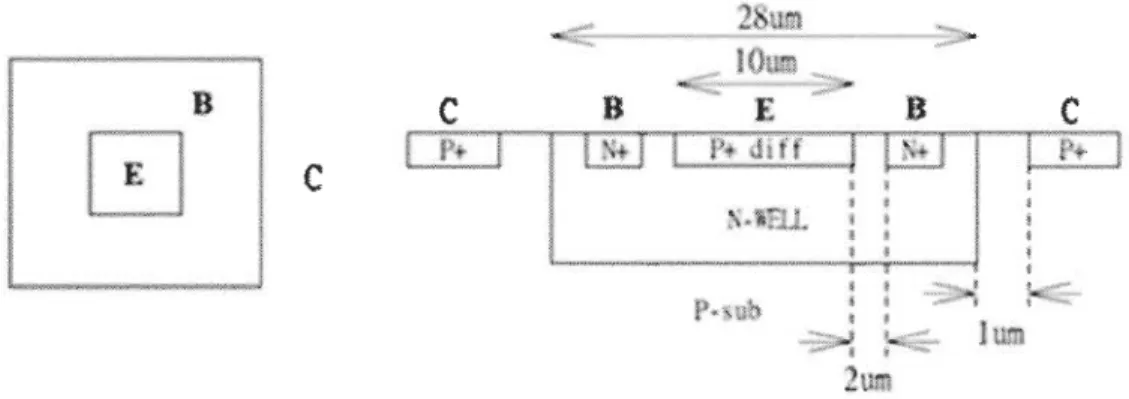
Figure 3-7 The structure of the VPNP transistor as given by CMC ... 67
Figure 3-8 Integration frequency vs. light intensity Li ... 67
Figure 3-9 The phototransistor current at Cpt = 300 fF and 1 V ... 68
Figure 3-10 Phototransistor current versus light intensity ... 69
Figure 3-11 Dark current vs. the capacitance ... 71
Figure 3-12 The dark current depends on the capacitance ... 71
Figure 3-13 The dark current depends on applied voltage ... 72
Figure 3-14 Layout of one phototransistor pixeL ... 75
Figure 3-15 Layout view and corresponding cross-section of VPNP: a) Layout view, b) Corresponding cross-section ... : ... 75
Figure 3-16 The optical biosensors stages ... 76
Figure 3-17 A nonlinear phase shift topology ... 77
Figure 3-18 Schematic oflow-pass-filter circuit in the phase detector structure ... 78
Figure 3-19 The cUITent-voltage convertor stage ... 79
Figure 3-20 Regulated gain amplifier (RGA) stage ... 80
Figure 3-21 Optical setup and MLoC system validation ... 82
Figure 3-22 The layout of the CMOS IC for photosensing device ... 83
Figure 3-23 The structure of Gram-positive bacteria, and Gram-negative bacteria ... 85
Figure 3-24 Microfluidic channel. ... 86
Figure 3-25 MFC after shining the system with red laser ... 87
Figure 3-26 Microfluidic channel with three in lets and outlet.. ... 87
Figure 3-27 Optical response of phototransistors array in the CMOS microchip OFF/ON state ... 88
Figure 3-28 The entire detection cycle ... 89
Figure 3-29 The phototransistors were used to record the fluorescence signais of Dl water and fluorescence material as a reference ... 90
Figure 3-30 The fluorescence signal recorded for the positive bacteria, with high concentration and DI water, respectively ... 90
Figure 3-31 The phototransistors were used to record the fluorescence signais of DI water and fluorescence material after encapsulating the microchip ... 91
Figure 3-32 The fluorescence signal recorded for the positive bacteria, with high concentration and DI water, respective1y, after encapsulation ... 92
Figure 3-33 The fluorescence signal for negative and positive bacteria ... ; ... 92
Figure 4-1 Basic Potentiostat scheme ... 97
Figure 4-2 Electrochemical biosensor architecture ... 98
Figure 4-3 The layout of the OP-Amp and the entire CMOS IC chip ... .101
Figure 4-4 (a) Layout ofIC CMOS chip (b) the architecture of the chip ... 101
Figure 4-5 The signal-processing unit arctechtiture and layout.. ... 102
Figure 4-7 The simulation result for the TIA operation amplifier ...
.1
05Figure 4-8 The schematic ofTIA used in the first stage ... .105
Figure 4-9 Basic Microfluidic channel with three inlets and outlet. ... 1 06 Figure 4-10 Microfluidic channel with embedded interdigitated microelectrodes array ... 107
Figure 4-11 Polymeric lab on a chip on top of CMOS chips with embedded interdigitated microelectrodes array ... 1 08 Figure 4-12 Basic Interdigitated microelectrode array (lDMA) Illustrating the anode and cathode terminais ... 1 08 Figure 4-13 The four-electrode configuration ... 110
Figure 4-14 The layout of the IDMA ... .112
Figure 4-15 The electric field established between the fingers (a) free-Iabel (b) Antibodies process ... 117
Figure 4-16 The sensing surface covered by bacterial pathogen (a) before and (b) after applying electrical field ... 119
Figure 4-17 The architecture of the electrochemical biosensors ... 119
Figure 4-18 (a) The layout of the EIS CMOS chip, (b) The schematic ofTIA ... 120
Figure 4-19 Immunoglobulin attaches to a unique antigen ... 121
Figure 4-20 Randles equivalent electrical circuit model... ... 123
Figure 4-21 The general schematic drawing ofNyquist plot for an EIS ... 125
Figure 4-22 Faradaic impedance and its equivalent.. ... 126
Figure 4-23 Non-Faradaic equivalent circuit mode!. ... .127
Figure 4-24 The equivalent circuit models for microelectrode array ... 134
Figure 4-25 Impedance measurements using PDEIS software ... 135
Figure 4-26 The microfluidic channel incorporates IDMA along with schematic ... 135
Figure 4-27 Microfluidic channels in different designs ... 136
Figure 4-29 The behavior of the system after applying the three samples
using Nyquist diagram ... 138
Figure 5-1 Single microcoil structure ... 144
Figure 5-2 The layout ofIC CMOS microcoils arrays ... .147
Figure 5-3 The electronic circuitry of the control current source ... .147
Figure 5-4 The CMOS chip with single microcoil... ... 148
Figure 5-5 The distance between adjacent microcoils ... 148
Figure 5-6 Interdigitated microelectrodes array ... 149
Figure 5-7 CMOS microcoil array incorporated control circuit. ... 149
Figure 5-8 Standard CMOS Microcoil.. ... .151
Figure 5-9 The layout of the three Metals (Ml, M2, M3) that using in CMOPS35 technology ... 152
Figure 5-10 The entire layout of CMOS microcoil array using CMOSP35 technology ... 153
Figure 5-11 Equivalent circuit of the spiral-type inductor. ... .159
Figure 5-12 The schematic of the microcoil connecting with control circuit. ... 161
Figure 5-13 The dut y cycle D is defined as the ratio between the pulse duration (T) and the period (T) of a rectangular waveform ... 162
Figure 5-14 The architecture of control circuit incorporated CMOS microcoil ... 164
Figure 5-15 CMOS microcoil displaying the connecting of8 microcoils in series at the center of the control circuit.. ... 165
Figure 5-16 . The schematic of the control circuit.. ... .166
Figure 5-17 The control circuit operation to perform counterclockwise current in the microcoil, (b) The dynamic behavior of the electronics circuit when SW 1 s is in low level and SW2s in high level.. ... .167
Figure 5-18 a) The control circuit operation to perform clockwise current in the microcoil, (b) The dynamic behavior of the electronics circuit when SW2s is in low level and SWls in high level.. ... : ... 167
Figure 5-20 Basic Current source analysis ... 169
Figure 5-21 The entire IC array microcoil incorporated control circuit. ... 171
Figure 5-22 The schematic of CMOS microcoil incorporated Control circuit. ... 172
Figure 5-23 The mechanism oftrapping a magnetic bead use digital circuit concept; switching ON and OFF ... 174
Figure 5-24 Microcoil Array Operation applied on 4 by 8 microcoil array ... 175
Figure 5-25 The configuration ofIDMA on the top ofmicrocoil... ... 178
Figure 5-26 IDMA configurations ... 179
Figure 5-27 The sensing surface covered by biological cells (a) before and (b) after applying magnetic field ... 181
Figure 5-28 Illustration of the integrated magnetic field array setup ... 182
Figure 5-29 Use of a magnetic field to detect specifie bacteria ... 183
Figure 5-30 Surface sensing preparation and functionalization ... .184
Figure 5-31 The magnetic field applied and the biomolecular attractive to the sensing surface ... 185
Figure 5-32 The magnetic field release or reverse ... 185
Figure 5-33 Illustrates the magnetic behavior of a magnetic bead ... 188
Figure 5-34 The magnetic susceptibility X of a bead as a function of T [296] ... 191
Figure 5-35 Packaging the biosensors inc1uding MFC Sample preparation ... .193
Figure 5-36 The experiment setup to operate the cell manipulation system ... 193
Figure 5-37 The experimental setup for MLoC system validation ... 194
Figure 5-38 The microfluidic channel incorporates IDMA ... 195
Figure 5-39 The entire time for switching Tp and TON on behalf of the 10 x 10 microcoil for different radius ... 200
Figure 5-40 The variation ofswitch timing (ON and OFF states) for different radius ofmicrocoils, and Number ofmicrocoil turns ... 200
Figure 5-42 The entire time require for ON and OFF state (rp ) ... 202 Figure 5-43 The speed of the cell under the magnetic field over the
displacement (s) and the entire time interval (ON) from the
center of the microcoil to the end ... .202 Figure 5-44 The cell speed over the period ON & OFF states ... 203 Figure 5-45 Circuitry that steers the magnitude and the direction of currents ... 204 Figure 5-46 The experimental run for the entire process, control and sensing
APS: BEC: BOD: CBCM: CCDs: CE: CE: CFU: CL: CMOS: CNT: COC: CPE: CVC: DAMP: DAQ: ECL: EIS: ELISA: ELONA: EM: FISH: GFP: GL: GPIB: HER2: HL: IBH: IDMA: Ig: IMEA: ISFET: Labview: LB: LCE: LIF: LoC: LOD: MDS: MEMS:
List of symbols
Active-Pixel-Sensor BioelectrochemistryBiological Oxygen Demand
Charge Based Capacitance Measurement Charge-Coupled Devices
Capturing Efficiency Counter Electrode Colony Forming Units Chemiluminescence
Complementary Metal Oxide silicon Carbon Nanotube
Cyc1ic Olefin Copolymer Constant Phase Element Current-Voltage Converter Differentiai amplifier Data acquisition devices Electrochemiluminescence
Electrochemical Impedance Spectroscopy Enzyme-Linked Immunosorbent Assay Enzyme Linked Oligonuc1eotide Assay Electromagnetic
Fluorescence In Situ Hybridization Green Fluorescent Protein
Gouy layer
General Purpose Interface Bus
Human Epidermal growth factor Receptor 2 Helmholtz double layer
lnfectious Brain Homogenate
Interdigitated Microelectrodes Array Immunoglobulin: Ig
lmmunomagnetic Electrochemical Assay Ion-Sensitive Field-Effect Transistor
Laboratory Virtual Instrument Engineering W orkbench Luria-Bertani
Low Capture Efficiency Laser-Induced Fluorescence Laboratory-on-Chip
Limit of Detection
Minimum Detectable Signal MicroElectroMechanical Systems
MFC: IlTAS : MlM: MLoC: MMCC: MR: MRM: MRM: NADH: NMR: OCP: OFS: OS: PBP: PDEIS: PDMS: PIN: PLOC: PMFC: PMMA: PMP: PMT: POCT: PT: RE: RF: RGA: SCCA: SCR: SEl: SNR: SPR: SQUID: SS: TIA: VCOs: VI: VISA: VLSI: VPNP: VPTA: WE: WEC: WEG: ZIF: Microfluidic channel
Micro Total Analysis Systems Metal-Insulator-Metal
Multi-Lab-On-A-Chip
Metal-Metal Comb-Capacitors Magnetic Resonance
Magnetic Resonance Microscopy Magnetic Resonance Microscopy Nicotinamide Adenine Dinucleotide Nuclear Magnetic Resonance Open Circuit Potential
Optical Fluorescence Spectroscopy Optical spectroscopy
Pre-Bake Process
Potentiodynamic Electrochemical Impedance Spectroscopy PolyDiMethylSiloxane
Positive-Intrinsic-Negative (PIN) photodiode Polymer Lab-On-A-Chip
Polymer Microfluidic Chip Polymethyl-Methacrylate Paramagnetic Particles Photomultiplier Tube Point-Of-Care Testing Phototransistor Reference Electrode Radio Frequency
Regulated Gain Amplifier
Squamous Cell Carcinoma Antigen Space-Charge Region
Silicon and Electrolyte lunction Signal-To-Noise Ratio
Plasmon Resonance
Superconducting Quantum Interference Device Surface States
Trans-Impedance Amplifier Voltage-Controlled Oscillator Virtual Instruments
Virtual Instrument Software Architecture Very Large Scale Integrated
Vertical P-N-P transistor Vertical Phototransistor Array Work Electrode
Working Electrode Collector Working Electrode Generator Zero Insertion Force
1.1 General Introduction
Biosensors are analytical devices that combine a biologically sensitive element with a physical or chemical transducer to detect the presence of specific compounds selectively and quantitatively. This thesis explores the feasibility of microelectronic techniques in a successful attempt to get huge co st savings in mass production, fast reacting, and disposable biosensors [1]. Biosensors can be sorted by their input signal domain, physical and chemical biosensors. Physical biosensors include optical, magnetic, thermal and mechanical sensors. The chemical biosensors can be divided according to the transduction mode. In biosensors, natural materials are coupled to physical transducers.
Biosensors can also be categorized according to the production techniques. A microsensor is a device requiring microfabrication technology. Microfabrication is used by the semiconductor (electronics) industry to produce integrated circuits (les). As Bergveld showed in 1970 [2], design and packaging are important in the development of electrochemical "m inisensors". They are even more crucial in manufacturing micro- and nanosensors. These biosensors are characterized by their small active sensing areas, while the size of the chip is still in the macroscopic range. Subsequently, these sensors can be Solid-state, integrated, pl anar, and smart sensors. The sold-state sensor refers to the device. that deals with the response in the solid. The integrated sensor is made using the bulk of the silicon, while the planar uses the surface of the silicon. Therefore, the combination of the
integrated and the planar produces the smart sensor often called the intelligent sensor [3]. The high Signal-to-Noise Ratio (SNR) and the electromagnetic interface characteristics made the smart sensor the best technique to implement biosensors. Semiconductors rapidly became on high demand to mass-produce these miniature devices at very low cost compared to conventional methods.
There is a strong demand for biosensors in the food production industry to follow the various steps in production, and control the quality of the final products. Therefore, the biomedical sector constitutes a potential market for biosensors, in most of life's aspects. Biosensors that are based on the enzymes that act as catalyst sensors were used to be studled and commercialized for the requirements of biomedical analysis. For instance, the glucose oxidize was the first electrode that is used to determine glucose in blood and urine for the diagnosis of diabetes. Other biosensors use either enzymes or antibodies to determine neurotransmitters, hormones and other metabolites. An implantable biosensor system is discIosed for determining levels of cardiac markers in a patient to aid in the diagnosis, determination of the severity and management of cardiovascular diseases [4]. It does provide access to precise regions of the human body, without consuming, or removing, biological fluids. Implantable biosensors yield immediate results, which are extremely useful ifrapid decisions are to be made, for example, during surgery [5].
A biosensor in most general cases is constructed from a combination of a bioreceptor; the biological component, and a transducer; the detection method. The main function of a biosensor is to transform a biological event into an electrical signal. Figure 1-1 represents the principle of the operation of a biosensor, which is starting from the analyte that can provide ail the information needed for its evaluation. This information can be processed
and stored for later use. The process of the analysis is starting from the analyte, which is identified by the first connection of a biosensor named "the bioreceptor".
Figure 1-1 General Model for Biosensors, differentiating between molecular recognition, transduction and data processing.
The second stage of a biosensor is the transducer that takes advantage of the biochemical modification of the substrate by the bioreceptor through transforming it into an electrical signal.
Table 1.1 Common Biological Recognition Elements.
Biological Element Mechanism for Recognition
Antibodies and antigens Based on the specific and high-affinity antibody-antigen binding interactions to generate a detectable signal. Biomimetric receptors Genetically engineered biomolecules RNA and DNA
aptamers.
Enzymes Alteration of an analyte to induce or generate a signal that can be detected by the transducer.
Non-enzymatic proteins A protein that produces a signal through a transmembrane ion channel leading to activation system.
NucJeic acids Detection of specific DNA sequences by hybridization. Whole cells A substance-dependent boost or embarrassment of
Consequently, the type of biochemical modification is playing an important role to define the choice of transducer. Having the right transducer should comply with sorne requirements; such as optimal use of the product of the bioreceptor and give a signal that is sensitive, easily monitored, and has minimal background noise. Low background noise reduces the detection limit and improves the biosensor performance.
The combination of any bioreceptor with any transducer leads to a large number of biosensors. Table 1.1 summarizes the state of biosensor research as a function of the different possibilities of coupling between various bioreceptors and transducers. Table 1.2 demonstrates how it is possible to c1assify biosensors with respect to either the bioreceptor or the transducer employed.
Table 1.2 Design Parameters for Selecting a Transducer for a Biosensor.
Parameter Definition
Sensitivity (S) S =
~~
where Llx is the input of the biosensor and Lly is the output Linearity Linear system; y = Kx , Nonlinear system: y = [ex).Working range (WR) WR
= V
max - V min values that can be measured by the biosensor. Accuracy (A) A = Mv -Av; the Mv = measured and Av = actual values.Repeatability The variation in reading under the same condition. Resolution Minimum detectable signal.
Output Voltage signal is preferred due to readily gather the data with no extra hardware that may increase the source of errors.
Response time The response time is measured from the start of an input change tiU the output stable.
Bandwidth The output of a physical transducer is dependent on the amplitude and frequency of an input signal.
Considering that molecular recognition generally uses well-defined reaction types and that the detection method may be extremely varied, it is logical that biosensors should be classified primarily as a function of the bioreceptor used. On the other hand, using the classification by bioreceptor is worthy and trustful because this component determines the primary action of the biosensor. Nevertheless, for the laboratory that only deals with enzymes, a classification according to the transducer employed optical, electrochemical, thermometric, magnetic, can be used [6].
The recognition process of an organic or inorganic substrate by a receptor-molecule generating a host-guest product is considered as the key to the design of a chemical or biochemical sens or as shown in Figure 1-2. The biosensing system used in this work for biological detection is a chemical sensor making use of biological components as a sensing interface. A biosensor is made of two components: a receptor and a detector. The receptor senses the variation on the surface and then converts the difference to a measured electrical signal as shown in Figure 1-3.
ID which 3 ch .. miC21 re3.c.RoD 1\itt. p.rricip.tioa of fit. Figure 1-2 Receptor priaciples la wllich. biochemical
process is tlae source
of tlle aaalyticai sigaal.
One of the main biological recognition e1ements is the enzyme, which are proteins that catalyze chemical reactions where they are reacting reversibly. Biosensors are a subgroup of chemical sensors where the detection of a chemical component is based on a specific interaction of this chemicàl component with a biorecognition molecule, being an enzyme,
antibody, aptamer,-microorganism, or even a whole cell. This biological sensing element is integrated with or is in intimate contact with a physicochemical transducer [7].
Figure 1-3 Biosensors categories.
A wide range of transducers is available to detect the interaction between the analyte and the biorecognition molecule and convert it into an electronic signal. Electrochemical,
optical, thermal, and mass sensitive transduction mechanisms have been used in biosensor development over the past decade [8]. Figure 1-1 illustrates the general Model for Biosensors. A high selectivity and specificity, a relatively low production cost, a limited sample preparation time, and the potential for miniaturization are the main advantages of biosensors over conventional analytical methods [9]. Although, the healthcare industry and its high demand is pushing forward the development of biosensors, there have been many
During the evaluation phase, often only direct cost reductions and investments are considered. Because investments are often significant, the benefits are not always completely seen at early stages of the project, therefore standoff detection techniques [11] are required. Standoff detection technologies are a sensing performed in real time that involves decision making at a distance within a certain period. Real-time standoff biological sample detection is at this time. playing an important role in life science applications and medicine [12].The principal advantages of standoff detection techniques are the reduction of the analysis time, reduction of the cost of analysis, shortening of the release time, and, as a consequence, lowering of production costs. Additionally, operators can improve their process understanding, control of the process, and, as a consequence, the first time quality because of improved product consistency.
Recently, sensor technology is applied in every aspect of life so that considerable efforts are given to improve the performance of the biosensors and reduce the co st of production. Biosensor technology also benefits from the fast growth of the microelectronic industry, which results in advanced biochips by combining the knowledge of the microfluidic with microelectronics [13]. Although the performance of a biosensor is evaluated based on a particular application, one should address the basic performance criteria in the design of successful biosensors such as sensitivity, detection and quantitative determination limits, selectivity and reliability, response time, high sample throughput, reproducibility, stability, and lifetime. In addition, the complete biosensor should be cheap, small, portable, and easy to use [14].
The biosensor must also meet requirements connected with the measurements itself; these are repeatability, reproducibility, selectivity, sensitivity, a linear region of response,
and good response time [15]. Measurements have good repeatability if two sets of results obtained by the same operator, using the same sensor in the same sample are close to each other. The method is reproducible if workers in other laboratories can obtain previous results. For commercial purposes, the biosensor should have high reproducibility.
Biosensors are also categorized in terms of their ability to recognize a single compound among other substances in the same sam pie. This specificity quality is defined by the strength of the interaction between a molecular probe (e.g., antibody) and an antigen (target analyte) as estimated by the dissociation constant Kd. The smaller the Kd the higher the specificity of binding. Specificity is often impossible to obtain, and so the term selectivity is used [16]. Selectivity can be estimated from dose responses of a biosensor to different analyte; i.e. bacteria, which means that an interfering species responds with the same type of signal. A sensor is more selective when the number of interfering compounds is low. The selectivity of biosensors is determined by both the bioreceptor and the method of transduction. Selectivity and specificity are related to each other. High selectivity means that the contribution of an interfering species to the signal relative to the primary analyte is minimal. Specificity, on the other hand, characterizes the unique property of a bioreceptor [17]. The sensitivity of a sensor is given by the change in its response as a function of the corresponding change in the quantity being monitored. Biosensors are more convenient to use ifthey exhibit a linear relationship between the variation in the amplitude of the output, 11 Va, and the input, 11 Vi as described by equation below:
(l.1 )
The linear region of a biosensor is obtained from a calibration curve of its response to different analyte concentrations. A good calibration curve also indicates the stability of the
response of the biosensor, which should neither drift nor oscillate with time. The response time of the biosensor gives a measure of how quickly it responds to a variation in the concentration [16].
1.1.1 Biosensors Techniques
In biosensors where, in principle, the transducer plays a physical role and the bioreceptor has the task of molecular recognition. The information decoded by the bioreceptor is converted into an electrical signal by the transducer using measuring techniques like potentiometry, amperometry, thermometry, or photometry, ail of which are based on the variation of physical quantities. The method chosen must be simple and of a reasonable size, so that it is cheap and easy to use.
The detection part in the biosensor can be achieved using various techniques, su ch as optical, capacitive, magnetic, and Electrochemical Impedance Spectroscopy (EIS). The selection of detection technique relies on the nature of the application and the accuracy of the analysis requested. In most general circumstances, these are the major princip les techniques for analyte detection. The following section presents a brief introduction to the most widely utilized detection methods employed in biosensors.
1.1.1.1 Optical Techniques
Spectroscopy was originally the study of the interaction between radiation and matter as a function of wavelength
O
.
) [18]. Optical sensors make use of the effect of chemistry
reaction on optical phenomena, such as Fluorescence spectroscopy, which is a sort of electromagnetic spectroscopy, which analyzes fluorescence from a sample. It involves using a beam of light, usually ultraviolet light, that excites the electrons in molecules of certain compounds and causes them to emit light of a lower energy. The most populardetection method is laser-induced fluorescence (LIF) for its high sensitivity [19], and absorption spectroscopy, which is a technique in which the power of a beam of light measured before and after interaction with a sample, is compared. Specific absorption techniques tend to be referred to by the wavelength of radiation measured such as ultraviolet, infrared or microwave absorption spectroscopy [20], and chemiluminescence technique, which is a technique that refers to the emission of light from a chemical reaction; that was first coined by Eilhardt Weidemann in 1888. [21].
1.1.1.2 Electrochemical (EC) Techniques
So far, optical techniques; particularly LIF detection is the most widespread detection method used in the industry. However, its major drawback is so c1ear in which most compounds are not naturally fluorescent, thus further steps are required to change the separation properties of the analytes. Moreover, the high cost and large size of the instrumental set up of the LIF detection are sometimes incompatible with the concept of micro total analytical systems (fl-TAS) [22], especially with the applications when portability and disposability are necessary, such as point-of-care or in-situ analysis. This is quite the opposite of the electrochemical (EC) technique [23], it is preferably suited to miniaturization, biomedical and biological samples analysis. CMOS technology that is compatible with MEMS devices allows fabrication of biosensor devices such as microelectrodes on a single chip. Consequently, it is leading to a fully integrated system. The principle transducing that is based on the electroanalytical chemistry can achieve more th an one method, for instance, potentiometry, voltammetry, and conductometry [24]. Therefore, electrochemical technique is considered and it attracts a large number of scientists and researchers. The Electrochemical Impedance measurements expressed in
terms of a magnitude, Zo, and a phase shift, <p and plots in either Nyquist or Bode plot. Nyquist Plot can be obtained using the expression for ZC w) that is composed of real and imaginary parts, by plotting the real part on the X-axis and the imaginary part on the Y -axis of a chart. The major deficiency ofNyquist plots is that it cannot enlighten what frequency was used to record a specific point. Therefore, an alternative method to analyze the data of EIS based on the Bode plot is used. Unlike the Nyquist plot, the Bode plot does show frequency information, which shows on the X-axis the plotted logarithmic values of the frequency Cw) and shows on the Y-axis both the absolute values of the impedanceCIZI
=
Zo) and the phase-shift. Bode plots have a logarithrnic axis for frequency, and magnitude is expressed in decibels (dBs). Figure 1-4 shows the general Nyquist plot [25].-ImZ
0=0
\
/
l L - _ - L _ _ _ _ _ _ _ _ _ _ ---'-''---~ ReZ
o R
Figure 1-4. Nyquist plot illustrates the characteristics of the impedance.
1.1.1.3 Microjluidic channel fabrication
Biosensors is working along with microfluidic functions that can be readily integrated on microchips; using surface and bulk silicon structure with sorne materials that are compatible with biological issues, such as PMMA, and PDMS. High-performance detection is strongly requested. Consequently, the final success of a Il-TAS is highly determined by the ability of researchers and engineers to realize detection methods that
utilize the advantages of reduced diffusion lengths and confined geometries, while also solving the challenges imposed by su ch miniaturization [26].
Microfluidic channel fabrication depends on master molds. Fabrication of master molds is the key to the replication technologies. There are three methods that are utilized for master molds fabrication, including micromachining methods [27], electroplating methods [28] and silicon micromachining methods [29]. After master molds have been fabricated, several methods can be applied for the replication step, such as hot embossing, injection molding and casting [30]. Creating a master requires basically couple of technologies, soft-photolithography and rapid creation of a master prototype, these are the most common methods that's employed to achieve off-chip biosensor, on-chip sensor can be done using post-CMOS process, which adds more complications to biosensors development. Soft-photolithography is a set of non-photolithographic methods for replicating patterns. A cleanroom protocols are not essentially requiring for the soft-photolithography methods for replication resolution in micro scale [31].
Figure 1-5 Microfluidic channel fabrication using photolithography and Rapid prototyping techniques
The second technique is rapid prototyping begins with creation of a design for a device in a using Electronic Design Automation tool (EDA) like Cadence program for example. Then; the design conveys on to a glass "Mask" using high-resolution mask aligner, which lately uses in contact photolithography to produce a pattern of photoresist. Then polymeric substrate such as PDMS is spread against the master made of patterned photoresist, to form the desired device. Figure 1-5 shows the microfluidic channel fabrication using soft-photolithography and rapid prototyping techniques. There are sorne requirements as mentioned in details before, but for microfluidic detection compared to those of conventional analytical systems. If we put the tremendously small volume and the cell size into account, a higher sensitivity and special structures are strongly required. As a result, the time that passes the channel would be short so the detector should have faster response times.
1.1.2 Biosensors instrumentation and CMOS Technology
In terms of instrumentation, a biosensor is defined as a measuring device that exhibits a characteristic of an electrical nature (charge, voltage or current) wh en it is sùbjected to a phenomenon that is not electric. The electrical signal it produces must carry ail the necessary information about the process under investigation. Under this definition, a sensor could be regarded as a transducer as long it is capable to transforms one physical quantity into another. This idea is restrictive because a transducer is a quantitative device; a sensor actually possesses a much larger capacity. First, it should recognize the phenomenon, in a specific way if possible, and must translate it into a quantifiable property, which is then transformed into an electrical signal by a transducer. Thus, the original event is represented as an electrical signal and modern techniques of data collection and control can be applied
[32]. In a biosensor, the phenomenon is recognized by a biological system called a bioreceptor, which is in direct contact with the sample and forms the sensitive component of the biosensor. The bioreceptor has a particularly selective site that identifies the analyte. Most biosensors make use of existing transducers and the instrumentation already associated with them. The principal modifications are made to the part of the transducer where the biological system is to be situated. Biological systems must be renewed periodically to maintain an optimal activity and the membranes that carry proteins and other reactive substances are much easier to handle if they are removable or disposable components [33]. The choice of biosensor is often related to the cost of the instrumentation for a given application. Biosensors will be used more extensively in health care in the
future, if their total cost, inc1uding the instrumentation, is not excessive. In this respect,
electrochemical biosensors appear to be weil placed, requiring apparatus that is both simple
and small. Optical biosensors generally require much larger apparatus with systems of
lenses, mirrors, monochromators, and photomultipliers. Ali biosensors need a recording
system to observe the reproducibility of the signal. This also indicates the nature of the
response curve and detects any irregularities. Furthermore, it provides a permanent record
of the behavior of the biosensor during both calibration and the determination itself [34].
Microsensors can be in microelectrodes, nanoelectrode, and ultramicroelectrode size
[35]. The name "microsensor" means that the size of the active sensing area is in the micro
range, whereas the sensing device itself is much larger and designed so that it can be
handled easily. Miniaturization may result in a stronger device, such as the
voltammetrically operated ultramicroelectrodes [36]. Despite the fact that the dimensions
information may be greater. In the case of biomedical sensors, increasing the information gathering capability per unit volume is often the motivation for integrating electronics in the system. Integration also results in sorne very promising properties, besides the resulting system is more versatile, it allows drifts to be corrected; fitting and calculation software to be implemented for the measurement based on nonlinear calibration functions; and
interferences to be compensated by using sensing arrays. Merging sensing elements with
electronic devices for transduction and readout has led to new capabilities, but has also imposed sorne constraints on the biosensor system; the size of the biomolecular samples [37]. Smaller sensor and sensing layer areas is highly request to improve their performance by reducing distances between electrodes, thanks for miniaturization and Nanotechnology. For these electrodes, sensitivity refers to the decreasing surface area exposed to the target analyte. For that reason, ultramicroelectrodes are often used in spectroelectrochemistry [38]. The thickness of the sensing layer in biosensor is a figure of merit. In optical transmission sensors, however, the optical path length is equal to the thickness of the optical sensor (optode) membrane. In optical bulk membrane, technology the optical sensing layer equilibrates with the target analyte in the sample phase. Therefore, the thickness of the sensing layer determines not only the speed of equilibration, but also the optical path length. So reducing thé thickness of the sensing layer also increases the sensitivity [39].
1.1.3 Immobilization
In biosensors, functionalization the surface of the bioreceptor is very important step to
be occurred in order to integrate the selected biorecognition elements. This is one of the most critical steps in biosensor development because biosensor performance (sensitivity,
dynamic range, reproducibility, and response time) depends on how far the original properties of the bioreceptor are kept after its immobilization. Therefore, bioreceptor requires direct or indirect immobilization on transducers to ensure maximal contact and response. Immobilization technique used for the physical or chemical fixation of cells, organelles, enzymes, or other proteins such as monoclonal antibodies, onto a solid support and solid matrix or retained by a membrane, in order to increase their stability and make possible their repeated or continued use. Immobilization has the advantage of stabilizing the protein so that it can be used repetitively. The sensing properties of a sensor depend on the physical-chemical environment of antibody and antigen-antibody complex, which are in turn determined by antibody immobilization techniques such as adsorption techniques [40], entrapment [41], cross-linkage [42], or magnetic microbeads [43].
Functionalizing the surface of the biosensor; glass or silicon by a chemical material such as epoxysilane, polylysine or aminosilane; facilitates bonding the biological recognition elements such as enzymes [44], antibodies [45] or reporter genes [46]; to the surface; i.e. polymer, glass or silicon of the biosensor.
1.2 The problem and the general framework of research
By far, the main pathogen detection methods use DNA microarray techniques. These methods rely on Petri culture, colony counting and Enzyme-linked Immunosorbent assay (ELISA); which also rely on antibodies or nucleic acid polymerase chain reaction (PCR) detection [47]. The reason for this is the high selectivity and reliability ofthese techniques, which have different strengths and weaknesses. Culture and colony counting is the oldest method and is the one that is generally considered as the reference. It enables the detection of viable cells, but it is labor intensive and takes up to several days to obtain results.
Biosensors are relatively new players in the pathogen detection arena and the use of biological recognition element generally limits their performance. Such recognition elements are mostly antibodies or DNA sequences. While DNA based methods are excellent for their selectivity and long-term stability, they usually are unable to discriminate between viable and non-viable cells. Furthermore, antibody based biosensors are generally very expensive to produce and may suffer from cross binding of other bacteria, which would lead to false results.
Miniaturization of biosensors is one of the recent trends aImmg towards both increased performance and portability along with low cost for mass production. To do so, ail the geometric and operational parameters have to go through proper optimization. However, it is both time-consuming and costly to study the effects of those parameters on performance by conventional prototyping. The modern approach of numerical prototyping is formulating mathematical models that best describe the system and use powerful computers to find the optimum design parameters. This does not only cut the cost of experimentation by reducing the number of experiments needed to analyze a particular problem , but it can also be used to explore problems that are difficult or expensive to test and make extrapolation to the uncultivated regions. Developing and producing miniature analytical instruments and devices can achieve a number of advantages; besides rapidly analyzing extremely small amounts of substance, it can also perform on-site analysis and analysis in security areas. Micro/Nanochip analytical devices that lead to multi/single Lab-On-A-Chip devices are microdevices that merge microfluidic technology with electrical and/or mechanical functions for analyzing tiny volumes of biological sample. Analytical microdeivces can perform a progress through two ways to produce more versatile and
sm aller instruments. Firstly, developing the entire miniaturized systems in which they are capable and attractive devices for the analysis of pico-, femto-, and atto-molar quantities of biological and biomedicine samples, and secondly, developing dedicated systems by accelerating the development of chemical sensors, sensor arrays, and microsensors. In addition, miniaturization might be able to produce an instrument combining or hyphenating miniaturized single elements based on different working principles without sacrificing their versatility.
The combination of both the surface-bound antibodies for identification and the surface interaction for detection process is the mechanism of the conventional detection techniques. This technique has limitations because of the inadequate biomolecular binding to the sensing surface. This is because the biomolecular binding is too sm ail to move from the suspension and bind to the functionalized sensing surface. Recently; the specification and the behavior of the biosensors overcame this serious issue due to their high sensitivity, specificity, selectivity and improved accuracy. Therefore, the multi-Iab on a single chip technology (MLoC) enhanced the modern detection techniques by including capacitive (CBCM), optical, electrochemical (EIS) and magnetic techniques ail on one single chip. CMOSIMEMS technologies, integrated microfluidic channel, sorting, and biomolecular cells identification on a sort of substrates such as glass, polymer or plastic are the basis of modern biosensors (i.e. MLoC, micro total analytical systems (~-TAS), etc ... ). Note that miniaturizing of the sensing systems allows faster detection of tiny volumes of biomolecular cells than that of the macroscale analysis techniques, which in sequence facilitates the new generation of biosensors that exhibit rapid biological samples detection, leading it to be fit for point-of-care diagnostics. The performance of the biosensors should
be high enough to detect pathogens at low-Ievel concentrations of biomolecular cells, which is enough to cause a disease. Such transducers could play a significant role for monitoring contamination of water supplies with pathogens. Therefore, performing successful detection at low concentration depends on reliability, sensitivity and short timing to obtain results, which become the main characteristics of biosensors. The measurement for this low level of concentration should pass through a protocol starting from the location where the samplepicks up. Then the surface goes through modification followed by the treatment that binds it onto the sensing surface until finally the system reads out the results.
The aforementioned approaches so far (the CBCM, Optical and EIS methods) required sample pre-treatment steps and signal amplification strategies, which cause sorne complications and challenges. Therefore, this work presents a novel microsystem that integrates a fishing system with the interdigitated microelectrodes arrays (IDMA), which may lead to highly functional and versatile biosensor systems, bacteria detection with high sensitivity, and fast-response times based on CMOS microcoil. Magnetic particles are ideal to solve both challenges at once, since the magnetic fields can easily manipulate them.
1.3 Originality
The thesis includes a variety of techniques that conducts transducers as biosensors, which produces a novel outcome. The single die has ail of the biosensors implemented within it using CMOSP35 TSMC technology available through the Canadian Microelectronics Corporation (CMC), which leads to a reduction of features that enhances and improves the new generation of multibiosensors, named multi-Iabs-on-a-single chip (MLoC) system by increasing its sensitivity. Implementing MLoC system exhibits eminent capability to achieve high performance of detecting biological samples. The
achievement of this objective depends on developing and fabricating a low-cost disposable OFF-chip microfluidic channel interface (MFCI) incorporating it with the interdigitated microelectrode arrays (IDMA) using the soft photolithography technique in the c1eanroom environment that will ail work along with the MLoC system. At the end, the MLoC system goes through testing and validation using the Labview software.
Furthermore, each single biosensor out of four has a pew modification in design. For the CBCM technique, a new layer sited on top of the reference capacitor isolates it. This layer consists of two metals that protect it from any external contamination in the course of running the experiment without altering the valu~ of its capacitance. For the optical biosensor, and in the light of the fact that the sensitivity of the optical sensor depends on the exposed area to the light, the surface increases to the VPNP phototransistor 32 x 32 arrays instead of 16 x 16 arrays, also, the chip contains ail the required resistors on-chip. For the electrochemical impedance technique (EIS), ail of its stages implemented on-chip includes voltage controller and signal-processing unit along with their associating capacitors and resistors. For the CMOS Microcoil biosensors technique, the entire sensor implemented on-chip includes the IDMA sited on the top of the microcoils for magnetic field manipulation. The work includes two types of IDMA; on-chip using CMOS technology for CMOS Microcoil sensor and OFF -chip on MFCI surface using soft photolithograph technique inside the c1eanroom. 1 wrote the Labview code to thoroughly control the experiment and provide us with useful information.
1.4 Objectives
The main objective of this thesis is to develop novel multibiosensors that integrate state-of-the-art technologies that lead to a new generation of multilabs on a single chip
(MLoC). The mam outcome of this work is to allow detection and quantization of biological sample using miniature devices at a lower cost. Developing and fabricating the following elements will help achieve this objective:
1. An integrated circuit reading from an interdigitated microelectrodes array
(lDMA);
2. A low-cost disposable-type microfluidic channel, which consists of an array of interdigitated microelectrodes, will act as a sensing layer for CMOS microcoils biosensors to perform impedance measurements through the magnetic field manipulations.
3. The integration of the microelectrode chip with a simple microfluidic channel interface (MFCI) acts as working electrode for electrochemical impedance spectroscopy measurements (off-chip);
4. Characterization, testing and validation ofthe entire MLoC integrated system.
5. Test environment automation for ease to extract the measured data that the Labview software will post process and analyze.
This work introduces a novel biosensor integrating state-of-the-art technologies that will allow the detection and quantify biological cells in freshwater, food, and other biological fluids.
1.5 The Methodology
As stated, the traditional biosensor methods are labour intensive and take up to several days to obtain results. Miniaturization of biosenso,rs is one of the recent trends aiming towards both increased performance and portability along with low cost for mass
production. To do so, ail the geometric and operation al parameters have to go through proper optimization. Accomplishing this miniaturization can be achieved through using CMOSP35 TSMC technology available through the Canadian Microelectronics Corporation (CMC) to design and fabricate the chip. Figure 1-6 shows these prototypes and will be unfolded in the following sections.
Figure 1-6 The layout of the entire biosensors devices on a single chip.
1.5.1 Research Design Strategy
Yielding the objective of this work can be reached by developing the entire miniaturized systems in which they are capable and attractive devices for the analysis of pico-, femto-, and atto-molar quantities of biological and biomedicine samples, and secondly, developing dedicated systems by accelerating the development of chemical sensors, sensor arrays, and microsensors. In addition, miniaturization might be able to produce an instrument combining or hyphenating miniaturized single elements based on different working princip les without sacrificing their versatility.
1.5.2 A CMOS Resizing Methodology
Resizing CMOS transistors is a crucial step for the reprocess of analog circuits. A technology migration can be achieved by resizing the methodology that should keep or advance and enhance the original design's figure of merits, which are performance, reduction of the area of the device and power consumption [48]. The resizing methodology of CMOS transistors passes mainly through defining the features that should be maintaining, and then determining the new transistor sizes by finding the aspect ratio in the light of the results that are figured out.
1.5.3 Research tools
CMOSP35 TSMC technology available through the Canadian Microelectronics Corporation (CMC) to design and fabricate the chip was used to resize the transistors and get the technology migration from macro scale to micro scale or smaller. The experiment setup reads out the result using the Labview software. In addition, the cIeanroom facilities were got involved for MEMS fabrication.
1.5.4 Data analysis
The result that carried out from the experiment set up is analyzed and manipulated to be used for validating the system.
1.5.5 Limitations and challenges
As with any of the traditional biosensors, the MLoC system has its limitation due to the size of the biomolecular cell. Therefore, becoming familiar with the application in ad vance
is necessary to design the biosensor but thus far, it remains a challenge for researchers in these fields.
1.6 Structure of thesis
The thesis includes a variety of techniques that are conducting biosensors as transducers. The single die has aIl of the biosensors implemented within it, which leads to a new generation of multibiosensors named as multi-labs-on-a-single chip (MLoC).
The thesis is organized in six chapters and three appendices. The tirst chapter includes
the general introduction and discusses the problem, the objectives, the originality, the
methodology, and the state of the art of the existing biosensors techniques. The second
chapter unfolds the details behind the new design of the multibiosensors that are implemented on a single chip; this chapter focuses on the CMOS capacitance biosensor that is based on Charge-Based Capacitance Measurements (CBCM), design and simulation. The chapter then goes through the experimental setup for validating the biosensor and it ends up
with sorne experimental results and conclusion. The third chapter unfolds the novel design
behind the optical biosensors. These sensors were implemented using CMOSP35
technology on a single-chip that covers optical spectroscopy, VPNP design, operation,
characteristics and structure. This chapter is concluded by sorne experiment procedures followed by the results and conclusion for the different cases for validation purposes. The
fourth chapter expands on electrochemical impedance spectroscopy techniques for
electrochemical sensing biomolecules. It details the biosensor principles, architectures and
behavior, and th en features the electrochemical detection techniques. The IDMA
microfabrication and its characteristics, its influences and the advantages are discussed in
measurements. This chapter is concluded with sorne equivalent circuit modeling of the immunosensor system including the experiment set-up along with sorne results to validate
the system and a conclusion. The fifth chapter describes CMOS Microcoils, and magnetic
field manipulation techniques. A CMOS IC microcoil array architecture and design is shown and discussed followed by a detailed description of the digital design of the control
circuit and impedimetric biosensors based on CMOS technology. Moreover, the behavior
and characterization of microcoil using the impedance concept and the equivalent circuit modeling of the immunosensor system is demonstrated along with sorne experimental setup protocols to validate the system and the chapter ends up with the conclusion. The last
chapter summarizes the overall conclusions for the whole system. It also demonstrates the
contributions and suggestions for future works and challenges. Useful information is included in the following appendices:
1. Appendix A: Labview programming and code source,
2. Appendix B: Experimental Procedures' Images for (MLoC) system, 3. Appendix C: French summery for the entire thesis.