Assessing Plastic Pollution in the Ligurian and Tyrrhenian Seas
Jessica Caldwella, Alke Petri-Finka, Barbara Rothen-Rutishausera, Roman Lehnera,ba Adolphe Merkle Institute, Université de Fribourg, Chemin de Verdiers 4, 1700 Fribourg, Switzerland b Sail and Explore Association, Kirchweg 42, 8755 Ennenda, Switzerland
Supporting Information
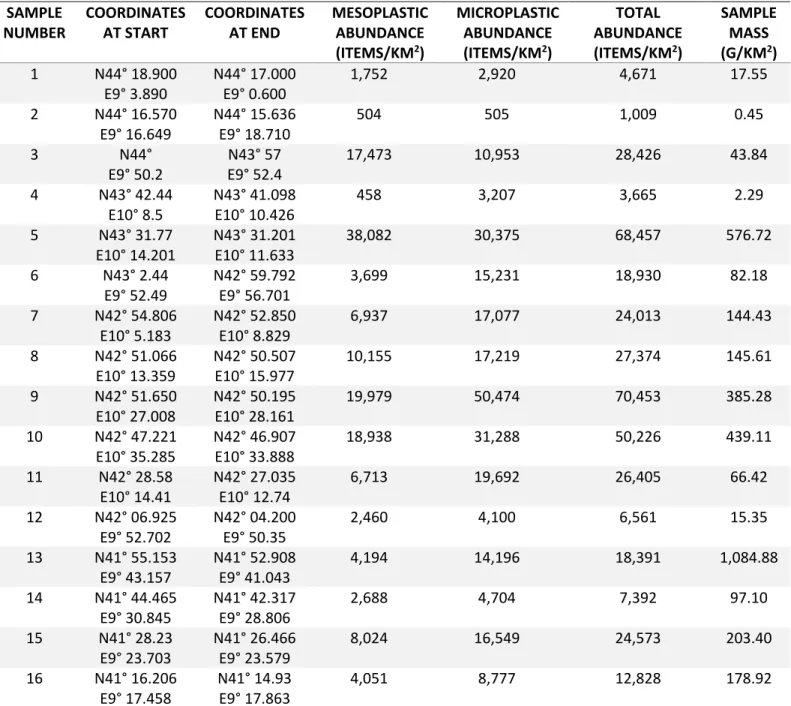
Table SI1: A summary of the abundance, mass, and sampling location for each collected sample.
SAMPLE NUMBER COORDINATES AT START COORDINATES AT END MESOPLASTIC ABUNDANCE (ITEMS/KM2) MICROPLASTIC ABUNDANCE (ITEMS/KM2) TOTAL ABUNDANCE (ITEMS/KM2) SAMPLE MASS (G/KM2) 1 N44° 18.900 E9° 3.890 N44° 17.000 E9° 0.600 1,752 2,920 4,671 17.55 2 N44° 16.570 E9° 16.649 N44° 15.636 E9° 18.710 504 505 1,009 0.45 3 N44° E9° 50.2 N43° 57 E9° 52.4 17,473 10,953 28,426 43.84 4 N43° 42.44 E10° 8.5 N43° 41.098 E10° 10.426 458 3,207 3,665 2.29 5 N43° 31.77 E10° 14.201 N43° 31.201 E10° 11.633 38,082 30,375 68,457 576.72 6 N43° 2.44 E9° 52.49 N42° 59.792 E9° 56.701 3,699 15,231 18,930 82.18 7 N42° 54.806 E10° 5.183 N42° 52.850 E10° 8.829 6,937 17,077 24,013 144.43 8 N42° 51.066 E10° 13.359 N42° 50.507 E10° 15.977 10,155 17,219 27,374 145.61 9 N42° 51.650 E10° 27.008 N42° 50.195 E10° 28.161 19,979 50,474 70,453 385.28 10 N42° 47.221 E10° 35.285 N42° 46.907 E10° 33.888 18,938 31,288 50,226 439.11 11 N42° 28.58 E10° 14.41 N42° 27.035 E10° 12.74 6,713 19,692 26,405 66.42 12 N42° 06.925 E9° 52.702 N42° 04.200 E9° 50.35 2,460 4,100 6,561 15.35 13 N41° 55.153 E9° 43.157 N41° 52.908 E9° 41.043 4,194 14,196 18,391 1,084.88 14 N41° 44.465 E9° 30.845 N41° 42.317 E9° 28.806 2,688 4,704 7,392 97.10 15 N41° 28.23 E9° 23.703 N41° 26.466 E9° 23.579 8,024 16,549 24,573 203.40 16 N41° 16.206 E9° 17.458 N41° 14.93 E9° 17.863 4,051 8,777 12,828 178.92
17 N41° 10.6 E9° 35.4 N41° 10.1 E9° 37.8 1,413 4,238 5,651 11.68 18 N41° 6.58 E9° 46.9 N41° 3.351 E9° 47.257 4,920 11,208 16,128 56.56 19 N40° 59.55 E9° 43.34 N40° 58.45 E9° 41.5 4,489 23,939 28,428 72.67 20 N41° 6.55 E9° 47.12 N41° 7.8 E9° 47.9 5,127 6,409 11,536 9.81 21 N41° 34.006 E9° 22.18 N41° 35.46 E9° 23.3 1,055 527 1,582 5.96 22 N41° 37.706 E9° 25.845 N41° 37.914 E9° 27.013 12,784 22,618 35,403 567.92 23 N41° 42.712 E9° 27.588 N41° 44.13 E9° 27.909 9,237 14,164 23,402 1,999.79 24 N42° 11.23 E9° 45.64 N42° 12.41 E9° 42.29 2,892 4,820 7,712 51.02 25 N42° 17.753 E9° 51.405 N42° 19.418 E9° 52.410 4,854 21,845 26,699 65.73 26 N42° 42.282 E10° 17.710 N42° 41.804 E10° 19.755 1,679 5,037 6,716 4.70 27 N42° 45.4 E10° 28.68 N42° 47.085 E10° 29.099 26,365 66,690 93,056 740.99 28 N42° 52.358 E10° 29.586 N42° 52.898 E10° 28.554 0 5,705 5,705 21.49 29 N42° 52.830 E10° 13.591 N42° 53.3 E10° 12.662 28,835 93,982 122,817 1,017.68 30 N42° 57.566 E10° 1.135 N42° 58.416 E9° 59.552 15,373 30,745 46,118 305.24 31 N43° 1.732 E9° 38.69 N43° 3.128 E9° 37.82 8,652 16,728 25,380 536.51 32 N44° 7.012 E9° 39.547 N44° 7.55 E9° 37.06 1,419 4,733 6,152 32.09 33 N44° 12.349 E9° 26.128 N44° 13.13 E9° 23.791 8,573 14,288 22,861 43.82 34 N44° 17.324 E9° 10.066 N44° 16.394 E9° 8.406 27,518 58,548 86,066 105.50
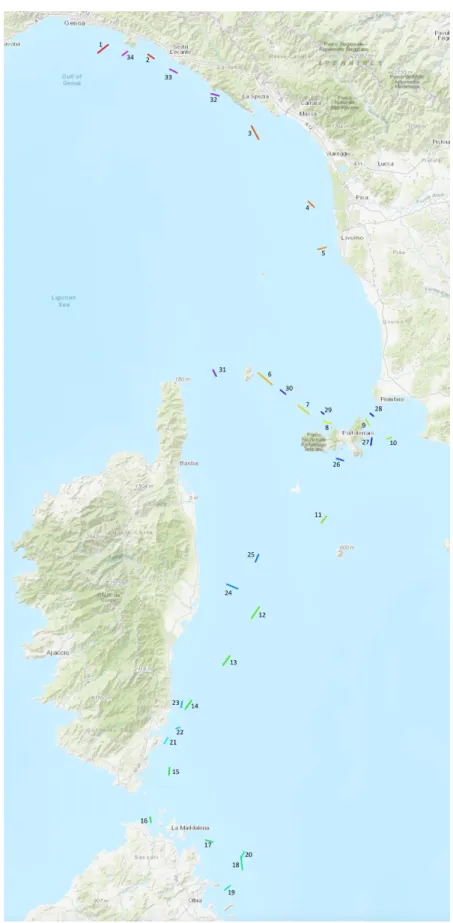
Figure SI1: A map of the sample locations with their numeric label. Labels were assigned based upon the
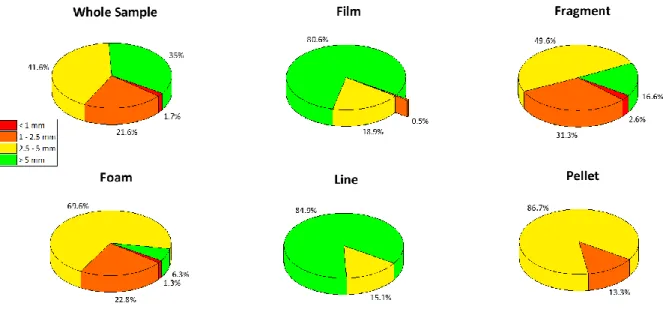
Figure SI2: Ratios for the particle sizes present within each shape category. The color legend used for all