1
Preparation and Characterization of Functional
Silica Hybrid Magnetic Nanoparticles
Reinaldo G. Digigow†,§, Jean-François Dechézelles†, Hervé Dietsch†, Isabelle Geissbühler§, Dimitri Vanhecke†, Christoph Geers†, Ann M. Hirt‡, Barbara Rothen-Rutishauser†, and Alke
Petri-Fink†,§*
†
Adolphe Merkle Institute, University of Fribourg, Route de l'Ancienne Papeterie CP 209, CH-1723 Marly, Switzerland
§
Chemistry Department, University of Fribourg, Chemin du Musée 9, CH-1700 Fribourg, Switzerland
‡
Institute for Geophysics, ETH Zurich, Sonneggstrasse 5, CH-8092 Zurich, Switzerland
Supporting Information
Amine quantification by Hermanson method
For the preparation of the TNBSA 0.01% solution, 20 µL of TNBSA 5% reagent were diluted in 10 mL of sodium bicarbonate buffer (pH = 8.5). All other solutions were prepared in Milli-Q water and the pH was adjusted by adding either dilute sodium hydroxide aqueous solution or HCl.
2 The glycine standard stock solution (A) (10 mg/mL) was prepared by adding 1 g of glycine in 100 mL sodium bicarbonate buffer, pH = 8.5. This stock solution was diluted by pipetting 200 µL in 10 mL of bicarbonate buffer (pH = 8.5).
6 standards were prepared from this stock solution (B) (200 µg/mL) with the following concentrations of 0, 2, 8, 10, 15 and 20 µg/mL. Therefore, 0, 100, 400, 500, 750 and 1000 µL respectively were diluted in 10 mL bicarbonate buffer (pH = 8.5).
0.5 mL of TNBSA 0.01% solution was mixed with 1 mL of each standard (0, 2, 8, 10, 15 and 20 µg/mL) in 5 mL vials and the solutions were incubated at 37°C for 2 hours. Samples were treated accordingly.
After the incubation time 0.5 mL of sodium dodecyl sulfate (SDS) 10% solution and 0.25 mL HCL 1M solution was added to each vial and carefully mixed for 10 minutes. Absorbance was measured at 335 nm using a quartz cuvette on a Jasco V-670 Spectrophotometer.
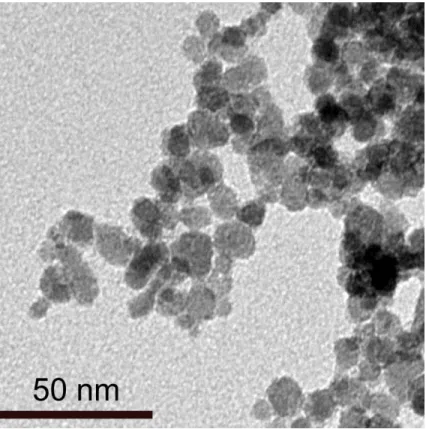
3 Figure SI-1: TEM picture of naked SPIONs (scale bar 50 nm)
Figure SI-2: Flocculation of SHMNPs in water - samples D, F, and H (0 wt% APTES) and samples C, E, and G (25 wt% APTES)
4 -750000 -500000 -250000 0 250000 500000 750000 -60 -40 -20 0 20 40 60
Magnetic Field (A/m)
M a g ne ti za ti on ( A. m 2 /kg ) SPIONs
Figure SI-3: Magnetization curve (M-H) of the bare, i.e. uncoated SPIONs synthesized by chemical coprecipitation method.