HAL Id: hal-00301696
https://hal.archives-ouvertes.fr/hal-00301696
Submitted on 15 Aug 2005HAL is a multi-disciplinary open access
archive for the deposit and dissemination of sci-entific research documents, whether they are pub-lished or not. The documents may come from teaching and research institutions in France or abroad, or from public or private research centers.
L’archive ouverte pluridisciplinaire HAL, est destinée au dépôt et à la diffusion de documents scientifiques de niveau recherche, publiés ou non, émanant des établissements d’enseignement et de recherche français ou étrangers, des laboratoires publics ou privés.
Can we explain the trends in European ozone levels?
J. E. Jonson, D. Simpson, H. Fagerli, S. Solberg
To cite this version:
J. E. Jonson, D. Simpson, H. Fagerli, S. Solberg. Can we explain the trends in European ozone levels?. Atmospheric Chemistry and Physics Discussions, European Geosciences Union, 2005, 5 (4), pp.5957-5985. �hal-00301696�
ACPD
5, 5957–5985, 2005 European ozone trends J. E. Jonson et al. Title Page Abstract Introduction Conclusions References Tables Figures J I J I Back CloseFull Screen / Esc
Print Version Interactive Discussion
EGU Atmos. Chem. Phys. Discuss., 5, 5957–5985, 2005
www.atmos-chem-phys.org/acpd/5/5957/ SRef-ID: 1680-7375/acpd/2005-5-5957 European Geosciences Union
Atmospheric Chemistry and Physics Discussions
Can we explain the trends in European
ozone levels?
J. E. Jonson1, D. Simpson1, H. Fagerli1, and S. Solberg2
1
Norwegian Meteorological Institute, Oslo, Norway
2
Norwegian Institute for Air Research (NILU), Kjeller, Norway
Received: 27 June 2005 – Accepted: 20 July 2005 – Published: 15 August 2005 Correspondence to: J. E. Jonson ([email protected])
ACPD
5, 5957–5985, 2005 European ozone trends J. E. Jonson et al. Title Page Abstract Introduction Conclusions References Tables Figures J I J I Back CloseFull Screen / Esc
Print Version Interactive Discussion
EGU
Abstract
Ozone levels in Europe are changing. Emissions of ozone precursors from Europe (NOx, CO and non-methane hydrocarbons) have been substantially reduced over the last 10–15 years, but changes in ozone levels can not be explained by changes in European emissions alone.
5
In order to explain the European trends in ozone since 1990 the EMEP regional pho-tochemistry model has been run for the the years 1990 and 1995–2002. The EMEP model is a regional model centered over Europe but the model domain also includes most of the North Atlantic and the polar region. Climatological ozone data are used as initial and lateral boundary concentrations. Model results are compared to
mea-10
surements over this timespan of 12 years. Possible causes for the measured trends in European surface ozone have been investigated using model sensitivity runs per-turbing emissions and lateral boundary concentrations. The observed ozone trends at many European sites are only partially reproduced by global or regional photochem-istry models, and possible reasons for this are discussed. The increase in winter ozone
15
partially and the decrease in the magnitude of high ozone episodes is attributed to the decrease in ozone precursor emissions since 1990 by the model. Furthermore, the model calculations indicate that the emission reductions has resulted in a marked de-crease in summer ozone in major parts of Europe, and in particular in Germany. Such a trend in summer ozone is likely to be difficult to identify from the measurements
be-20
cause of large inter-annual variability.
1. Introduction
Both on a global/hemispheric scale and regional/local scale the potential to produce ozone has changed significantly after the onset of industrialization. Both models and measurements agree that ozone levels have increased significantly over this period.
25
ACPD
5, 5957–5985, 2005 European ozone trends J. E. Jonson et al. Title Page Abstract Introduction Conclusions References Tables Figures J I J I Back CloseFull Screen / Esc
Print Version Interactive Discussion
EGU are less clear. Since the late 1980s the emissions of ozone precursors, NOx, CO and
NMVOC (non-methane volatile organic compounds) have been substantially reduced in most parts of Europe (Vestreng et al.,2004). The reduction in the emissions has re-sulted in corresponding reductions in the measured concentrations of these precursor species (Derwent et al.,2003;Solberg,2004). The anticipated effect of these
reduc-5
tions are that ozone levels in the summer months would also be reduced, and that environmentally set thresholds for ozone would be less frequently violated. Reliable surface ozone measurements are available since the late 1980s at a number of sites. However, there are large inter-annual variations in ozone levels making it difficult to identify significant trends over the same period. Further, at many ozone sites sampling
10
background and/or free tropospheric air, measured ozone has increased at all sea-sons, but in particular in winter and spring. The origin, or even extent, of this increase in European background ozone is unclear as will be discussed below.
This paper discusses a number of factors which affect near-surface ozone levels over Europe, and attempts to quantify how far we can account for the observed trends in
15
terms of European emission reductions.
2. Factors affecting European tropospheric ozone trends
Although not independent of each other, ozone concentrations may be viewed as the sum of a global/hemispheric background concentration and regionally/locally produced ozone. Most of the ozone is believed to originate from the troposphere itself, but a
20
significant fraction is also advected from the stratosphere.
The anthropogenic emissions of ozone precursors (predominantly surface sources) have changed over the last 1–2 decades. In Europe considerable reductions in emis-sions are made since the late 1980s. In Table1emissions in the EU countries are listed for the years 1990 and 2002. In addition Germany is listed separately as the reductions
25
here are particularly large, as well as N. America (USA and Canada) being directly up-wind from Europe. In North America there is a downward trend of about 15–20% for
ACPD
5, 5957–5985, 2005 European ozone trends J. E. Jonson et al. Title Page Abstract Introduction Conclusions References Tables Figures J I J I Back CloseFull Screen / Esc
Print Version Interactive Discussion
EGU the emissions of NMVOC and NOx and a slight increase in the emissions of CO over
the same period (UNECE, 2004). Emissions are however increasing rapidly in parts of Asia (Streets et al.,2003). There is also a marked upward trend in the emissions from international shipping.Endresen et al.(2003) reports a 1.6%/year increase in fuel consumption from shipping between 1996 and 2000.
5
The emission sources of ozone precursors are predominantly located in the bound-ary layer. The lifetime of ozone in the boundbound-ary layer is of the order of days as opposed to the free troposphere where the lifetime is of the order of one month or more. It there-fore seems reasonable to assume that in order to have hemispheric or global effects, ozone (or ozone precursors) must be lifted into the free troposphere.
10
One may speculate to what extent recent changes in the stratospheric ozone layer may have resulted in a reduction in the intrusion of ozone to the troposphere. According toFusco and Logan (2003) the stratospheric flux of ozone into the troposphere may have decreased by as much as 30% in recent years as a result of large declines of lower stratospheric ozone. These changes should be much larger in the southern
15
hemisphere as a result of a more pronounced decline in the ozone layer here. However, as a result of global change and changes in stratospheric ozone in particular, circulation patterns may have been altered affecting the exchange between the stratosphere and troposphere. Measured ozone at mountain tops in Europe are increasing.Kanter et al. (2004) report a pronounced rise in7Be since the mid-1970’s. They argue that this is
20
an indication, but not a proof, of an increase in the input from the stratosphere.
At least on a regional scale ozone may also be affected by changes in the circulation in the troposphere. There are substantial inter-annual variations in tropospheric ozone. Creilson et al.(2003) found a good correlation between the NAO (North Atlantic Oscil-lation) index and the tropospheric ozone column in the eastern Atlantic in spring, but
25
ACPD
5, 5957–5985, 2005 European ozone trends J. E. Jonson et al. Title Page Abstract Introduction Conclusions References Tables Figures J I J I Back CloseFull Screen / Esc
Print Version Interactive Discussion
EGU
3. Trends in measured ozone precursor levels
The EMEP assessment study showed that the reported emission changes as dis-cussed in the previous section have indeed been accompanied by downward trends in the atmospheric concentrations of these species (Løvblad et al.,2004) although there are many gaps in the data. For NO2 the largest reductions in ambient concentrations
5
at rural EMEP sites have been reported in Eastern and Central parts of Europe (Ger-many, Czech Republic) with reductions of the order of 50% between 1990 and 2000. Around 30% reduction in NO2 is reported for the same period in the Nordic countries, Italy, Netherlands and Switzerland (Løvblad et al.,2004). It should be noted, however, that the number of regional sites with a sufficient monitoring history, and consistent set
10
of measurement data, is rather low.
For NMVOC there is an even lower number of regionally representative monitoring sites, and the data are mostly scattered in time. The data do, however, show clear indications of reduced concentration levels of NMVOCs during the 1990s (Solberg, 2004). Continuous NMVOC monitoring data from urban background sites in the UK
15
have shown a decrease of the order of −4.5% yr−1 and −12% yr−1 for the various indi-vidual species during 1994–2000 (Derwent et al.,2003). Thijsse et al.(1999) showed that there was a shift in the NMVOC composition at Dutch sites during 1990–1997 with less aromatic compounds compared to the aliphatic, and they related this to the stronger emission reduction of aromatics by the cars’ three-way catalysts. Based on
20
NMVOC measurements at the EMEP monitoring site Moerdijk back to the early 1980s Roemer(2001) showed an excellent agreement between observed ethene and acety-lene (tracers of car exhaust) and the official Dutch EMEP road traffic emissions with an estimated reduction of the order of 50% from 1981 to 1999. Urban studies, e.g. in Denmark (Palmgren et al.,2001), have indicated a particular strong decline in the
at-25
mospheric benzene concentration due to the reduced benzene content of petrol fuel introduced in the 1990s.
ACPD
5, 5957–5985, 2005 European ozone trends J. E. Jonson et al. Title Page Abstract Introduction Conclusions References Tables Figures J I J I Back CloseFull Screen / Esc
Print Version Interactive Discussion
EGU
4. Trends in measured ozone levels in the troposphere
Trends and seasonal cycles at sites affected by European emissions and at background sites will differ. In the overview below we therefore discuss trends at sites less affected by European emissions and central European sites affected by European emissions most of the time, separately. Trends in ozone are hard to detect because of large
inter-5
annual variations and for this reason long timeseries are needed. The measurements must be carefully checked for discontinuities and drifts in the data as discussed by Roemer(2001). Such screening of the data can be made by visual inspection, statis-tical methods (Schuepbach et al.,2001) or by pairing of neighbouring sites (Roemer, 2001). Ozone trends are expected to be different in the summer and winter seasons.
10
It is therefore unfortunate that most trend studies analyze the measurements with re-gards to annual mean concentrations.
4.1. Measured Global/Hemispheric trends
Measurements from the early stages of industrialization indicate that ozone levels at that time may have been around 10 ppbv (Volz and Kley, 1988; Pavelin et al.,1999)
15
Studies of ozone-sonde data in the free troposphere (Logan,1994;Logan et al.,1999; Oltmans et al.,1998) points to a general increase in free tropospheric ozone up to the mid 1980s and a mixed picture with many sites/regions showing no significant trend or even negative trends after that. InWMO(2002) trends have been calculated including 4 more years (1996–2000). The addition of 4 years of data does not alter these
conclu-20
sions significantly. Naja et al. (2003) studied ozone trends at Hohenpeissenberg and Payern and found no positive trends for background ozone in the free troposphere.
Studying trends in the last decade at different altitudes in Switzerland,Ord ´o ˜nez et al. (2004) found a statistically significant trend of 0.2–0.7 ppb /year at elevated sites from autumn to spring, at a time when these stations are predominantly measuring free
tro-25
pospheric air. One of the sites (Jungfraujoch, 3580 m asl) is located close to the ozone sonde station Payern where there is no significant trend reported at this height (Naja
ACPD
5, 5957–5985, 2005 European ozone trends J. E. Jonson et al. Title Page Abstract Introduction Conclusions References Tables Figures J I J I Back CloseFull Screen / Esc
Print Version Interactive Discussion
EGU et al., 2003). Also at Zugspitze, 2962 m asl, there is a positive ozone trend between
1990 and 2001 (Kanter et al.,2004), whereas at the nearby, but about 1000 m lower in altitude, site Wank there is no significant trend.
In the MOZAIC project (http://www.aero.obs-mip.fr/mozaic/) tropospheric ozone has been measured on a routine basis on commercial aircraft since 1994. Preliminary
stud-5
ies indicate a trend in recent years of about 1.7%/year in the upper free troposphere (Thouret et al., 2004). However, this is mostly caused by a high anomaly in 1998– 1999 of about 10%. It is unclear as to what extent the trend reported at elevated sites are affected by the same anomaly. Over western Europe and the eastern Atlantic the high ozone levels in the free troposphere are correlated with the NAO index in the late
10
1990’s as noted in Sect.2.
Analysis of the clean sector at surface sites measuring relatively unpolluted air-masses (British Isles, Scandinavia) show that there has been an increase in back-ground ozone levels also after the mid-1980s (Solberg,2003; Roemer, 2001) for all seasons, although the increase is strongest in winter. Simmonds et al. (2004) found
15
that background ozone in the clean oceanic sector measured at Mace Head Ireland has increased by about 8 ppb from 1987 to 2003.
The difference in trends for ozone sondes and other measurements, and in particu-lar mountain sites often in the free troposphere, are not easily reconciled and will be discussed in Sect.6.
20
4.2. Measured ozone trends in Europe
Ozone trend analysis of the measurements are mainly restricted to northern and west-ern parts of Europe where routine measurement of ozone first started and timeseries are long enough to perform meaningful studies. Overviews of reported trends are given in several publications, i.e.Roemer(2001);TOR-2(2003);Monks et al.(2003);Solberg
25
et al. (2004). Apart from sites at the western coast of Europe, measuring background ozone, trends in surface ozone does not show a uniform picture. However, most sites show substantial downward trends of high ozone (98 or 95 percentiles) over the past
ACPD
5, 5957–5985, 2005 European ozone trends J. E. Jonson et al. Title Page Abstract Introduction Conclusions References Tables Figures J I J I Back CloseFull Screen / Esc
Print Version Interactive Discussion
EGU 10 to 15 years. As an example peak ozone concentrations have decreased by about
30% in the UK. At the same time a slight increase in annual annual average ozone is observed (NEGTAP,2001). According toBeilke and Wilson(2000), studying the trend at more than 300 ozone sites in Germany between 1990 and 2000, the 99 percentile dropped by 3.3 µg per year, but with no significant trend for the ozone indicator AOT40
5
(see, e.g.Fuhrer et al.,1997, for definition of AOT40).
Furthermore, at most polluted sites the low ozone percentiles (mainly winter) are increasing. An important contribution to this upward trend is a reduction in the titration by O3+NO reaction in response to the reduction in NOxemissions.
Trends in tropospheric ozone are closely linked to the seasonal cycle of ozone. Clean
10
unpolluted sites have a spring ozone maximum, whereas polluted (continental) sites are characterized by a broad summer maximum. The relationship between trends, seasonal cycles and what is denoted as controllable ozone, are extensively covered in Monks et al.(2003).
5. Calculated trends
15
Models point to a close connection between the increase in ozone precursors and in tropospheric ozone on a hemispheric or even global scale. Model calculations indicate that there has been a substantial increase in ozone in the tropospheric ozone since pre-industrial times (Berntsen et al., 1997; Lelieveld and Dentener,2000;Karlsdottir et al.,2000; Hauglustaine and Brasseur, 2003), and that the increase in global free
20
tropospheric ozone has contributed to the increase in surface ozone also in Europe. Fusco and Logan(2003) calculated an increase in tropospheric ozone between 1970 and 1994. In these calculations ozone levels in the free troposphere continued to increase from 1985 to 1994 as a result of increasing emissions worldwide. In addition to future projections, Dentener et al. (2004), in a transient global model calculation,
25
compared measured and modeled ozone for 6 surface sites, of which 3 (Westerland, Brotjacklriegel and Schauinsland), are in Europe. None of the sites showed significant
ACPD
5, 5957–5985, 2005 European ozone trends J. E. Jonson et al. Title Page Abstract Introduction Conclusions References Tables Figures J I J I Back CloseFull Screen / Esc
Print Version Interactive Discussion
EGU measured or calculated trends. The three European sites selected are located at some
distance from the coast, and calculated and measured trends should be influenced by a combination of background and regional ozone. Among the global model calculations reported above there is thus a considerable spread in the calculated trend for ozone.
Substantial reductions in modeled peak ozone levels was found comparing results
5
from ten dispersion models in response to emission changes during the 1990s (Roe-mer et al., 2003). A positive trend in winter ozone, mostly in the 2–4 ppb range in central Europe, was also seen in the model results. This is in good agreement with measurements as noted in Sect.4.2. Following the decrease in the emissions of ozone precursors, model calculated mean ozone also decreased in summer with about 10%,
10
but with a substantial variability between models. This decrease is not confirmed by the analysis of the measurements. Similar model results where also obtained as part of the EU project TROTREP (Monks et al.,2003). Here particularly large reductions in mean summer ozone were calculated for Eastern Europe. In this region there are insufficient measurement data available to verify the model results. InSolberg et al.
15
(2005) it was shown that the changes in the European emissions of ozone precursors in the 1990s has led to significant reductions in Nordic surface ozone episodes.
Several studies have tried to quantify the contributions to the ozone levels from dif-ferent continents or source regions. By separately shutting off sources in N. America, Europe and Asia,Li et al.(2002) calculated the contribution from these regions to
sur-20
face ozone. For the summer months (June, July, August) the calculated contribution from N. America to western parts of Europe was of the order of 2–3 ppb, whereas the contribution from Asia was of the order of 1 ppb. Derwent et al. (2004) studied the effects of inter-continental transport on ozone by a labeling technique and by reducing the anthropogenic emissions in N. America, Europe and Asia of NOx and CO by 50%
25
on an annual basis. The labelling technique indicated a much larger contribution of more than 8 ppb from N. America and 4.5 ppb from Asia. The effect of inter-continental transport is expected to be relatively smaller in summer. The annual contribution should therefore be larger than just the summer season as studied byLi et al.(2002). Because
ACPD
5, 5957–5985, 2005 European ozone trends J. E. Jonson et al. Title Page Abstract Introduction Conclusions References Tables Figures J I J I Back CloseFull Screen / Esc
Print Version Interactive Discussion
EGU of non-linearities in the ozone chemistry the tracer labeling technique gives a higher
estimate for the inter-continental contribution. The corresponding results from a 50% reduction in NOx and CO emissions were much smaller, and taking into account that emission reductions in this study are smaller, similar to the effects calculated byLi et al. (2002).
5
5.1. Description of the EMEP model
The EMEP Eulerian Photochemistry model has a polar stereographic projection with a horizontal resolution of 50×50 km2 true at 60◦N and 20 vertical layers below 100 hPa. The model domain is centered over Europe and also includes most of the North Atlantic and the polar region. The EMEP model uses 3-hourly resolution meteorological input
10
data from a dedicated version of the HIRLAM model. The emission data have been retrieved from the EMEP database (Vestreng et al.,2004). Emissions are distributed temporarily and vertically depending on source category. A thorough description of the model is included inSimpson et al.(2003), with updates reported inFagerli et al. (2004), so only a very brief summary is given here. Descriptions and applications of
15
earlier versions of the model can be found inJonson et al.(2000a,2001).
Initial and lateral boundary conditions (BCs), especially of ozone, represent key in-puts to the EMEP model. For ozone, these boundary conditions are derived from the 3-D ozone climatology from Logan (1999), modified in order to accommodate inter-annual variabilities in air masses arriving from the upwind Atlantic region. The
modifi-20
cations are based on the measurements at Mace Head, Ireland (Simpson et al.,2003), filtered to obtain clean-air O3values. The adjustment (in ppb ozone) in lateral boundary concentrations is the same for the whole model domain and at all vertical levels. As ozone generally increase with altitude, the relative adjustment is largest near the sur-face and small in the upper free troposphere as the ozone mixing ratio is higher here
25
than in the lower troposphere. The lower relative correction in the upper and middle tro-posphere was chosen as the marked trend is not evident from free tropospheric ozone sonde measurements (see Sect.4.1). The motivation for and effects of the Mace Head
ACPD
5, 5957–5985, 2005 European ozone trends J. E. Jonson et al. Title Page Abstract Introduction Conclusions References Tables Figures J I J I Back CloseFull Screen / Esc
Print Version Interactive Discussion
EGU correction will be discussed in more detail in a separate paper, Simpson et al. (2005)1
In this paper two sets of O3BC data have been used:
– Ref: The Mace Head correction for ozone has been applied individually on a
monthly basis for all years.
– AvgBC: Consists of a “10-year” climatology based upon the average of the annual
5
data-sets over the period 1990–2000.
The Ref case corresponds to normal EMEP model usage and represents our best estimate of BCs. The AvgBC case is sued to explore what happens when interannual variability and trends are ignored.
Lateral boundary concentrations for other species are specified, mostly based on
10
measurements as described inSimpson et al.(2003)
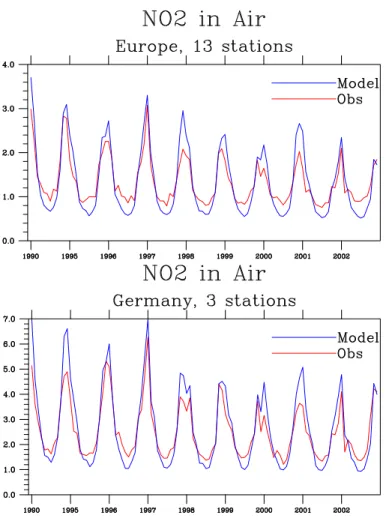
5.2. Calculated NO2in the European boundary layer, 1990 to 2002
In winter calculated reductions in NO2are of the order of 30% or more in central and Eastern Europe, but reductions are smaller in summer. In the Iberian peninsula and countries bordering the Mediterranean calculated changes are small. Figure1depicts
15
measured and calculated NO2levels for 13 sites (left) and 3 German sites (right) mea-suring NO2for all relevant years. There is a clear bias towards Northwest Europe in the location of the sites. The measured levels, as well as the trend, for NO2are reasonably well reproduced by the model. Observed wintertime NO2 seems to have decreased by 1–2 µg Nm−3over the European and German stations from 1990 to 2000, although
20
interannual variation makes a clear determination difficult. Summertime trends are somewhat smaller, and in some areas even absent both for measured and calculated NO2. This is probably because reductions in traffic emissions, with constant emissions
1
Simpson, D., Fagerli, H., Jonson, J. E., and Simmonds, P. A.: Simple but effective proce-dure to improve boundary conditions for European regional models, in preparation, 2005.
ACPD
5, 5957–5985, 2005 European ozone trends J. E. Jonson et al. Title Page Abstract Introduction Conclusions References Tables Figures J I J I Back CloseFull Screen / Esc
Print Version Interactive Discussion
EGU throughout the year, are smaller than the total reductions in NOx emissions. Overall
the decrease in NO2 levels is consistent with the emission reductions summarized in Table1. This is in good agreement with other studies as reported in Sect.3.
5.3. Calculated ozone over Europe for the years 1990 to 2002
In large parts of Europe the emissions of ozone precursors peaked in the late 1980s.
5
Reliable measurements for trend studies are available from about the same time. Model calculations with the EMEP photochemistry model have been made for 1990 (for this year a substantial number of reliable measurement sites are already in opera-tion) and for the years 1995 to 2002. The Mace Head adjustment discussed above is applied in the calculations. Emissions for the relevant years are from Vestreng (2004).
10
As already noted in Sect.4the interpretation of measured trends are not straight for-ward. To avoid some of the problems related to the individual sites we mostly base our conclusions from the model to measurement comparisons on ensembles of sites. In Fig.2calculated and measured monthly averaged daily maximum ozone are compared for all EMEP sites with continuous measurements for these years (top left). Likewise
15
for the corresponding German sites (top right). Below, in the same figure, measured and calculated ozone at Mace Head (IE31) and Deuselbach (DE04) are compared. The inter-annual variability of ozone from the measurements is well reproduced by the model with no apparent drift in the model bias over the years. The figure containing all sites with continuous measurements for all the years seems to confirm the conclusions
20
from the trend studies already discussed in Sect.4.2, with ozone levels increasing in winter and no clear trend in mean ozone for other seasons. Calculated trends and measured trends for different seasons and regions are discussed in more detail below. 5.4. Sensitivity tests
To explain the mechanisms behind the trends in European ozone levels two sensitivity
25
ACPD
5, 5957–5985, 2005 European ozone trends J. E. Jonson et al. Title Page Abstract Introduction Conclusions References Tables Figures J I J I Back CloseFull Screen / Esc
Print Version Interactive Discussion
EGU model run is repeated with emissions representative of year 1990. In the second
sensi-tivity test the 10-year average lateral boundary concentrations (AvgBC, see Sect.5.1) was used. The AvgBCs where chosen in favour of 1990 BCs as this is more robust than BCs from a single year.
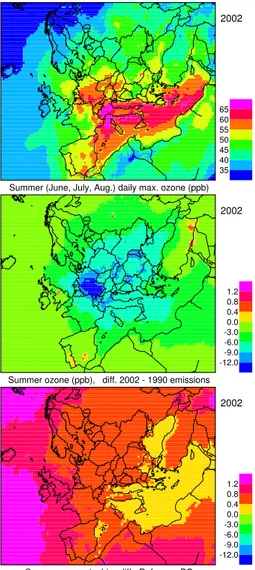
In Fig.3top, mean summer daily maximum ozone is shown for the base-case (Ref)
5
simulation, year 2002. High ozone levels are in particular seen in the Mediterranean ocean and in northern Italy. Relatively high summer ozone is also seen in southern parts of Germany and neighbouring countries. The resulting effects of the sensitivity tests on ozone are discussed below.
5.4.1. 1990 emissions: Effects on summer ozone
10
Figure 3 middle shows the difference in ozone levels obtained when using present (year 2002) emissions compared to when using 1990 emissions for the same meteo-rological year (2002). Throughout major parts of Europe calculated ozone reductions are in the 5–10 ppb range. Over Turkey and the Iberian peninsula emissions of ozone precursors have increased, resulting in small changes or a slight increase in calculated
15
ozone here. In southern Germany reductions in calculated ozone of more than 12 ppb are seen. The reductions reflect the substantial reductions in the emissions of ozone precursors in most of Europe, and in particular in Germany, in the same period. The reductions in summer ozone over Germany can also be seen for both measured and calculated ozone for 6 German sites, Fig.2 bottom left, and for Deuselbach (DE04),
20
Fig. 2 bottom right, in particular. At the German sites there is a large variability in summer ozone levels, but with less variability after 1998.
Calculated reductions in summer ozone as shown in Fig.3 middle are not seen in the measurements (and model calculations) for the ensemble of sites in Fig.2top left. The reductions may be masked by inter-annual variability. Furthermore there is a bias
25
in the available measurements to sites affected by changes in background ozone and less by central European emission reductions.
ACPD
5, 5957–5985, 2005 European ozone trends J. E. Jonson et al. Title Page Abstract Introduction Conclusions References Tables Figures J I J I Back CloseFull Screen / Esc
Print Version Interactive Discussion
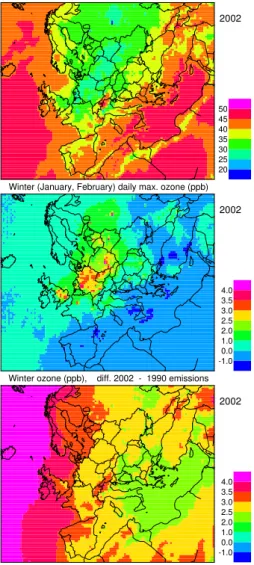
EGU 5.4.2. 1990 emissions: Effects on winter ozone
In winter ozone levels are low over the European continent (Fig.4, top), largely as a result of the titration reaction NO+O3⇒ NO2. According to the model calculations, the decrease in NOx (along with other ozone precursors) emissions over the last 10–15 years should have resulted in an increase in ozone levels of the order of 2 ppb or more
5
in most parts of central Europe, as depicted in Fig.4middle. Over the Mediterranean sea the insolation is quite strong even in winter, allowing some photochemistry, and resulting in a small decrease in ozone levels. Over the Iberian peninsula and Turkey emissions of ozone precursors have increased since 1990 partially resulting in different trends than neighbouring regions here. The increase in winter ozone in central Europe
10
is also seen for both measured and calculated ozone at the sites shown in Fig.2. This is also in agreement with investigations of measured trends as discussed in Sect.4.2. 5.4.3. 1990 emissions: Effects on high ozone events
The highest ozone events, here defined as the 7 highest ozone days in the year are shown in Fig.5, top. High ozone events are in particular seen in the model calculations
15
in and around the European countries with a Mediterranean coastline, in the countries around the English channel and in parts of Germany. High ozone events are also apparent in the Moscow area. As a result of emission changes from 1990 to 2002 the calculated magnitude of the highest ozone events have been reduced by 10 ppb or more in large parts of Europe (Fig.5, bottom). In parts of west and central Europe
20
the magnitude has been reduced by as much as 25 ppb. As discussed in Sect.4.2, changes of this order of magnitude are consistent with measurements.
5.4.4. Importance of boundary conditions
As discussed in Sect.5.1, the standard boundary conditions (BCs) for the EMEP model consist of the 3-D dataset ofLogan (1999), modified by a correction procedure based
ACPD
5, 5957–5985, 2005 European ozone trends J. E. Jonson et al. Title Page Abstract Introduction Conclusions References Tables Figures J I J I Back CloseFull Screen / Esc
Print Version Interactive Discussion
EGU upon monthly O3 measured at Mace Head in Ireland. The Mace Head correction is
a measure of trends and inter-annual variability in background ozone. In addition to the model runs with these standard (Ref) monthly boundary conditions for each year, model runs have also been made with the 10-year average of monthly BCs (run AvgBC, see Sect.5.1). For 2002 the correction is markedly higher than the 10 years average.
5
Differences between model runs with standard (Ref) and 10-year boundary condi-tions (AvgBC) are depicted calculated with year 2002 meteorology in Fig. 3(bottom) for the summer months (June, July, August), and in Fig.4(bottom) for the winter months (January, February). The difference between the standard and 10-year average BCs are mostly in the 0.5 to 1 ppb range. Calculated effects are however more pronounced
10
in winter, with ozone levels increasing with 2–3 ppb throughout much of the European continent as a result of higher ozone levels at the lateral boundaries in 2002 compared to the 10 years average. Over the British isles, Scandinavia, and mountainous re-gions as the Alps and Pyrenees (with a strong influence from the free troposphere) the increase is even stronger.
15
5.4.5. Summary of Sensitivity tests
The calculations made above with 1990 versus 2002 emissions or 10-year average BCs versus annually corrected BCs illustrate that both European emissions and BCs have likely contributed significantly to the ozone trend over Europe. Whereas the calcu-lated changes in ozone resulting from emission changes are representative for the 12
20
years from 1990 to 2002, this is not the case for the increase in BCs. Lateral boundary concentrations used in the AvgBC scenario represent concentrations in the middle of the 12 year period considered. In order to compare the effects of emission changes and changes in BCs the latter effect should be multiplied by two.
In summertime the direction of the changes is in general opposite, with the emissions
25
reduction reducing ozone levels in most areas, whereas the increasing levels of BCs leads to higher ozone levels.
ACPD
5, 5957–5985, 2005 European ozone trends J. E. Jonson et al. Title Page Abstract Introduction Conclusions References Tables Figures J I J I Back CloseFull Screen / Esc
Print Version Interactive Discussion
EGU increase in BCs.
6. Do we understand the trends?
The sensitivity tests discussed above, as well as observations, show that ozone is clearly affected by changes in European emissions (mostly reductions) of ozone pre-cursors. The observed increase in winter ozone can partially be explained by the
5
reduction in emissions and partially by a probable increase in background ozone. The trend in the summer months are less clear. Following the reductions in the emissions of ozone precursors there is a marked downward trend in calculated sum-mer ozone in central Europe, and in southern Germany in particular as indicated in the comparison with measurements for the German sites. Such reductions are however
10
so far not shown by analysis of the measurements. An analysis focusing on mea-sured ozone in the summer months may confirm this trend. In a model experiment reducing the anthropogenic emissions stepwise in Europe (Monks et al.,2003) it was demonstrated that the largest effects on mean ozone was seen when removing the last 20% of the ozone precursor emissions. Thus reductions in surface ozone caused by
15
more moderate reductions in ozone precursors could easily be masked by inter-annual variability and/or a trend in background ozone.
Many of the sites with long timeseries suitable for trend studies are located in north-ern and westnorth-ern parts of Europe where the calculated effects of the emission changes are small. At the same time these areas are the ones most affected by an increase in
20
background ozone. The calculated effects of the Mace Head adjustment as described in Sect.5.4.4 would have been larger if the correction had been made with 1990 data rather than a 10 years average.
The origin of the marked trend in background ozone discussed above is unclear. Emissions of ozone precursors over Europe and North America have leveled off or
de-25
creased over the last 1–2 decades. Over the same period emissions in east Asia have increased substantially. Here ozone and ozone precursors have a greater chance of
ACPD
5, 5957–5985, 2005 European ozone trends J. E. Jonson et al. Title Page Abstract Introduction Conclusions References Tables Figures J I J I Back CloseFull Screen / Esc
Print Version Interactive Discussion
EGU being lifted into the free troposphere by convection compared to other polluted
conti-nents and thereby contribute to an increasing trend in the free troposphere throughout the northern mid latitudes. However, as discussed in Sect.5, model studies indicate that this increase can only explain a small part of the observed increase in background ozone.
5
The increase in free tropospheric ozone as seen at Mace Head, mountain sites and the MOZAIC data are however in direct conflict with the trends derived from the ozone sonde measurements, where no significant trends are recorded over the last 1–2 decades. The trend in the MOZAIC data may however have been affected by a high anomaly in 1998 and 1999. According to Ord ´o ˜nez (personal communication) the
10
inconsistency in the trends for sondes versus other measurements may be related to the low sensitivity and very low time resolution of these ozonesonde measurements. There may also have been a change in the meteorological limitations as to when to make soundings.
As already noted emissions from international shipping has been increasing at an
15
annual rate of about 1.6% in recent years. International shipping has been shown to result in a calculated perturbation of more than 10 ppb in the North Atlantic in the summer (Jonson et al.,2000b;Endresen et al.,2003) with the largest perturbation in the mid Atlantic where NOxlevels are in general low. Calculated effects of international shipping over the European continent is small (Jonson et al., 2000b). This effect is
20
however likely to be an overestimate (Davis et al., 2001; von Glasow et al., 2003). Thus the trend for this source can not explain the increase in surface ozone in the clean oceanic sites as Mace Head, and certainly not the increase at mountain tops, in the free troposphere, in winter.
Boreal fires in Siberia and north America may have a marked effect on ozone.
Hon-25
rath et al. (2004) measured ozone and CO at Mt. Pico on the Azores. Ozone levels elevated by 15 ppb or more could often be attributed to boreal fires in this period. Re-cently it has been shown that also at Mace Head there is a strong correlation between surface ozone (and other greenhouse gases) and large-scale biomass burning events
ACPD
5, 5957–5985, 2005 European ozone trends J. E. Jonson et al. Title Page Abstract Introduction Conclusions References Tables Figures J I J I Back CloseFull Screen / Esc
Print Version Interactive Discussion
EGU (Simmonds et al., 2005). And, as pointed out by the same authors, Canadian fires
have increased steadily over the past two decades according toStocks et al.(2003). As pointed out in Sect. 2 circulation patterns may have changed, altering the ex-change across the tropopause and also the circulation within the troposphere itself. Such changes may have been brought about by global change.
5
As it stands now the magnitude and origin of the ozone trends in Europe are not completely understood.
Acknowledgements. The authors thank S. Dalsøren, University of Oslo, for valuable
discus-sions on ozone trends. This work was supported by the Co-operative Programme for Monitor-ing and Evaluation of the Long-range Transmission of Air pollutants in Europe (EMEP) under
10
UNECE.
References
Beilke, S. and Wilson, R. R.: The ozone concentration in Germany since 1990 and prognoses for the future development (in German), Tech. rep., Immissionsschutz, 5, 2000. 5964
Berntsen, T. K., Isaksen, I. S. A., Myhre, G., Fuglestvedt, J. S., Stordal, F., Larsen, T. A.,
15
Freckleton, R. S., and Shine, K.: Effects of anthropogenic emissions on tropospheric ozone and its radiative forcing, J. Geophys. Res., 102, 28 101–28 126, 1997. 5964
Creilson, J., Fishman, J., and Wozniak, A.: Intercontinental transport of tropospheric ozone: a study of its seasonal variability across the North Atlantic utilizing tropospheric ozone residu-als and its relationship to the North Atlantic Ocillation, Atmos. Chem. Phys., 3, 2053–2066,
20
2003,
SRef-ID: 1680-7324/acp/2003-3-2053. 5960
Davis, D., Grodzinski, G., Kasibhatla, P., Crawford, J., Chen, G., S.Liu, Brady, A., Thornton, D., Guan, H., and sandholm, S.: Impact of ship emissions on marine boundary layer NOx and SO2distributions over the Pacific basin, Geophys. Res. Lett., 28, 235–238, 2001. 5973
25
Dentener, F., Stevenson, D., Cofala, J., Mecchler, R., Amann, M., Bergamaschi, P., Raes, F., and Derwent, R.: The impact of air pollutant and methane emission controls on tropospheric ozone and radiative forcing: CDT calculations for the period 1990–2030, Atmos. Chem.
ACPD
5, 5957–5985, 2005 European ozone trends J. E. Jonson et al. Title Page Abstract Introduction Conclusions References Tables Figures J I J I Back CloseFull Screen / Esc
Print Version Interactive Discussion
EGU
Phys., 4, 1–68, 2004,
SRef-ID: 1680-7324/acp/2004-4-1. 5964
Derwent, R., Jenkin, M., Saunders, S., Pilling, M., Simmonds, P., Passant, N., Dollard, G., Dumitrean, P., and Kent, A.: Photochemical ozone formation in north west Europe and its control, Atmos. Environ., 37, 1983–1991, 2003. 5959,5961
5
Derwent, R., Stevenson, D., Collins, W., and Johnson, C.: Intercontinental transport and the origins of the ozone observed at surface sites in Europe, Atmos. Environ., 38, 1891–1901, 2004. 5965
Endresen, Ø., Sørg ˚ard, E., Sundet, J., Dalsøren, S., Isaksen, I., Berglen, T., and Gravir, G.: Emission from international sea transport and environmental impact, J. Geophys. Res., 108,
10
doi:10.1029/2002JD002898, 2003. 5960,5973
Fagerli, H., Simpson, D., and Tsyro, S.: Unified EMEP model: Updates, in: Transboundary acidification, eutrophication and ground level ozone in Europe, EMEP/MSC-W Status Report 1/2004, The Norwegian Meteorological Institute, Oslo, Norway, 2004. 5966
Fuhrer, J., Sk ¨arby, L., and Ashmore, M.: Critical levels for ozone effects on vegetation in Europe,
15
Environmental Pollution, pp. 91–106, 1997. 5964
Fusco, A. and Logan, J. A.: Analysis of 1970 - 1995 trends in tropospheric ozone at Northern Hemisphere midlatitudes with the GEOS-CHEM model, J. Geophys. Res., 108, doi:10.1029/2002JD002742, 2003. 5960,5964
Hauglustaine, D. A. and Brasseur, G.: Evolution of tropospheric ozone under anthropogenic
20
activities and associated radiative forcing of climate, J. Geophys. Res., 106, 32 337–32 360, 2003. 5964
Honrath, R., Martin, R. O. M. V., Reid, J., Lapina, K., Fialho, P., Dziobak, M., Kneissl, J., and Westphal, D.: Regional and hemispheric impacts of anthropogenic and biomass burn-ing emissions on summertime CO and O3 in the North Atlantic lower free troposphere, J.
25
Geophys. Res., 109, doi:10.1029/2004JD005147, 2004. 5973
Jonson, J., Kylling, A., Berntsen, T., Isaksen, I., Zerefos, C., and Kourtidis, K.: Chemical effects of UV fluctuations inferred from total ozone and tropospheric aerosol variations, J. Geophys. Res., 105, 14 561–14 574, 2000a. 5966
Jonson, J., Tarras ´on, L., and Sundet, J.: Model calculations of present and future levels of
30
ozone and ozone precursors with a global and a regional model, Atmos. Environ., 35, 525– 537, 2001. 5966
ACPD
5, 5957–5985, 2005 European ozone trends J. E. Jonson et al. Title Page Abstract Introduction Conclusions References Tables Figures J I J I Back CloseFull Screen / Esc
Print Version Interactive Discussion
EGU
pollution levels, EMEP/MSC-W note 5/00, The Norwegian Meteorological Institute, Oslo, Norway, 2000b. 5973
Kanter, H.-J., Scheel, H., James, T. T. P., Stohl, A., and Feldmann, H.: Atmospheric long-range transport and its impact on the trace-gas distribution in the free troposphere over Central Europe (ATMOFAST), in: Ozone: Proceedings of the Quadrennial Ozone Symposium, edited
5
by: Zerefos, C. S., University of Athens, Athens, Greece, pp. 849–850, 2004. 5960,5963
Karlsdottir, S., Isaksen, I., Myhre, G., and Berntsen, T.: Trend analysis of O3 and CO in the period 1980–1996; A 3-D model study, J. Geophys. Res., 105, 28 907–28 934, 2000. 5964
Lelieveld, J. and Dentener, F.: What controls tropospheric ozone?, J. Geophys. Res., 105, 3531–3551, 2000. 5964
10
Li, Q., Jacob, D., Bey, I., Palmer, P., Duncan, B., Field, B., Martin, R., Fiore, A., Yan-tosca, R., Parrish, D., Simmonds, P., and Oltmans, S.: Transatlantic transport of pollution and its effects on surface ozone in Europe and North America, J. Geophys. Res., 107, doi:10.1029/2001JD001422, 2002. 5965,5966
Logan, J.: Trends in the vertical distribution of ozone: An analysis of ozonesonde data, J.
15
Geophys. Res., 99, 25 553–25 585, 1994. 5962
Logan, J.: An analysis of ozonesonde data for the troposphere: Recommendations for testing 3-d models and development of a gridded climatology for tropospheric ozone, J. Geophys. Res., 104, 16 115–16 150, 1999. 5966,5970
Logan, J., Megretskaia, A., Miller, A., Tiao, G., Choi, D., Zhang, L., Stolarski, R., Labow, G.,
20
Hollandsworth, S., Bodeker, G., Claude, H., DeMuer, D., Kerr, J., Tarasick, D., Oltmans, S., Johnson, B., Schmidlin, F., Staehelin, J., Viatte, P., and Uchino, O.: Trends in the vertical distribution of ozone: A comparison of two analyses of ozonesonde data, J. Geophys. Res., 104, 26 373–26 399, 1999. 5962
Løvblad, G., Tarras ´on, L., Tørseth, K., and Dutchak, S.: EMEP assessment PART I:
Euro-25
pean perspective, http://www.emep.int, The Norwegian Meteorological Institute, Oslo, Nor-way, 2004. 5961
Monks, P., Richard, A., Dentener, F., Jonson, J., Lindskog, A., Roemer, M., Schuepbach, E., Friedli, T., and Solberg, S.: Tropospheric ozone and precursors, trends budgets and policy, TROTREP synthesis and integration report,http://atmos.chem.le.ac.uk/trotrep, 2003. 5963,
30
5964,5965,5972
Naja, M., Akimoto, H., and Staehlin, J.: Ozone in background and photochemically aged air over central Europe: Analysis of long term ozonesonde data from Hohenpeissenberg and
ACPD
5, 5957–5985, 2005 European ozone trends J. E. Jonson et al. Title Page Abstract Introduction Conclusions References Tables Figures J I J I Back CloseFull Screen / Esc
Print Version Interactive Discussion
EGU
Payerne, J. Geophys. Res., 108, doi:10.1029/2002JD002477, 2003. 5962
NEGTAP: Transboundary air pollution: acidification, eutrophication and ground level ozone in the UK, http://www.nbu.ac.uk/negtap/, National Expert Group on Transboundary Air Pollu-tion, 2001. 5964
Oltmans, S., Lefohn, A., Scheel, H., Harris, J., Levy, H., Galbally, I., Brunke, E.-G., Meyer, C.,
5
Lathrop, J., Johnson, B., Shadwick, D., Cuevas, E., Schmidlin, F., Tarasick, D., H.Claude, Kerr, J., Uchino, O., and Mohnen, V.: Trends in ozone in the troposphere, Geophys. Res. Lett., 25, 139–142, 1998. 5962
Ord ´o ˜nez, C., Mathis, H., Furger, M., Henne, S., H ¨ulin, C., Staehelin, J., and Pr ´ev ˆot, A.: Changes of daily surface ozone maxima in Switzerland in all seasons from 1992 to 2002
10
and discussion of summer 2003, Atmos. Chem. Phys., 5, 1187–1203, 2005,
SRef-ID: 1680-7324/acp/2005-5-1187. 5962
Palmgren, F., Hansen, A., Berkowics, R., and Skov, H.: Benzene emissions from the actual car fleet in relation to petrol composition in Denmark, Atmos. Environ., 35, 35–42, 2001. 5961
Pavelin, E., Johnson, C., Rughooputh, S., and Toumii, R.: Evaluation of pre-industrial surface
15
ozone measurements made using Sch ¨onbein method, Atmos. Environ., 33, 919–929, 1999.
5962
Roemer, M.: Trends of ozone and precursors in Europe, Status report TOR-2, TNO report r2001/244, TNO, 2001. 5961,5962,5963
Roemer, M.: In search for trends of ozone and precursors, First progress report TROTREP,
20
TNO report r2001/100, TNO, 2001. 5962
Roemer, M., Beekmann, M., Bergstr ¨om, R., Boersen, G., Feldmann, H., Flatøy, F., Honore, C., Langner, J., Jonson, J., Matthijsen, J., Memmesheimer, M., Simpson, D., Smeets, P., Solberg, S., Stern, R., Stevenson, D., Zandveld, P., and Zlatev, Z.: Ozone trends according to ten dispersion models, Special report, EUROTRAC–2, 2003. 5965
25
Schuepbach, E., Friedli, T. K., Zanis, P., Monks, P., and Penkett, S.: State space analysis of changing seasonal ozone cycles (1988–97) at Jungfraujoch (3580 m asl) in Switzerland, J. Geophys. Res., 106, 20 413–20 427, 2001. 5962
Simmonds, P., Derwent, R., Manning, A., and Spain, G.: Significant growth in surface ozone at Mace Head, Ireland 1987–2003, Atmos. Environ., 38, 4769–4778, 2004. 5963
30
Simmonds, P., Manning, A., Derwent, R., Ciais, P., Ramonet, M., Kazan, V., and Ryall, D.: A burning question. Can recent growth rate anomalies in the greeenhouse gases be attributed to large-scale burning events?, Atmos. Environ., 39, 2513–2517, 2005. 5974
ACPD
5, 5957–5985, 2005 European ozone trends J. E. Jonson et al. Title Page Abstract Introduction Conclusions References Tables Figures J I J I Back CloseFull Screen / Esc
Print Version Interactive Discussion
EGU
Simpson, D., Fagerli, H., Jonson, J., Tsyro, S., Wind, P., and Tuovinen, J.-P.: Transboundary acidification, eutrophication and ground level ozone in Europe, PART 1, Status report 1/2003, The Norwegian Meteorological Institute, Oslo, Norway, 2003. 5966,5967
Solberg, S.: Monitoring of boundary layer ozone in Norway from 1977 to 2002, TOR 85/2003, NILU, Norwegian Institute for Air Research, 2003. 5963
5
Solberg, S.: VOC measurements 2002, Tech. Rep. EMEP/CCC 8/2004, http://www.nilu.no/
projects/ccc/reports/cccr08-2004.pdf, NILU, Norwegian Institute for Air Research, 2004.
5959,5961
Solberg, S., Simpson, D., Jonson, J., Hjellberekke, A., and Derwent, R.: Ozone, in: EMEP assessment PART I: European perspective, edited by: Løvblad, G., Tarras ´on, L., Tørseth,
10
K., and Dutchak, S., Tech. rep., The Norwegian Meteorological Institute, Oslo, Norway, 2004.
5963
Solberg, S., Bergstr ¨om, R., Langner, J., Laurila, T., and Lindskog, A.: Changes in Nordic surface ozone episodes due to European emission reductions in the 1990s, Atmos. Environ., 39, 179–192, 2005. 5965
15
Stocks, B., Mason, J., Todd, J., Bosch, E., Watson, B., Amino, B., Flannigan, M., Hirsch, K., Logan, D., Martell, D., and Skinner, W.: Large forest fires in Canada, 1959–1997, J. Geophys. Res., 108, 8149–8170, 2003. 5974
Streets, D., Bond, T., Carmichael, G. R., Fernandes, S. D., Fu, Q., He, D., Klimont, Z., Nel-son, S. M., Tsai, N. Y., Wang, M. Q., Woo, J.-H., and Yarber, K. F.: An inventory of
20
gaseous and primary aerosol emissions in Asia in the year 2000, J. Geophys. Res., 108, doi:10.1029/2002JD003093, 2003. 5960
Thijsse, T., Roemer, M., and van Oss, R.: Trends in large-scale VOC concentrations in the Southern Netherlands between 1991 and 1997, Atmos. Environ., 33, 3803–3812, 1999.
5961
25
Thouret, V., Cammas, J., Sauvage, B., Athi ´e, G., N ´ed ´elec, P., Zbinden, R., and Simonn, P.: Ozone climatology and inter–annual variability in the UT/LS region calculated from 8 years of MOZAIC measurements, in: Ozone: Proceedings of the Quadrennial Ozone Symposium, edited by: Zerefos, C. S., University of Athens, Athens, Greece, pp. 203–203, 2004. 5963
TOR-2: Tropospheric ozone research, EUROTRAC-2 subproject final report, ISS GSF National
30
Research Center for Environment and Health, Munich, Germany, 2003. 5963
UNECE: Present state of emission data, EB.AIR/GE, 1/2004/10, United Nations, Economic and Social Council,http://www.unece.org/env/emep/emep28 docs.htm, 2004. 5960
ACPD
5, 5957–5985, 2005 European ozone trends J. E. Jonson et al. Title Page Abstract Introduction Conclusions References Tables Figures J I J I Back CloseFull Screen / Esc
Print Version Interactive Discussion
EGU
Vestreng, V., Adams, M., and Goodwin, J.: Inventory review 2004: Emission data reported to CLRTAP and under the NEC directive, EMEP/MSC-W status report 1/04, The Norwegian Meteorological Institute, Oslo, Norway, 2004. 5959,5966
Volz, A. and Kley, D.: Evaluation of the Montsouris series of ozone measurements made in the nineteenth century, Nature, 332, 218–219, 1988. 5962
5
von Glasow, R., Lawrence, M., Sander, R., and Crutzen, P.: Modeling the chemical effects of ship exhaust in the cloud-free marine boundary layer, Atmos. Chem. Phys., 3, 233–250, 2003,
SRef-ID: 1680-7324/acp/2003-3-233. 5973
WMO: Scientific assessment of ozone depletion: 2002, Report no. 47, World Meteorological
600
ACPD
5, 5957–5985, 2005 European ozone trends J. E. Jonson et al. Title Page Abstract Introduction Conclusions References Tables Figures J I J I Back CloseFull Screen / Esc
Print Version Interactive Discussion
EGU
Table 1. Anthropogenic Emissions (Gg/year) for the EU25 Germany and N. America. EU25
includes Austria, Belgium, Cyprus, Czech Republic, Estonia, Denmark, Finland, France, Ger-many (former east and west), Greece, Hungary, Ireland, Italy, Latvia, Lithuania, Luxembourg, Netherlands, Poland, Portugal, Slovakia, Slovenia, Spain, Sweden and the United Kingdom. N. America includes Canada and USA.
Region 1990 NOx NMVOC CO EU 25 15 991 16 869 61 213 Germany 2845 3591 11 212 N. America 25 775 21 264 97 651 2002 NOx NMVOC CO EU 25 10 988 10 322 33 774 Germany 1499 1478 4311 N. America 21 721 17 790 111 562
ACPD
5, 5957–5985, 2005 European ozone trends J. E. Jonson et al. Title Page Abstract Introduction Conclusions References Tables Figures J I J I Back CloseFull Screen / Esc
Print Version Interactive Discussion
EGU
Fig. 1. Measured and model calculated NO2in µg(N)m−3for the sites (Westerland, Deuselbach Langenbr ¨ugge, Hoburg, Bredk ¨alen, Vavihill, Osen, K ˚arvatn, Tustervatn, Skre ˚adalen, Birkenes, Jarczew, K-puszta) left, and for the 3 German sites (Westerland, Deuselbach, Langenbr ¨ugge),
ACPD
5, 5957–5985, 2005 European ozone trends J. E. Jonson et al. Title Page Abstract Introduction Conclusions References Tables Figures J I J I Back CloseFull Screen / Esc
Print Version Interactive Discussion
EGU
Fig. 2. Measured and model calculated ozone in ppb. For all sites with continuous ozone
measurements for all relevant years (top left), German sites with measurements for all years (top right), Mace Head (bottom left) and Deuselbach (bottom right).
ACPD
5, 5957–5985, 2005 European ozone trends J. E. Jonson et al. Title Page Abstract Introduction Conclusions References Tables Figures J I J I Back CloseFull Screen / Esc
Print Version Interactive Discussion
EGU
J. E. Jonson and D. Simpson and and H. Fagerli and S. Solberg: European ozone trends 7
Fig. 3. Summer (June, July, August) mean of daily maximum ozone
in ppb. Top, summer ozone as calculated for 2002. Middle, differ-ence in summer ozone calculated for the meteorological year 2002 with emissions for 2002 compared to emissions for 1990. Bottom, difference in summer ozone calculated for the meteorological year 2002 with 10 year (AvgBC) boundary conditions.
line, in the countries around the English channel and in parts of Germany. High ozone events are also apparent in the Moscow area. As a result of emission changes from 1990
Fig. 4. Winter (January, February) mean of daily maximum ozone
in ppb. Top, Winter ozone as calculated for 2002. Middle, differ-ence in winter ozone calculated for the meteorological year 2002 with emissions for 2002 - 1990. Bottom, difference in winter ozone calculated with meteorological year 2002 with 10 year (AvgBC) boundary conditions
to 2002 the calculated magnitude of the highest ozone events have been reduced by 10 ppb or more in large parts of Eu-rope (Figure 5, bottom). In parts of west and central EuEu-rope
Fig. 3. Summer (June, July, August) mean of daily maxi-mum ozone in ppb. Top, sum-mer ozone as calculated for 2002. Middle, difference in sum-mer ozone calculated for the meteorological year 2002 with emissions for 2002 compared to emissions for 1990. Bottom, dif-ference in summer ozone cal-culated for the meteorological year 2002 with 10 year (AvgBC) boundary conditions.
ACPD
5, 5957–5985, 2005 European ozone trends J. E. Jonson et al. Title Page Abstract Introduction Conclusions References Tables Figures J I J I Back CloseFull Screen / Esc
Print Version Interactive Discussion
EGU
J. E. Jonson and D. Simpson and and H. Fagerli and S. Solberg: European ozone trends 7
Fig. 3. Summer (June, July, August) mean of daily maximum ozone
in ppb. Top, summer ozone as calculated for 2002. Middle, differ-ence in summer ozone calculated for the meteorological year 2002 with emissions for 2002 compared to emissions for 1990. Bottom, difference in summer ozone calculated for the meteorological year 2002 with 10 year (AvgBC) boundary conditions.
line, in the countries around the English channel and in parts of Germany. High ozone events are also apparent in the Moscow area. As a result of emission changes from 1990
Fig. 4. Winter (January, February) mean of daily maximum ozone
in ppb. Top, Winter ozone as calculated for 2002. Middle, differ-ence in winter ozone calculated for the meteorological year 2002 with emissions for 2002 - 1990. Bottom, difference in winter ozone calculated with meteorological year 2002 with 10 year (AvgBC) boundary conditions
to 2002 the calculated magnitude of the highest ozone events have been reduced by 10 ppb or more in large parts of Eu-rope (Figure 5, bottom). In parts of west and central EuEu-rope
Fig. 4. Winter (January,
Febru-ary) mean of daily maximum ozone in ppb. Top, Winter ozone as calculated for 2002. Middle, difference in winter ozone calcu-lated for the meteorological year 2002 with emissions for 2002– 1990. Bottom, difference in win-ter ozone calculated with meteo-rological year 2002 with 10 year (AvgBC) boundary conditions.
ACPD
5, 5957–5985, 2005 European ozone trends J. E. Jonson et al. Title Page Abstract Introduction Conclusions References Tables Figures J I J I Back CloseFull Screen / Esc
Print Version Interactive Discussion
EGU
Fig. 5. High ozone events (average for 7 highest days in the year) in ppb. Top, average for
year 2002. Bottom, difference in high ozone calculated for the meteorological year 2002 with emissions for the years 2002–1990.