HAL Id: hal-00301197
https://hal.archives-ouvertes.fr/hal-00301197
Submitted on 18 Apr 2006HAL is a multi-disciplinary open access
archive for the deposit and dissemination of sci-entific research documents, whether they are pub-lished or not. The documents may come from teaching and research institutions in France or abroad, or from public or private research centers.
L’archive ouverte pluridisciplinaire HAL, est destinée au dépôt et à la diffusion de documents scientifiques de niveau recherche, publiés ou non, émanant des établissements d’enseignement et de recherche français ou étrangers, des laboratoires publics ou privés.
A study on aerosol extinction-to-backscatter ratio with
combination of micro-pulse lidar and MODIS over Hong
Kong
Q. S. He, C. C. Li, J. T. Mao, A. K. H. Lau
To cite this version:
Q. S. He, C. C. Li, J. T. Mao, A. K. H. Lau. A study on aerosol extinction-to-backscatter ratio with combination of micro-pulse lidar and MODIS over Hong Kong. Atmospheric Chemistry and Physics Discussions, European Geosciences Union, 2006, 6 (2), pp.3099-3133. �hal-00301197�
ACPD
6, 3099–3133, 2006
Aerosol extinction-to-backscatter ratio by
lidar and MODIS
Q. S. He et al. Title Page Abstract Introduction Conclusions References Tables Figures J I J I Back Close
Full Screen / Esc
Printer-friendly Version Interactive Discussion
EGU Atmos. Chem. Phys. Discuss., 6, 3099–3133, 2006
www.atmos-chem-phys-discuss.net/6/3099/2006/ © Author(s) 2006. This work is licensed
under a Creative Commons License.
Atmospheric Chemistry and Physics Discussions
A study on aerosol
extinction-to-backscatter ratio with
combination of micro-pulse lidar and
MODIS over Hong Kong
Q. S. He1, C. C. Li1, J. T. Mao1, and A. K. H. Lau2
1
Department of Atmospheric Science, School of Physics, Peking University, Beijing, China
2
The Institute for the Environment, the Hong Kong University of Science and Technology, Hong Kong, China
Received: 29 November 2005 – Accepted: 1 February 2006 – Published: 18 April 2006 Correspondence to: C. C. Li (ccli@pku.edu.cn)
ACPD
6, 3099–3133, 2006
Aerosol extinction-to-backscatter ratio by
lidar and MODIS
Q. S. He et al. Title Page Abstract Introduction Conclusions References Tables Figures J I J I Back Close
Full Screen / Esc
Printer-friendly Version Interactive Discussion
EGU
Abstract
The aerosol extinction-to-backscatter ratio is an important parameter for inverting LI-DAR signals in the LILI-DAR equation. It is also a complicated function of aerosol micro-physical characteristics depending on geographical and meteorological conditions. In this paper, a method to retrieve the column-averaged aerosol extinction-to-backscatter
5
ratio by constraining the aerosol optical depths (AOD) recorded by the Moderate Res-olution Imaging Spectroradiometer (MODIS) to the ones measured by a Micro-pulse LIDAR (MPL) is presented. Both measurements were taken between 1 May 2003 and 30 June 2004 over Hong Kong, a coastal city in south China. Simultaneous scatter-ing coefficients measured by a forward scattering visibility sensor are compared with
10
the LIDAR retrieval. The data are then analyzed in terms of monthly and seasonal trends. In addition, the relationships between the extinction-to-backscatter ratio and wind conditions as well as other aerosol microphysical parameters are also presented. The mean aerosol extinction-to-backscatter ratio for the whole period is found to be 28.9±6.1 sr, with the minimum of 12 sr in August 2003 and the maximum of 44 sr in
15
March 2004. The ratio is lower in the summer because of the dominance of oceanic aerosols in association with the prevailing southwesterly monsoon. In contrast, rela-tively larger ratios are noted in spring and winter because of the increased impact of local and regional industrial pollutants associated with the northerly monsoon. The extended LIDAR measurements over Hong Kong provide not only a more accurate
re-20
trieval of aerosol extinction coefficient profiles, but also significant information for air pollution and climate studies in the region.
1 Introduction
Atmospheric aerosols play an important role in the earth’s radiation budget. They in-fluence the lifetime and microphysical properties of clouds, precipitation rates and
tro-25
ACPD
6, 3099–3133, 2006
Aerosol extinction-to-backscatter ratio by
lidar and MODIS
Q. S. He et al. Title Page Abstract Introduction Conclusions References Tables Figures J I J I Back Close
Full Screen / Esc
Printer-friendly Version Interactive Discussion
EGU Phadnis and Carmichael, 2000), and hence are very important in climate change study
(Charlson et al., 1992). However, there are still many outstanding problems related to the determination of their physical and chemical properties, as well as their spatial and temporal distributions. These problems are significant for the study and modeling of cli-mate change (Andreae and Crutzen, 1997). In particular, understanding of the aerosol
5
vertical structure is still very limited because of its high spatial and temporal variability. To characterize the optical properties of atmospheric aerosols, as well as their spatial and temporal distributions, LIDAR (Light Detection And Ranging) method has proved to be very useful (Collis and Russell, 1976; Sassen and Cho, 1992; Welton et al., 2002). However, retrieval of the aerosol extinction profile from backscattered LIDAR
measure-10
ments requires the knowledge of the ratio between aerosol extinction and backscat-tered coefficients (Fernald, 1984). This problem can be solved by using the high spec-tral resolution LIDAR techniques (Grund and Eloranta, 1991) and elastic-Raman LIDAR measurements (Ansmann et al., 1992). Both techniques allow simultaneous determi-nation of the aerosol extinction and backscattered coefficients, but may not be easily
15
employed in daytime and can only be afforded in short-term campaigns at present. The aerosol extinction-to-backscatter ratio, or the LIDAR ratio (LR), is often used to analyze the elastic-LIDAR signal in the two-component LIDAR equation. In general, LR is a complicated spatial and temporal function depending on the distribution of size, shape and composition of the aerosols. Further, the micro-physical characteristics of
20
aerosols can be classified according to their geographical origin such as urban, rural, marine or continental, and also to local meteorological conditions. Typically, different but constant LRs are assumed and used for different types of aerosols. Many studies (Sasano et al., 1985; Kovalev, 1995) show that an inaccurate assumption of LR can lead to large errors in the aerosol extinction coefficients, and the problem is particularly
25
serious under inhomogeneous atmospheric conditions where the aerosol-to-molecular extinction ratio is highly varying. Hence, LR must be estimated carefully with respect to the geographical location and meteorological conditions of the measurement site.
ACPD
6, 3099–3133, 2006
Aerosol extinction-to-backscatter ratio by
lidar and MODIS
Q. S. He et al. Title Page Abstract Introduction Conclusions References Tables Figures J I J I Back Close
Full Screen / Esc
Printer-friendly Version Interactive Discussion
EGU lacking because of the difficulty noted earlier. Previous studies show that the value of
LR varies from 20 to 100 sr (Collis and Russel, 1976; Zuev, 1982; Browell et al., 1985). Experimental studies have also been carried out concerning the variability of the LR; by using data from a nephelometer (wavelength at 680 nm) and a ruby LIDAR (wavelength at 694 nm), Waggoner et al. (1972) retrieved an aerosol scattering-to-backscatter ratio
5
of about 84 sr for relative humidity less than 75%. A decade later, Salemink et al. (1984) showed a linear increase of LR from 25 to 70 sr for relative humidity between 40% and 80% at wavelength 532 nm near the ground. Using climatological values of aerosol size distributions, Ackermann (1998) has modeled LR values for different tropospheric aerosol types at typical wavelengths (355 nm, 532 nm and 1064 nm) using Nd:YAG
10
lasers. More recently, Ferrare et al. (1998) shows that a significant change in LR is likely at the top of the atmospheric boundary layer (ABL).
In the absence of the direct LR measurements, column-averaged LR may be esti-mated by constraining the vertical integral of LIDAR-derived aerosol extinction coef-ficients with independent aerosol optical depth measurements (Welton et al., 2000;
15
Chazette, 2003). Generally, this method can be applied to LIDAR acquisitions in paral-lel with sunphotometer measurements.
In this paper, we shall present a method to estimate the May 2003 to June 2004 variations of the aerosol extinction-to-backscatter ratio by constraining AOD measure-ments from MODIS and a MPL. A similar study recently shows good results in the case
20
of comparison between Meteosat and LIDAR data (Dulac and Chazette, 2003). For the first time, this study uses MODIS data to estimate the extinction-to-backscatter ratio. In addition, aerosol extinction coefficients near the surface are obtained by retrieving the MPL signals, and compared with measurements taken by a collocated visibility sensor. Finally, the monthly and seasonal characteristics of LR, and the relationship of LR with
25
ACPD
6, 3099–3133, 2006
Aerosol extinction-to-backscatter ratio by
lidar and MODIS
Q. S. He et al. Title Page Abstract Introduction Conclusions References Tables Figures J I J I Back Close
Full Screen / Esc
Printer-friendly Version Interactive Discussion
EGU
2 Measurements
Two Moderate Resolution Imaging Spectroradiometers (MODIS) were launched aboard the polar orbiting spacecrafts Terra (December 1999) and Aqua (May 2002). For the past few years, global data have been taken daily in 36 spectral bands from the visible to the thermal infrared, with 29, 5 and 2 of these bands at 1 km, 500 m and 250 m nadir
5
pixel dimensions, respectively. Detail description of the MODIS data can be found in Kaufman et al. (1997). Terra’s sun-synchronous orbit has a dayside equatorial local crossing time at 11:00 a.m. and the corresponding time for Aqua is 03:00 p.m. Kauf-man and Tanr’e (1998) describes two separate algorithms for aerosol retrieval from MODIS over land and ocean surfaces. Aerosol products are stored as MODIS Level
10
2 (MOD04 L2) files, each corresponding to five-minute acquisition along the satel-lite orbit. The Level 2 AODs are processed and archived at a spatial resolution of 10×10 km (at nadir). To assess the quality of these parameters, a substantial part of the Terra-MODIS aerosol products have been validated globally and regionally (Chu et al., 2002; Remer et al., 2005). The validation process is also under continuously
15
development to ensure high product quality. As discussed in MODIS aerosol products validation studies, the accuracy of the MODIS AOD retrievals over land is estimated to be∆AOD=±0.05±0.2AOD (Chu et al., 2002) or ∆AOD=±0.05±0.15AOD (Remer et al., 2005).
Aerosol characteristics are mainly determined by the geographical and climatological
20
features of the observation sites. A MPL system, operated by the Hong Kong University of Science and Technology (HKUST), is located at Yuen Long (22.44◦N, 114.02◦E), an urban area in the northwestern part of Hong Kong. Hong Kong is a densely populated city just over 1100 km2 with 6.8 million people. It is adjacent to the Pearl River Delta (PRD) region, which is one of the most rapidly developing and heavily industrialized
25
regions in southern China along the northern coast of the South China Sea (Cao et al., 2003). In this regard, the MPL station in Yuen Long is useful for monitoring of both oceanic and continental aerosols.
ACPD
6, 3099–3133, 2006
Aerosol extinction-to-backscatter ratio by
lidar and MODIS
Q. S. He et al. Title Page Abstract Introduction Conclusions References Tables Figures J I J I Back Close
Full Screen / Esc
Printer-friendly Version Interactive Discussion
EGU The MPL has been operated automatically and almost continuously around the clock
from 1 May 2003 to 30 June 2004, except for maintenance from 18 December 2003 to 13 February 2004. The site, at the rooftop of a building, is 28 m above ground level. The bin time of the MPL receiver is set to 200 ns and corresponds to a vertical resolution of 30 m. The MPL pulse repetition rate is 2500 Hz and the wavelength is 523 nm (Nd:YLF).
5
Data are recorded for every 15 s. Cloud-free days in the study period, when the MPL and satellite data are both available, are selected for analysis. The monthly number of cloud-free days with simultaneous MPL and MODIS measurements during the study are listed in Table 1. MPL signals are averaged within a time window of ±30 min around the satellite over-passing time.
10
3 Methodology
The columnar LR value is constrained by comparing the vertically integrated LIDAR-derived extinction coefficient (wavelength (λ) at 523 nm) with the independent MODIS-derived AOD data (wavelength (λ) at 550 nm). The procedure consists of three main steps:
15
3.1 Retrieval of aerosol extinction coefficient
In general, the inversion of the LIDAR profile is based on the solution of single scatter-ing LIDAR equation which can be expressed in the form:
P (r)= CEβ(r)
r2 exp[−2
Zr
0
σ(z)d z] (1)
where r is the range, β(r) represents the total backscattering coefficient
20
β(r)=βm(r)+βa(r), σ(r) is the total extinction coefficient σ(r)=σm(r)+σa(r), C is a con-stant term called LIDAR concon-stant inclusive of the transmission and the detection ef-ficiency, and E is the laser pulse energy. βm(r) and σm(r) are molecular contribu-tions to the backscattering and the extinction coefficients, respectively, and can be
ACPD
6, 3099–3133, 2006
Aerosol extinction-to-backscatter ratio by
lidar and MODIS
Q. S. He et al. Title Page Abstract Introduction Conclusions References Tables Figures J I J I Back Close
Full Screen / Esc
Printer-friendly Version Interactive Discussion
EGU evaluated by Rayleigh-scattering theory from the Standard Atmosphere 1976 (NASA,
1976). The received signals are normalized to the laser source, noise-subtracted, and square-range corrected. The overall error in the aerosol backscattered signals arose from many sources, including uncertainty of C, errors in the background and noise-subtraction, and nonlinearities in the detecting electronics. The overall error in the
5
aerosol backscatter cannot be precisely computed, but is estimated to be 10–15% at wavelength 523 nm. In this study, we have not taken into account effects from multiple scattering. Using numerical methods, Ackermann et al. (1999) studied the influence of multiple scattering on the retrieval of extinction coefficients of the tropospheric aerosols, and their simulation shows that the contribution from multiple scattering in the LIDAR
10
signal is typically less than 10% and never exceeds 20% [based on the assumption of constant extinction coefficient below the ABL (chosen at 15.65, 3.91, 1.96, 0.783, and 0.078 km−1), and an exponentially decay value above the ABL]. For all types of aerosols in the urban environment, the contribution of multiple scattering on the re-trieved aerosol extinction profile in the ABL is found to be less than 3%. Neglecting
15
multiple scattering, the LIDAR equation can be written in one equation with three un-knowns, namely, C, βa(r), and σa(r).
The stable analytical inversion procedure proposed by Klett (1985), which is more effective for optically thick atmospheric conditions, does not have particular advantage in the present situation with small optical depths. To determine the aerosol backscatter
20
βa(r) and extinction coefficient σa(r), the Fernald’s (1984) forward inversion scheme is used for the LIDAR signal inversion:
σa(r)= X (r) exp[2(1 − s) Rr 0σm(z)d z] C sa − 2 Rr 0X (z) exp[2(1 − s) Rz 0σm(z0)d z0]d z − sσm(r) (2)
where r is the range, X (r)=P (r)·r2, s=sa/smwhere sm=(8π/3) is the molecular extinc-tion to backscatter ratio, and sais LR.
25
To determine the σa(r) in Eq. (2), the value of LR and the LIDAR constant C must be known. C is a source of systematic error, and its calibration is performed
experi-ACPD
6, 3099–3133, 2006
Aerosol extinction-to-backscatter ratio by
lidar and MODIS
Q. S. He et al. Title Page Abstract Introduction Conclusions References Tables Figures J I J I Back Close
Full Screen / Esc
Printer-friendly Version Interactive Discussion
EGU mentally by using independent measured AODs which are made with a Microtops Sun
photometer for four separated days (12 May, 30 August, 17 October 2003, and 17 February 2004, respectively) (Welton et al., 2000). The accuracy of the calibration is estimated to be ±3%. The differences in the calibration coefficient derived at inter-vals during the measurement period are small, suggesting that the same calibration
5
coefficient can be used to retrieve σa(r) without significant error. 3.2 Validation of MODIS AOD product
MODIS AOD within 0.1◦×0.1◦ (i.e. about 10×10 km pixels) around the MPL site is se-lected to constrain the LIDAR AOD, corresponding to the geographical area within the latitude and longitude ranges 22.34◦N to 22.54◦N and 113.92◦E to 114.12◦E.
Re-10
cently, Remer et al. (2005) compared 5906 MODIS AOD retrievals with AERONET measurements and confirmed that one standard deviation of the MODIS AOD retrievals falls within the predicted uncertainty of∆AOD=±0.05±0.15AOD over land at a wave-length of 550 nm. Li (2002) and Li et al. (2003) compared AOD derived from sunpho-tometer with MODIS level 2 AOD product for almost 2 years, and concluded that the
15
level 2 MODIS AOD product is of high precision over South China where the surface reflectivity is relatively low for visible wavelengths due to dense perennial vegetation coverage in the region.
3.3 Retrieval of LR
We use a “Look-up Table” approach based on inter-comparison of AOD values derived
20
from MPL and MODIS data. Given respective uncertainties of the AOD retrievals, the difference in wavelengths is negligible. Di Girolamo et al. (1999) noted that the over-all variability of LR in the 355–723 nm spectral range does not exceed 15% for size range from 0.1 µm to 1.0 µm, confirming the small variability of LR within this spectral band. When LR increases monotonously from 5 to 100 in unit steps, different
verti-25
ACPD
6, 3099–3133, 2006
Aerosol extinction-to-backscatter ratio by
lidar and MODIS
Q. S. He et al. Title Page Abstract Introduction Conclusions References Tables Figures J I J I Back Close
Full Screen / Esc
Printer-friendly Version Interactive Discussion
EGU Eq. (2). With that, the AOD value can also be obtained by performing the integral of
extinction coefficient from the surface (ground level) up to 4 km assuming the absence of stratospheric aerosols. Elastic LIDAR measurements show that aerosols in those very high layers contribute very little to the total AOD. Additionally, for the lowest layer (0–145 m), the vertical AODs are calculated by assuming the aerosol extinction coe
ffi-5
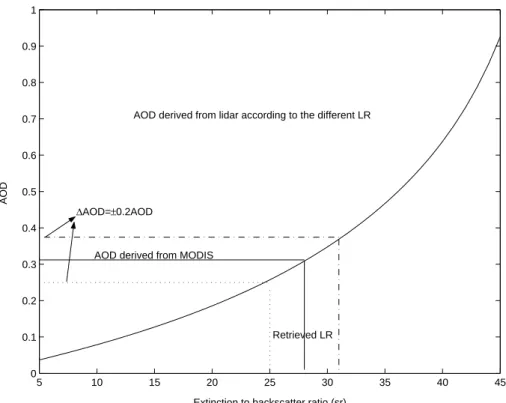
cient closest to the ground level as representing the extinction for the missing heights. Figure 1 shows an example of a typical retrieval process for the LR. The LR, from which the LIDAR AOD is selected to be closest to the MODIS AOD, is defined to be the appropriate extinction-to-backscatter ratio during the observation period. The pro-cess is constrained specifically so that the AOD derived from the MPL data is equal to
10
the MODIS data at wavelength 550 nm during the days selected. The best agreement between the AODs from both measurements is obtained by considering a LR value of 28 sr. The relative uncertainty for wavelength (λ) 550 nm from MODIS yields an uncer-tainty of ±3 sr on the LR. Finally, we also note that the vertical profiles of the extinction coefficient are each averaged from MPL data taken over 60 min.
15
4 Results
4.1 Inter-comparison of MPL retrieved extinction coefficient with scattering coefficient It is difficult to validate the retrieval results due to lack of in-situ measurements, but it is feasible to evaluate the LR by comparing the near-surface aerosol extinction coe ffi-cients derived simultaneously from the LIDAR and the Belfort forward visibility sensor.
20
The Belfort forward visibility sensor emits a red flash light to illuminate a volume of air and a sensor to measure the scattered red light at angle about 40◦.
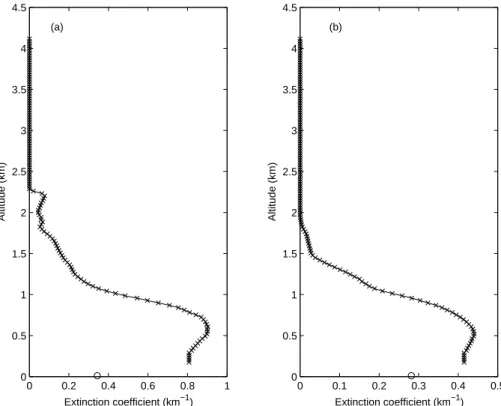
Figure 2 indicates the mean vertical aerosol extinction coefficient profiles retrieved from the MPL data with the above determined LR (a) at 11:00 a.m. on 1 November 2003 and (b) at 01:00 p.m. on 27 November of 2003, and the corresponding AODs
25
correspond-ACPD
6, 3099–3133, 2006
Aerosol extinction-to-backscatter ratio by
lidar and MODIS
Q. S. He et al. Title Page Abstract Introduction Conclusions References Tables Figures J I J I Back Close
Full Screen / Esc
Printer-friendly Version Interactive Discussion
EGU ing aerosol scattering coefficients obtained by the visibility sensor are plotted on the
x-axis. The LR for Fig. 2a is determined to be approximately 36 sr by inter-comparison of the AOD value derived by MODIS and MPL. The LIDAR-derived surface extinction coefficient is about 0.808 km−1, which is the value closest to ground level in the vertical aerosol extinction coefficient profile. In contrast, the visibility sensor measured
extinc-5
tion coefficient is 0.344 km−1. For discrete aerosol layers found above 2 km, this can be attributed to the residual layer formation from the previous day or the migration from remote areas. The value of LR is well comparable with the values found during the INDOEX experiment in the Asian tropical regions over urban areas (Wandinger et al., 2002). The ˚Angstr ¨om exponent value of 0.84 from MODIS level 2 products indicate
10
the presence of bigger particles in the atmosphere, such as mineral aerosols and sul-phate, possible originating from the industrial and urban activities in the city. This can further be verified by analyzing the corresponding satellite data as well as the air mass back-trajectory.
Figure 3 shows the MODIS AOD data over the PRD region on 1 November 2003.
15
High AOD values are found in north-west part of Hong Kong indicating that the pres-ence of advected aerosols (0.8<AOD<1.2) from local urban activities or from industrial sources in the PRD region. The blank areas in Fig. 3 suggest the existence of cloud which may be an error in the cloud mask algorithm, judging from the considerable AOD over the PRD region.
20
MPL inversions coupled with the MODIS measurements find a mean LR of 23 sr at 01:00 p.m. on 27 November 2003. Figure 2b shows the vertical aerosol extinction coefficient on the day as calculated by the retrieved LR. MPL extinction profiles indi-cate that aerosols are mainly confined below 1.5 km for a very clear condition. The LIDAR-derived surface extinction coefficient is about 0.415 km−1, in comparison to the
25
visibility sensor measured extinction coefficient on wavelength of red is 0.282 km−1. The aerosol extinction-to-backscatter ratio of 23 sr on this day can be considered as a typical value for mixture of suburban and maritime aerosols (Kneizys et al., 1983). The MODIS measured ˚Angstr ¨om exponent is 0.46, indicating the presence of slightly larger
ACPD
6, 3099–3133, 2006
Aerosol extinction-to-backscatter ratio by
lidar and MODIS
Q. S. He et al. Title Page Abstract Introduction Conclusions References Tables Figures J I J I Back Close
Full Screen / Esc
Printer-friendly Version Interactive Discussion
EGU particles in the atmosphere, such as sea salt and mineral aerosols. In fact, over urban
or industrial areas, optical properties are dominated by fine particles (Dubovik et al., 2002). In maritime conditions, the relative contribution of coarse particles are variable (Smirnov et al., 2002) and generally higher than those over urban or industrial areas but lower than the desert dust (Dubovik et al., 2002).
5
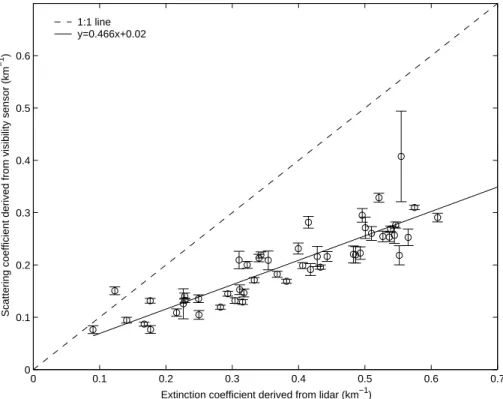
Figure 4 presents the scatter plots of the surface extinction coefficient observed by the MPL and visibility sensor. The error-bar on each circle denotes the standard de-viation of the hourly-averaged scatter coefficient derived from visibility sensor. The slope of the best fit curve of scatter plots is about 0.5, showing that the scatter coef-ficient derived from the visibility sensor is systematically less than the one from MPL.
10
The two measurements are almost the same for clear sky conditions but there can be large differences in highly turbid conditions with a maximum difference up to 0.6 km−1. The discrepancy may be related to three different reasons. Firstly, the comparison is performed at different altitudes, i.e., the MPL data at 145 m while the visibility sensor at about 2 m above ground. Although the measurements taken around noon (10:00–
15
14:00 local time) when the boundary layer is generally considered to be well-mixed, the extinction coefficient actually increases with height within the mixing layer, as ob-served from available extinction coefficient profile above the missing height; hence the extinction coefficient from the visibility sensor may be less than those calculated from the MPL data. Secondly, different wavelength measurements are used since visibility
20
sensors measured at red light (wavelength 600 to 800 nm) while the MPL at green light (wavelength 523 nm). The extinction coefficients at red light should be less than the one at green light. Thirdly, the visibility sensor measured extinction coefficients do not in-clude the absorption coefficients. In highly turbid areas such as the PRD, the influence of absorbing aerosol on the extinction coefficient could not be neglected (Ansmann et
25
al. 2005). Despite all the above sources of error, it can be shown that the extinction coefficients estimated from MPL have good relationship with the in situ measurement as their correlation coefficient reaching the value of 0.91. The analysis indicates that LR derived by the combination of MPL and MODIS can reasonably represent the actual
ACPD
6, 3099–3133, 2006
Aerosol extinction-to-backscatter ratio by
lidar and MODIS
Q. S. He et al. Title Page Abstract Introduction Conclusions References Tables Figures J I J I Back Close
Full Screen / Esc
Printer-friendly Version Interactive Discussion
EGU characteristics of atmospheric aerosols over Hong Kong.
4.2 Overview of LR characteristics
For the whole measurement period, the extinction-to-backscatter ratio has an aver-aged value of 28.9±6.1 sr with the maximum of 44 sr (5 March 2004) and minimum of 12 sr (23 August 2003) over Hong Kong as estimated from the MODIS AOD and the
5
LIDAR AOD below 4 km. In general, LR can be used to identify the dominant aerosol type (Ackermann, 1998). In particular, LR increases as the particle size decreases and more absorption contribute to the light extinction. It is also suggested that larger size companied by less-absorbing particles result in smaller LRs and highly absorb-ing particles should have larger LRs (Ansmann et al., 2001). For maritime aerosols,
10
Ackermann (1998) found the average LRs ranging from 17 sr to 24 sr. Recently, De Tomasi and Perrone (2003) reported LR measurements over southeastern Italy with average values ranging from 23 sr to 44 sr for air masses advected from the West At-lantic and Mediterranean Sea. On the southwestern coast of India (Goa), Chazette (2003) reported an average value of 35.7±10 sr in February 1999. Hence, the mean
15
LR calculated in this study suggests more characteristics of maritime aerosols.
Figure 5a shows that the modal value of LR (22 out of 96) is observed in the range 24.8 sr to 28.0 sr if all the available LRs are binned into ten equally spaced segments. The solid line denotes the Gaussian distribution fit curve according to the parame-ters listed in Tables 2. The Gaussian distribution is used to represent the cumulative
20
frequency distribution of the LR. Two tests, namely the Jarque-Bera test and the Lil-liefors test, are employed to check the quality of the fitted distribution function. The Jarque-Bera test evaluates the hypothesis that a sample has a normal distribution with unspecified mean and variance, against the alternative that the sample does not have a normal distribution. The Lilliefors test is similar to the Kolmogorov-Smirnov test
ex-25
cept for adjusting the parameters of the normal distribution which is estimated from sample rather than specified in advance. For both tests, threshold values reaching a significance level of 95% are given in Table 2. We find that both tests accepted the
ACPD
6, 3099–3133, 2006
Aerosol extinction-to-backscatter ratio by
lidar and MODIS
Q. S. He et al. Title Page Abstract Introduction Conclusions References Tables Figures J I J I Back Close
Full Screen / Esc
Printer-friendly Version Interactive Discussion
EGU hypothesis that the binned LR distribution approximates a Gaussian distribution at the
95% confidence level. Figure 5b shows the cumulative frequency distribution of the LR (solid line) and Gaussian distribution fit curve (dashed line).
4.3 Monthly and seasonal characteristics of LR
Figure 6 shows the monthly average and standard deviations of LR from May 2003
5
to June 2004. The maximum monthly average LR is 39.5 sr in March 2004 and the minimum is 21 sr in August 2003. The LR shows a significant trend of monotonic de-creasing from June to August 2003 and monotonic inde-creasing from September to De-cember 2003. The month to month variation of LR during the increasing period (from September to December) is mild but falls rapidly for the decreasing period (from June
10
to August). Meanwhile, the standard deviation for the decreasing period is larger than the increasing period. This shows that photochemical characteristics (and hence the origin) of aerosols over the MPL site are highly variable in the decrease period. Acker-mann (1998) reported the LR for continental aerosols at about 40–80 sr. The relatively high value of LR in March 2004 indicates strong aerosol absorption in this season.
Fre-15
quent precipitations and rich oceanic aerosols being transported into this region during summer may have reduced the absorption of aerosols and hence resulting in a lower LR value in August 2003. In addition, the deeper ABL may have significant influence on the MPL signals and thus lower LR values from July to September 2003 due to increased backscattering from dust like aerosol particles from the ground (Maletto et
20
al., 2003).
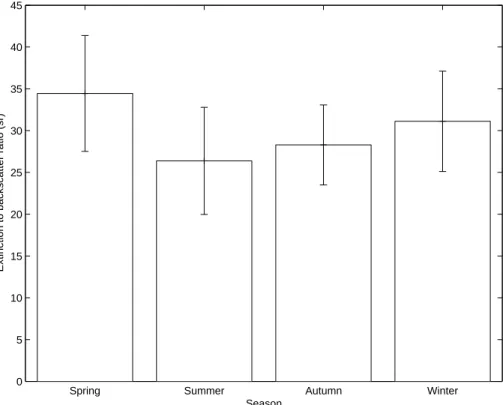
Figure 7 shows the seasonal variation of LR in Hong Kong. In this analysis we take March, June, September and December, respectively, as the first month of spring, sum-mer, autumn and winter. The error bar is the standard deviation of LR in each season. The highest peak of LR is up to 34.4±6.9 sr in the spring and the lowest value is down
25
to 26.4±6.4 sr in the summer. The lower troposphere over Hong Kong is affected by continental pollutants. By analyzing aircraft data, Kok et al. (1997) find that the com-plex flow patterns is important in controlling both the local and regional transport of
ACPD
6, 3099–3133, 2006
Aerosol extinction-to-backscatter ratio by
lidar and MODIS
Q. S. He et al. Title Page Abstract Introduction Conclusions References Tables Figures J I J I Back Close
Full Screen / Esc
Printer-friendly Version Interactive Discussion
EGU pollutants over Hong Kong. Under the influence of Asian pollutants (i.e. mainly carbon
soot), high values of LR up to 100sr and average of 59±24 sr had been measured dur-ing the February–March 1999 INDOEX intensive field experiment (Franke et al., 2001). The monthly mean extinction-to-backscatter ratio of the haze layer over the PRD region in October 2004 is 46.7 sr (Ansmann et al., 2005). Therefore, the higher LR values in
5
spring are quite realistic and due to the influence of the continental outflow over South-ern China. In contrast, the lower LR values in the summer are characteristic of mar-itime aerosols. This interpretation is consistent with back-trajectory and residence time analysis by Louie (2005), which shows a prevailing northeasterly wind from the conti-nent in autumn and winter and a southerly flow from the South China Sea in summer.
10
The Asiatic monsoon is the dominant driver of wind over the PRD region, and signifi-cantly influences the local and regional pollutants transport (Chang and Krishnamurti, 1987). In winter, strong radiative cooling over the continent creates a high-pressure anticyclone that drives the cold and dry air from the continent to the ocean, resulting in a weak to moderate northeasterly or strong northerly winds (Murakami, 1979). In
15
spring, moderate northeasterly wind is predominant. In summer, a low-pressure trough draws moist warm air from the ocean towards the continent, resulting frequent occur-rence of precipitation. Finally, in autumn, oceanic southerly weakens while easterly and northeasterly become stronger. Over Hong Kong, the persistent northeast monsoon in spring and winter carries pollutants from various potential sources over southeastern
20
regions of China, while the southerly monsoon brings cleaner maritime air during the summer. The different prevailing wind directions in summer and winter are associated with the seasonal variations of the LR over Hong Kong.
Table 3 presents the statistical parameters of seasonal aerosol extinction-to-backscatter ratio, ˚Angstr ¨om exponent and surface extinction coefficient observed in
25
Hong Kong. The correlation coefficient is −0.6 in summer indicating a significant anti-correlation between the ˚Angstr ¨om exponent and the LR. While the mean LR is 26.4±6.4 sr and the mean ˚Angstr ¨om exponent is 1.55±0.71. The large value of
˚
pollutant-ACPD
6, 3099–3133, 2006
Aerosol extinction-to-backscatter ratio by
lidar and MODIS
Q. S. He et al. Title Page Abstract Introduction Conclusions References Tables Figures J I J I Back Close
Full Screen / Esc
Printer-friendly Version Interactive Discussion
EGU related. However, the corresponding small value of LR may be attributed to the mixing
of some sea-salt aerosols (Ackermann, 1998).
4.4 Relationship of LR with meteorological conditions and optical parameters
To understand the variation of LR at a location, it is important to examine the rela-tionship between LR and the various potential pollutant sources. Figure 8 presents
5
the result for the LR distribution in relation to wind direction and wind speed observed by an Automatic Weather Station (AWS) which is collocated with MPL. Figure 8 shows that the LR values over Hong Kong are lower (15–28 sr) under prevailing southerly con-ditions when oceanic aerosols will be carried over Hong Kong. This low value is also partly due to aerosols constitute of sea-salt or mineral material. Larger values of LR (up
10
to 40 sr) are associated with strong easterly and northerly winds. Moreover, LR may go up to about 40sr under weak wind condition irrespective to wind direction; this may be related to the dominance of local urban / industrial emissions with strong absorption near the MPL site. The lowest value of LR found under the northeasterly wind speed (less than 3 m/s) conditions implies that typical oceanic aerosols from the northwest
15
Pacific Ocean have advected to the MPL site. The largest LR values are associated with moderate to strong northwesterly winds (greater than 3 m/s), suggesting that re-gional transport from the dense-populated southeastern China may have contributed significant amount of absorptive aerosols. However, the impact is less significant under moderate-to-weak winds conditions.
20
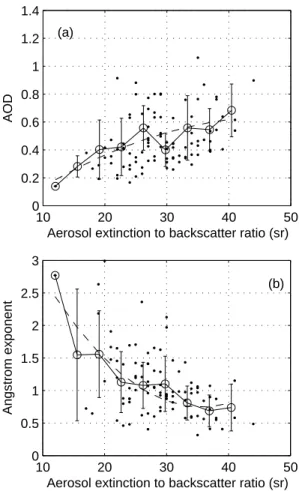
Figure 9 shows the relationship between the retrieved LR and the corresponding ˚
Angstr ¨om exponent and AOD. Here, the mean and standard deviations are computed at nine equally spaced bins of LR. The dashed line represents the best polynomial fit
y=ax2+bx+c where y is the AOD (or ˚Angstr¨om exponent), and x is the LR. A
least-square procedure was employed to determine the polynomial fit parameters; these
pa-25
rameters, as well as the correlation coefficients of the fit, are listed in Table 4. Figure 9a shows slight increase in AOD is associated with increasing LR; this may be related to an increase of absorption by aerosols or a relative increase of extinction induced by
hy-ACPD
6, 3099–3133, 2006
Aerosol extinction-to-backscatter ratio by
lidar and MODIS
Q. S. He et al. Title Page Abstract Introduction Conclusions References Tables Figures J I J I Back Close
Full Screen / Esc
Printer-friendly Version Interactive Discussion
EGU groscopic particles. Figure 9b shows that the LR increases as the ˚Angstr ¨om exponent
decreases, which is different from the study by Ansmann et al. (2001), but similar to the result by Anderson et al. (2003) found for pollution outbreaks advected from China over the Pacific. We note that the ˚Angstr ¨om exponent is directly related to the slope of a Junge-type size distribution. While LR is dependent upon the aerosol phase
func-5
tion and the single scatter albedo in the form Sa=ω4π
0P (π), and therefore it is sensitive
not only to changes in particle size, but also to the shape and refractive index. Ex-cept for absorptive particles, the large dust like aerosols characterized by relative small backscattering component may be responsible for the larger LR. Low ˚Angstr ¨om expo-nent may result from continuous city construction, low plant coverage, ubiquitous local
10
floating dust and large amounts of soot generated from industrial coal combustion and culinary natural gas (Li et al., 2003). With respect to the large ˚Angstr ¨om exponents and corresponding small LRs, these might be related to the mixing of sea-salt and urban aerosols. According to mean radius of basic aerosol constitution of Standard Radiation Atmosphere (SRA), the effective radius of water-soluble aerosol is smaller than that
15
of soot and dust-like aerosol. We note that water-soluble aerosol is predominant over the PRD, but the particle effective radius will increase due to the manifoldness of soot and/or dust-like aerosol particles as the air parcel becomes more polluted. This im-plies that (a) the relatively lower optical depth (i.e. in clean atmosphere) is associated with small extinction-to-backscatter ratio and (b) large particles contribute more for the
20
extinction coefficient. The latter is related to the fact that continental air mass bring not only absorptive particles originating from industrial and urban centers but also dust-like particles from bare ground or remote area, as well as fine particles consisting mainly of water-soluble aerosols predominate under clean condition. In addition, the large LRs can also be explained by the deviations between the scattering characteristics of
25
ACPD
6, 3099–3133, 2006
Aerosol extinction-to-backscatter ratio by
lidar and MODIS
Q. S. He et al. Title Page Abstract Introduction Conclusions References Tables Figures J I J I Back Close
Full Screen / Esc
Printer-friendly Version Interactive Discussion
EGU
5 Conclusions
Aerosol extinction-to-backscatter ratio at 523 nm from May 2003 to June 2004 has been examined based on the extinction coefficient profile by MPL and the MODIS AOD in Hong Kong. Comparisons between the LIDAR-derived aerosol extinction coefficients near the surface and Belfort visibility sensor measured scatter coefficients are
con-5
ducted. Good agreements between the two parameters with correlation coefficient of 0.91 are noted, indicating a reasonable LR retrieval over MPL site. The prelim-inary analysis indicates that aerosol extinction-to-backscatter ratio spans the range from 12 sr to 44 sr. The average of LR is about 28.9±6.1 sr in this study which is well within the value for oceanic aerosols proposed by Ackerman (1998). Two statistical
10
tests have been employed to check the frequency distribution of the LR, and both tests confirm that frequency distribution is Gaussian.
Specifically, the temporal distribution of LR is used to link and interpret LR variations with climatic and synoptic background conditions. This study reveals an essential de-pendence of LR on the Asiatic monsoon which is the dominant circulation feature over
15
the PRD and east Asia. The lower LR value in summer is characteristic of the domi-nance of oceanic aerosols. In contrast, the larger LR value in spring and winter is asso-ciated with the contribution of local and regional industrial pollutants transported by the prevailing northerly and easterly winds over the observation site. Besides, there is a strong dependence of LRs on synoptic conditions such as wind speed and wind
direc-20
tion; larger values of LR are found to correspond well with strong easterly and northerly winds and significantly lower LR values are associated with prevailing southerly. In ad-dition, the correlation between LR and AOD together with the anti-correlation between LR and ˚Angstr ¨om exponent imply that LR can be used to link up the macroscopic and microscopic characteristics of aerosols over PRD regions.
25
Continental and anthropogenic aerosols have major impact on the LR values during spring and winter season, which play a very important role in the regional aerosols budget. The LR data obtained in this study over Hong Kong provides valuable
informa-ACPD
6, 3099–3133, 2006
Aerosol extinction-to-backscatter ratio by
lidar and MODIS
Q. S. He et al. Title Page Abstract Introduction Conclusions References Tables Figures J I J I Back Close
Full Screen / Esc
Printer-friendly Version Interactive Discussion
EGU tion for LIDAR retrieved aerosol extinction coefficient and gives an excellent chance to
further investigate the vertical distribution of aerosols. Finally, we also note that these data are also very useful as input parameters for exact radiative transfer models (RTM) over southern China.
Acknowledgements. The MODIS data are provided by the NASA’s Earth-Sun System Division,
5
archived and distributed by the Goddard Earth Sciences (GES), Data and Information Services Center (DISC) and Distributed Active Archive Center (DAAC). We would like to acknowledge the Hong Kong University of Science and Technology (HKUST) for providing the data for this study. This study is partially supported by the joint research grants from National Natural Sci-ence Foundation of China (NSFC) and Research Grant Council (RGC) of Hong Kong (Grant
10
number: N HKUST630/04), the grant from NSFC (Grant Number: 90211001, 40575001) and the grant from the National Basic Research Program (also called 973 Program, Grant Number: G1999045700) of China.
References
Ackermann, J.: The extinction-to-backscatter ratio of tropospheric aerosols: a numerical study,
15
J. Atmos. Ocean. Tech., 15, 1043–1050, 1998.
Ackermann, J., Volger, P., and Wiegner, M.: Significance of multiple scattering from tropo-spheric aerosols for ground-based backscatter, Appl. Opt., 38(24), 5195–5201, 1999. Anderson, T. L., Covert, D. S., Ahlquist, N. C., Howell, S. G., Clarke, A. D., and McNaughton, C.
S.: Variability of aerosol optical properties derived from in situ aircraft measurements during
20
ACE – Asia, J. Geophys. Res., 108(D23), 8647, doi:10.1029/2002JD003247, 2003.
Andreae, M. O. and Crutzen, P. J.: Atmospheric aerosols: Biogeochemical sources and their role in atmospheric chemistry, Science, 276, 1052–1058, 1997.
Ansmann, A., Riebesell, M., Wandinger, U., Weitkamp, C., Voss, E., Lahmann, W., and Michaelis, W.: Combined Raman elastic-backscatter lidar for vertical profiling of moisture,
25
aerosol extinction, backscatter, and lidar ratio, Appl. Phys., B55, 18–28, 1992.
Ansmann, A., Wagner, F., Althausen, D., Muller, D., Herber, A., and Wandinger, U.: European pollution outbreaks during ACE 2: Lofted aerosol plumes observed with Raman lidar at the Portuguese Coast, J. Geophys. Res., 106(D18), 20 725–20 733, 2001.
ACPD
6, 3099–3133, 2006
Aerosol extinction-to-backscatter ratio by
lidar and MODIS
Q. S. He et al. Title Page Abstract Introduction Conclusions References Tables Figures J I J I Back Close
Full Screen / Esc
Printer-friendly Version Interactive Discussion
EGU
Ansmann, A., Engelmann, R., Althausen, D., Wandinger, U., Hu, M., Zhang, Y., and He, Q.: High aerosol load over the Pearl River Delta, China, observed with Raman lidar and Sun photometer, Geophys. Res. Lett., 32(13), doi:10.1029/2005GL023094, 2005.
Cao, J. J., Lee, S. C., Ho, K. F., Zhang, X. Y., Zou, S. C., Fung, K., Chow, J. C., and Watson, J. G.: Characteristics of carbonaceous aerosol in Pearl River Delta Region, China during 2001
5
winter period, Atmos. Environ., 37(11), 1451–1460, 2003.
Chang, C. P. and Krishnamurti, T. N.: Monsoon Meteorology. Oxford Monograph on Geology and Geophysics, No. 7, Oxford Univ. Press, New York, 1987.
Charlson, R. J., Schwartz, S. E., Hales, J. M., Cess, R. D., Coakley, J. A., Hansen, J. E., and Hofmann, D. J.: Aerosols and global warming response, Science, 256(5057), 598–599,
10
1992.
Chazette, P.: The monsoon aerosol extinction properties at Goa during INDOEX as measured with lidar, J. Geophys. Res., 108(D6), doi:10.1029/2002JD002074, 2003.
Chu, D. A., Kaufman, Y. J., Ichoku, C., Remer, L. A., Tanr’e, D., and Holben, B. N.: Val-idation of MODIS aerosol optical depth retrieval over land, Geophys. Res. Lett., 29(12),
15
doi:10.1029/2001GL013205, 2002.
Collis, R. T. H. and Russell, P. B.: Lidar measurement of particles and gases by elastic backscattering and differential absorption in Laser Monitoring of the Atmosphere, edited by: Hinkley, E. D., pp. 71–152, Springler-Verlag, New York, 1976.
De Tomasi, F. and Perrone, M. R.: lidar measurements of tropospheric water vapor and aerosol
20
profiles over southeastern Italy, J. Geophys. Res., 108(D9), doi:10.1029/2002JD002781, 2003.
Di Girolamo, P., Ambrico, P. F., Amodeo, A., Boselli, A., Pappalardo, G., and Spinelli, N.: Aerosol observations by lidar in the nocturnal boundary layer, Appl. Opt., 38(21), 4585–4595, 1999. Dubovik, O., Holben, B. N., Eck, T. F., Smirnov, A., Kaufman, Y. J., King, M. D., Tanr’e, D., and
25
Slutsker, I.: Variability of absorption and optical properties of key aerosol types observed in worldwide locations, J. Atmos. Sci., 59, 590–608, 2002.
Dulac, F. and Chazette, P.: Airborne study of a multi-layer aerosol structure in the eastern Mediterranean observed with the airborne polarized lidar ALEX during a STAAARTE cam-paign (7 June 1997), Atmos. Chem. Phys., 3, 1817–1831, 2003.
30
Fernald, F. G.: Analysis of atmospheric lidar observations: Some comments, Appl. Opt., 23(5), 652–653, 1984.
measure-ACPD
6, 3099–3133, 2006
Aerosol extinction-to-backscatter ratio by
lidar and MODIS
Q. S. He et al. Title Page Abstract Introduction Conclusions References Tables Figures J I J I Back Close
Full Screen / Esc
Printer-friendly Version Interactive Discussion
EGU
ments of aerosol extinction and backscattering: 1. Methods and comparisons, J. Geophys. Res., 103(D16), 19 663–19 672, 1998.
Franke, K., Ansmann, A., Muller, D., Althausen, D., Wagner, F., and Scheele, R.: One-year observations of particle lidar ratio over the tropical Indian Ocean with Raman lidar, Geophys. Res. Lett., 28, 4559–4562, 2001.
5
Grund, C. J. and Eloranta, E. W.: The University of Wisconsin High Spectral Resolution lidar, Opt. Eng., 30, 6–12, 1991.
Intergovernmental Panel on Climate Change (IPCC): Climate Change 2001: The Science of Climate Change, Technical Summary of the Working Group I Report, Cambridge Univ. Press, New York, 2001.
10
Kaufman, Y. J., Tanr ´e, D., Remer, L. A., Vermote, E., Chu, A., and Holben, B. N.: Operational remote sensing of tropospheric aerosol over land from EOS Moderate Resolution Imaging Spectroradiometer, J. Geophys. Res., 102, 17 051–17 067, 1997.
Kaufman, Y. J. and Tanr’e, D.: Algorithm for remote sensing of tropospheric aerosol from MODIS, Algorithm Theoretical Basis Documents (ATBD-MOD-02), 85 pp., 1998.
15
Klett, J. D.: Lidar inversion with variable backscatter/extinction ratios, Appl. Opt., 24(11), 1638– 1643, 1985.
Kneizys, F. X., Shettle, E. P., Gallery, W. O., Chetwynd, J. H., Abreu, L. W., Selby, J. E. A., Clough, S. A., and Fenn, R. W.: Atmospheric transmittance/radiance: computer code Low-tran 6, Report AFGL-TR-83-0187, Air Force Geophysics Laboratory, 1983.
20
Kok, G. L., Lind, J. A., and Fang, M.: An airborne study of air quality around the Hong Kong territory, J. Geophys. Res., 102, 19 043–19 057, 1997.
Kovalev, V. A.: Sensitivity of the lidar solution to errors of the aerosol backscatter-to-extinction ratio: Influence of a monotonic change in the aerosol extinction coefficient, Appl. Opt., 34(18), 3457–3462, 1995.
25
Li, C. C.: Remote sensing of aerosol optical depth with MODIS and its application in the regional environmental air pollution studies, PhD thesis, Peking Univ., 2002.
Li, C. C., Mao, J. T., Lau, K. H., Chen, J., Yuan, Z., Liu, X., Zhu, A., and Liu, G.: Study on the characteristics of distribution and seasonal variation of aerosol optical depth in eastern China with MODIS products, Chinese Sci. Bull., 48(22), 2488–2495, 2003.
30
Lohmann, U. and Feichter, J.: Impact of sulphate aerosols on albedo and lifetime of clouds: A sensitivity study with the ECHAM4 GCM, J. Geophys. Res., 102, 13 685–13 700, 1997. Louie, P. K. K.: Seasonal characteristics and regional transport of PM2.5 in Hong Kong, Atmos.
ACPD
6, 3099–3133, 2006
Aerosol extinction-to-backscatter ratio by
lidar and MODIS
Q. S. He et al. Title Page Abstract Introduction Conclusions References Tables Figures J I J I Back Close
Full Screen / Esc
Printer-friendly Version Interactive Discussion
EGU
Environ., 39, 1695–1710, 2005.
Maletto, A., McKendry, I. G., and Strawbridge, K. B.: Profiles of particulate matter size distribu-tions using a balloonborne lightweight aerosol spectrometer in the planetary boundary layer, Atmos. Environ., 37, 661–670, 2003.
Murakami, T.: Winter monsoonal surges over East and Southeast Asia, J. Meteorol. Soc.
5
Japan, 57, 133–158, 1979.
NASA: U.S. Standard Atmosphere Supplements, U.S. Govt. Print. Off., Washington, D.C., 1976.
Phadnis, M. J. and Carmichael, G. R.: Numerical investigation of the influence of mineral dust on the tropospheric chemistry of East Asia, J. Atmos. Chem., 36, 285–323, 2000.
10
Remer, L. A., Kaufman, Y. J., Tanr’e, D., Mattoo, S., Chu, D. A., Martins, J. V., Li, R., Ichoku, C., Levy, R. C., and Kleidman, R. G.: The MODIS Aerosol Algorithm, Products, and Validation, J. Atmos. Sci., 62(4), 947–973, 2005.
Salemink, H. W. M., Schotanus, P., and Bergwerff, J. B.: Quantitative lidar at 532 nm for vertical extinction profiles and the effect of relative humidity, Appl. Phys., 34, 187–189, 1984.
15
Sasano, Y., Browell, E. V., and Ismail, S.: Error caused by using a constant extinc-tion/backscattering ratio in the lidar solution., Appl. Opt., 24, 3929–3932, 1985.
Sassen, K. and Cho, B. S.: Subvisual-thin cirrus lidar dataset for satellite verification and cli-matological research, J. Appl. Meteorol., 31, 1275–1285, 1992.
Smirnov, A., Holben, B. N., Kaufman, Y. J., Dubovik, O., Eck, T. F., Slutsker, I., Pietras, C.,
20
and Halthore, R. N.: Optical properties of atmospheric aerosol in maritime environments, J. Atmos. Sci., 59, 501–523, 2002.
Twomey, S.: Influence of pollution on the short-wave albedo of clouds, J. Atmos. Sci., 34, 1149–1152, 1977.
Waggoner, A. P., Ahlquist, N. C., and Charlson, R. J.: Measurement of the aerosol total
scatter-25
backscatter ratio, Appl. Opt., 11, 2886–2889, 1972.
Wandinger, U., Mueller, D., Boeckmann, C., Althausen, D., Matthias, V., Boesenberg, J., Weib, B., Fiebig, M., Wendisch, M., Stohl, A., and Ansmann, A.: Optical and physical character-ization of biomass burning and industrial pollution aerosols from multiwavelength lidar and aircraft measurements, J. Geophys. Res., 107, doi:10.1029/2000JD000202, 2002.
30
Welton, E. J., Voss, K. J., Gordon, H. R., Maring, H., Smirnov, A., Holben, B. N., Schmid, B., Liv-ingston, J. M., Russell, P. B., Durkee, P. A., Formenti, P., and Andreae, M. O.: Ground-based lidar measurements of aerosols during ACE-2: lidar description, results, and comparisons
ACPD
6, 3099–3133, 2006
Aerosol extinction-to-backscatter ratio by
lidar and MODIS
Q. S. He et al. Title Page Abstract Introduction Conclusions References Tables Figures J I J I Back Close
Full Screen / Esc
Printer-friendly Version Interactive Discussion
EGU
with other ground-based and airborne measurements, Tellus 52B, 636–651, 2000.
Welton, E. J., Voss, K. J., Quinn, P. K., Flatau, P., Markowicz, K., Campbell, J., Spinhirne, J. D., Gordon, H. R., and Johnson, J.: Measurements of aerosol vertical profiles and optical properties during INDOEX 1999 using micropulse lidars, J. Geophys. Res., 107(D1), 8019, doi:10.1029/2000JD000038, 2002.
5
ACPD
6, 3099–3133, 2006
Aerosol extinction-to-backscatter ratio by
lidar and MODIS
Q. S. He et al. Title Page Abstract Introduction Conclusions References Tables Figures J I J I Back Close
Full Screen / Esc
Printer-friendly Version Interactive Discussion
EGU
Table 1. Monthly number of simultaneous MPL and MODIS measurements over Hong Kong
during May 2003–June 2004.
Month Number of measurements May 2003 2 June 2003 4 July 2003 14 August 2003 5 September 2003 14 October 2003 11 November 2003 20 December 2003 15 February 2004 3 March 2004 2 April 2004 2 May 2004 3 June 2004 1
ACPD
6, 3099–3133, 2006
Aerosol extinction-to-backscatter ratio by
lidar and MODIS
Q. S. He et al. Title Page Abstract Introduction Conclusions References Tables Figures J I J I Back Close
Full Screen / Esc
Printer-friendly Version Interactive Discussion
EGU
Table 2. Statistical parameters of extinction-to-backscatter ratio observed in Hong Kong.
No. of sample skewness kurtosis µ σ significance level
lower upper lower upper
ACPD
6, 3099–3133, 2006
Aerosol extinction-to-backscatter ratio by
lidar and MODIS
Q. S. He et al. Title Page Abstract Introduction Conclusions References Tables Figures J I J I Back Close
Full Screen / Esc
Printer-friendly Version Interactive Discussion
EGU
Table 3. Statistical values of aerosol extinction-to-backscatter ratio, ˚Angstr ¨om exponent and surface extinction coefficient for different seasons.
spring summer autumn winter
Aerosol extinction-to-backscatter ratio, sr
Mean 34.4 26.4 28.3 31.1 Std. 6.9 6.4 4.8 6.0 Maximum 44 37 39 39 Minimum 25 12 19 17 Median 35 26 28 32.5 ˚
Angstr ¨om exponent
Mean 0.90 1.55 1.05 0.76
Std. 0.38 0.71 0.36 0.25
Maximum 1.63 2.99 2.19 1.31
Minimum 0.49 0.41 0.41 0.31
Median 0.87 1.53 1.03 0.72
Surface extinction coefficient, km−1
(MPL) Mean 0.32 0.13 0.35 0.42 Std. 0.13 0.09 0.15 0.18 Maximum 0.52 0.42 0.81 0.90 Minimum 0.09 0.04 0.09 0.12 Median 0.32 0.10 0.33 0.43
Surface extinction coefficient, km−1
(Visibility sensor) Mean 0.21 0.09 0.20 0.22 Std. 0.08 – 0.08 0.09 Maximum 0.33 0.09 0.41 0.50 Minimum 0.08 0.09 0.08 0.13 Median 0.21 0.09 0.20 0.21
ACPD
6, 3099–3133, 2006
Aerosol extinction-to-backscatter ratio by
lidar and MODIS
Q. S. He et al. Title Page Abstract Introduction Conclusions References Tables Figures J I J I Back Close
Full Screen / Esc
Printer-friendly Version Interactive Discussion
EGU
Table 4. Parameters of polynomial fits (y=ax2+bx+c, where y is the AOD or ˚Angstr¨om
expo-nent and x is the LR) and the corresponding correlation coefficients (R2) for both cases. AOD vs. LR Angstr ¨om exponent vs. LR˚
R2 0.90 −0.87
a −0.00034028 0.0030364
b 0.033121 −0.21657
ACPD
6, 3099–3133, 2006
Aerosol extinction-to-backscatter ratio by
lidar and MODIS
Q. S. He et al. Title Page Abstract Introduction Conclusions References Tables Figures J I J I Back Close
Full Screen / Esc
Printer-friendly Version Interactive Discussion EGU 5 10 15 20 25 30 35 40 45 0 0.1 0.2 0.3 0.4 0.5 0.6 0.7 0.8 0.9 1
Extinction to backscatter ratio (sr)
AOD
AOD derived from MODIS
ΔAOD=±0.2AOD
Retrieved LR AOD derived from lidar according to the different LR
Fig. 1. An example of LR retrieval by constraining the LIDAR AOD with MODIS AOD. The
curve is the LIDAR AOD obtained with different LR. The horizontal solid line is the MODIS AOD measurement, and the vertical line dropped at its intersection with the curve defines the best LR. The maximum error in AOD is shown by the horizontal dotted and dashed lines, and the maximum error in LR is shown by the vertical dotted and dashed line).
ACPD
6, 3099–3133, 2006
Aerosol extinction-to-backscatter ratio by
lidar and MODIS
Q. S. He et al. Title Page Abstract Introduction Conclusions References Tables Figures J I J I Back Close
Full Screen / Esc
Printer-friendly Version Interactive Discussion EGU 0 0.2 0.4 0.6 0.8 1 0 0.5 1 1.5 2 2.5 3 3.5 4 4.5 Extinction coefficient (km−1) Altitude (km) 0 0.1 0.2 0.3 0.4 0.5 0 0.5 1 1.5 2 2.5 3 3.5 4 4.5 Extinction coefficient (km−1) Altitude (km) (a) (b)
Fig. 2. The hourly averaged aerosol extinction coefficient profiles retrieved from the MPL data
(solid line with asterisk) and the visibility sensor data (circles on the x-axis):(a) at 11:00 a.m. on
1 November 2003 (LR= 36 sr and MODIS AOD = 0.87) and (b) at 01:00 p.m. on 27 November 2003 (LR= 23 sr and MODIS AOD = 0.41).
ACPD
6, 3099–3133, 2006
Aerosol extinction-to-backscatter ratio by
lidar and MODIS
Q. S. He et al. Title Page Abstract Introduction Conclusions References Tables Figures J I J I Back Close
Full Screen / Esc
Printer-friendly Version Interactive Discussion
EGU
Fig. 3. Level 2 MODIS aerosol optical depth (MOD04, version 4) at 03:20 UTC on 1 November
2003. The highly turbid air mass generated from center of Pearl River Delta transport to its sur-roundings. The MPL site (Yuen Long) is marked on the top left corner of the inner rectangular box showing Hong Kong (HK).
ACPD
6, 3099–3133, 2006
Aerosol extinction-to-backscatter ratio by
lidar and MODIS
Q. S. He et al. Title Page Abstract Introduction Conclusions References Tables Figures J I J I Back Close
Full Screen / Esc
Printer-friendly Version Interactive Discussion EGU 0 0.1 0.2 0.3 0.4 0.5 0.6 0.7 0 0.1 0.2 0.3 0.4 0.5 0.6
Extinction coefficient derived from lidar (km−1)
Scattering coefficient derived from visibility sensor (km
−1
)
1:1 line y=0.466x+0.02
Fig. 4. The inter-comparison of near-surface aerosol extinction coefficient derived from MPL
and visibility sensor. The error bars represent the standard deviation of hourly-averaged for-ward scattering coefficient.
ACPD
6, 3099–3133, 2006
Aerosol extinction-to-backscatter ratio by
lidar and MODIS
Q. S. He et al. Title Page Abstract Introduction Conclusions References Tables Figures J I J I Back Close
Full Screen / Esc
Printer-friendly Version Interactive Discussion EGU 10 20 30 40 50 0 5 10 15 20 25
Aerosol extinction to backscatter ratio (sr)
Occurring frequency (a) 10 20 30 40 50 0 0.2 0.4 0.6 0.8 1
Aerosol extinction to backscatter ratio (sr)
Cumulative frequency
(b)
Fig. 5. (a) Frequency distribution and (b) cumulative frequency distribution of aerosol
extinction-to-backscatter ratio over Hong Kong. The solid line in (a) and dashed line in (b) are Gaussian distribution fit curve according to the statistical parameters listed in Table 2.
ACPD
6, 3099–3133, 2006
Aerosol extinction-to-backscatter ratio by
lidar and MODIS
Q. S. He et al. Title Page Abstract Introduction Conclusions References Tables Figures J I J I Back Close
Full Screen / Esc
Printer-friendly Version Interactive Discussion
EGU
03/May Jun Jul Aug Sep Oct Nov Dec 04/Feb Mar Apr May Jun 0 5 10 15 20 25 30 35 40 45 50 Month
Extinction to backscatter ratio (sr)
Fig. 6. Monthly mean aerosol extinction-to-backscatter ratio at 523 nm derived from MPL and
MODIS AOD measurements in Hong Kong between May 2003 and June 2004. The error bar represents the standard deviation.
ACPD
6, 3099–3133, 2006
Aerosol extinction-to-backscatter ratio by
lidar and MODIS
Q. S. He et al. Title Page Abstract Introduction Conclusions References Tables Figures J I J I Back Close
Full Screen / Esc
Printer-friendly Version Interactive Discussion
EGU
Spring Summer Autumn Winter
0 5 10 15 20 25 30 35 40 45 Season
Extinction to backscatter ratio (sr)
Fig. 7. Seasonal mean aerosol extinction-to-backscatter ratio at 523 nm derived from MPL
together with MODIS AOD measurements in Hong Kong between May 2003 and June 2004. The error bar represents the standard deviation.
ACPD
6, 3099–3133, 2006
Aerosol extinction-to-backscatter ratio by
lidar and MODIS
Q. S. He et al. Title Page Abstract Introduction Conclusions References Tables Figures J I J I Back Close
Full Screen / Esc
Printer-friendly Version Interactive Discussion
EGU
Fig. 8. The variation of aerosol extinction-to-backscatter ratios (unit of color scale is sr) as a
ACPD
6, 3099–3133, 2006
Aerosol extinction-to-backscatter ratio by
lidar and MODIS
Q. S. He et al. Title Page Abstract Introduction Conclusions References Tables Figures J I J I Back Close
Full Screen / Esc
Printer-friendly Version Interactive Discussion EGU 10 20 30 40 50 0 0.2 0.4 0.6 0.8 1 1.2 1.4
Aerosol extinction to backscatter ratio (sr)
AOD (a) 10 20 30 40 50 0 0.5 1 1.5 2 2.5 3
Aerosol extinction to backscatter ratio (sr)
Angstrom exponent
(b)
Fig. 9. (a) Scatter plots of LR versus AOD and (b) LR versus ˚Angstr ¨om exponent. The circles and error bars represent the corresponding average values and standard deviations, respec-tively, computed at 9 equally spaced bin of LR. The dashed lines represent fitting curves by using the polynomial in Table 4.