HAL Id: insu-01665724
https://hal-insu.archives-ouvertes.fr/insu-01665724
Submitted on 16 Dec 2017
HAL is a multi-disciplinary open access
archive for the deposit and dissemination of
sci-entific research documents, whether they are
pub-lished or not. The documents may come from
teaching and research institutions in France or
abroad, or from public or private research centers.
L’archive ouverte pluridisciplinaire HAL, est
destinée au dépôt et à la diffusion de documents
scientifiques de niveau recherche, publiés ou non,
émanant des établissements d’enseignement et de
recherche français ou étrangers, des laboratoires
publics ou privés.
SPICAM observations of thermospheric airglow during
the 2007 dust storm
N. Schneider, M. Chaffin, D. Everding, François Leblanc, Jean-Yves Chaufray,
Franck Montmessin, Jean-Loup Bertaux
To cite this version:
N. Schneider, M. Chaffin, D. Everding, François Leblanc, Jean-Yves Chaufray, et al.. SPICAM
obser-vations of thermospheric airglow during the 2007 dust storm. European Planetary Science Congress
2017, Sep 2017, Riga, Latvia. pp. EPSC2017-376-1. �insu-01665724�
SPICAM observations of thermospheric airglow during the
2007 dust storm
N. Schneider (1), M. Chaffin (1), D. Everding (1), F. Leblanc (2), J. Y. Chaufray (2), F. Montmessin (2), J.-L. Bertaux (2) and the SPICAM team
(1) Laboratory for Atmospheric and Space Physics, Boulder, Colorado, USA (nick.schneider@lasp.colorado.edu), (2) LATMOS/IPSL, Guyancourt, France
Abstract
In 2007 (Mars Year 28), Mars experienced a global dust storm. Previous studies have reported large changes in the H Lyman alpha coronal airglow dur-ing this period, corresponddur-ing to a large decrease in H escape fluxes during the declining phase of the dust storm. Here we present airglow measurements of CO Cameron band and CO+
2 UV Doublet emission in the
thermosphere from 2007 data gathered by the SPI-CAM (SPectroscopy for the Investigation of the Char-acteristics of the Atmosphere of Mars) instrument on Mars Express. During the dust storm period in late 2007, lower atmospheric temperatures were enhanced, pushing the thermosphere to higher altitudes. At the same time, more intense UV heating resulting from the perihelion passage of Mars resulted in extended upper atmospheric scale heights. We compare our retrievals and techniques to previous studies, which found no en-hancement in thermospheric scale heights during this period.
1. SPICAM Observations of the
Thermosphere
The SPICAM instrument on Mars Express is an imag-ing ultraviolet spectrograph that observes in the far and mid UV from 118−320 nm (Bertaux et. al. 2006). The instrument has a focus on stellar occulations, but also performs thermospheric limb scans and nadir observa-tions. In limb mode, the instrument observes the char-acteristic airglow spectrum of Mars (Figure 1), whose most conspicuous features in the mid-UV are the CO Cameron bands (180-260 nm), and the CO+
2 UV
dou-blet (289 nm). These features reveal thermospheric properties, with the UV Doublet diagnosing the neu-tral CO2scale height and the CO Cameron bands
re-flecting a larger scale height that is a blend of thermal and nonthermal emission sources. Previous studies,
including most recently Stiepen et. al. (2015), have ex-amined the time evolution of the scale height and peak altitude of these features. Unfortunately, the need to share observing time with other Mars Express instru-ments, and difficulties in the instrument data analy-sis introduced by stray light and detector high voltage spikes often limit the useful dataset, making observa-tions sparse. As a result, these previous studies have extracted limited information about the thermosphere, particularly in the 2007 dust storm year. In addition, these previous studies found no large differences be-tween 2007 and other years, despite the presumably large influence of the dust storm. This motivates our independent study of the dataset.
Figure 1: Mid-UV airglow of Mars, adapted from Leblanc et. al. (2006).
2. Retrieving Thermospheric
Prop-erties
To extract thermospheric peak altitudes and scale heights from the dataset, we employ a multiple lin-ear regression technique. In this method, individual EPSC Abstracts
Vol. 11, EPSC2017-376-1, 2017
European Planetary Science Congress 2017 c
reduced spectra are fit by scaling input model spec-tra by linear coefficients, and summing the models to-gether. For model spectra we use a Cameron band model convolved and binned to the instrument resolu-tion (Stevens et. al. 2015), a solar spectrum extracted from nadir observations made by SPICAM, and Gaus-sians at the location of the UV Doublet and OI 297.2 nm feature. We also include a linear component to ac-count for dark subtraction offsets and large-scale stray light features.
Figure 2: (a) Example SPICAM spectrum and mul-tiple linear regression fit, showing composite fit and fitted components. (b) Retrieved altitude profile of CO Cameron band emission for a single limb scan. Each point represents the Cameron band fit component to the average SPICAM spectrum for surrounding alti-tudes.
An example fitted spectrum is shown in Figure 2a. Our method does a resonable job of reproducing the data, with offsets in the vicinity of 240 − 260 nm po-tentially caused by poor knowledge of the solar stray light at this location. Applying this technique to mul-tiple spectra from a given limb scan produces intensity altitude profiles (Figure 2b), which can then be fit to extract a peak altitude and scale height.
3. Response of the Thermosphere
in 2007
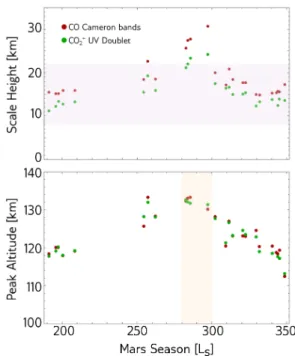
By applying our fit procedure across 2007, we produce peak altitudes and scale heights for both the Cameron bands and the CO+2 UVD, shown in Figure 3. We see an increase of the peak altitude by over 10 km, cen-tered on Southern summer solstice and declining ap-proximately linearly on either side of the peak. Scale heights are more peaked, with a linear increase from 15 km near Ls200 to 30 km near Ls300, and a steep
decline following the peak. These observations have implications for the structure and variability of the thermosphere and the upper atmospheric environment underlying the large variability in the H corona, which
we will discuss more fully in our presentation.
Figure 3: Retrieved peak altitudes and scale heights of thermospheric emissions at Mars in 2007.
References
[1] Bertaux, J.-L., Korablev, O., Perrier, S., Quémerais, E., Montmessin, F., Leblanc, F., Lebonnois, S., Rannou, P., Lefèvre, F., Forget, F., Fedorova, A., Dimarellis, E., Re-berac, A., Fonteyn, D., Chaufray, J. Y., and Guibert, S.: SPICAM on Mars Express: Observing modes and overview of UV spectrometer data and scientific results, JGR, Vol. 111, E10S90, 2006.
[2] Stiepen, A., Gérard, J.-C., Bougher, S., Montmessin, F., Hubert, B., and Bertaux, J.-L.: Mars thermospheric scale height: CO Cameron and CO+
2 dayglow
observa-tions from Mars Express, Icarus, Vol. 245, pp. 295-305, 2015.
[3] Leblanc, F., Chaufray, J. Y., Lilensten, J., Witasse, O., and Bertaux, J.-L.: Martian dayglow as seen by the SPI-CAM UV spectrograph on Mars Express, JGR, Vol. 111, E09S11, 2006.
[4] Stevens, M. H., Evans, J. S., Schneider, N. M., Stewart, A. I. F., Deighan, J., Jain, S. K., Crismani, M., Stiepen, A., Chaffin, M. S., McClintock, W. E., Holsclaw, G. M., Lefèvre, F., Lo, D. Y., Clarke, J. T., Montmessin, F., Bougher, S. W., Jakosky, B. M.: New observations of molecular nitrogen in the Martian upper atmosphere by IUVS on MAVEN, GRL, Vol. 42, pp. 9050-9056, 2015.