HAL Id: tel-01913741
https://tel.archives-ouvertes.fr/tel-01913741
Submitted on 6 Nov 2018
HAL is a multi-disciplinary open access
archive for the deposit and dissemination of sci-entific research documents, whether they are pub-lished or not. The documents may come from teaching and research institutions in France or abroad, or from public or private research centers.
L’archive ouverte pluridisciplinaire HAL, est destinée au dépôt et à la diffusion de documents scientifiques de niveau recherche, publiés ou non, émanant des établissements d’enseignement et de recherche français ou étrangers, des laboratoires publics ou privés.
Experimental investigations of the deep Earth’s mantle
melting properties
Giacomo Pesce
To cite this version:
Giacomo Pesce. Experimental investigations of the deep Earth’s mantle melting properties. Earth Sciences. Université Blaise Pascal - Clermont-Ferrand II, 2016. English. �NNT : 2016CLF22762�. �tel-01913741�
UNIVERSITÉ BLAISE PASCAL
U.F.R. Science et Technologies
ÉCOLE DOCTORALE DES SCIENCES FONDAMENTALES
Laboratoire Magmas et Volcans
THÉSE
Présentée pour obtenir le grade de
DOCTEUR D’UNIVERSITÉ
Spécialité : Pétrologie expérimentalePrésentée et soutenue publiquement le 07/12/2016 Par
Giacomo PESCE
Experimental investigations of the deep
Earth's mantle melting properties
JURY
Gaillard Fabrice Chargé de recherche – ISTO, Orléans Rapporteur
Reynard Bruno Directeur de Recherches – LGLTPE, ENS Lyon Rapporteur
Debayle Eric Directeur de Recherche – LGLTPE, ENS Lyon Examinateur
Laporte Didier Directeur de Recherche – LMV, Clermont-Fd Examinateur
Manthilake Geeth Chargé de Recherche – LMV, Clermont-Fd Examinateur
ABSTRACT
Melting processes play a key role in the Earth’s evolution. In the early stages of the Earth's formation, large amounts of heat were released from (i) gravitational energy from core-mantle segregation, (ii) radiogenic decay and (iii) collisions with large-scale impactors (such as the Moon-forming impact). This led to extensive mantle melting with eventual formation of a magma ocean. Then, chemical segregation between the different terrestrial reservoirs resulted from the complex processes of mantle crystallization. These mechanisms were primarily controlled by thermal evolution of partially molten mantle. Partial melting however may still occurs today in different mantle regions. Evidences of low velocities zones (LVZ) in the upper mantle have been reported by different seismological and magneto-telluric studies, at a depth ranging from 80 km down to the 410 km seismic discontinuity. The reduction in seismic wave velocities reported is also consistent with the occurrence of partial melting. However, this matter remains the source of a vivid debate.
The experimental studies addressing melting of mantle materials show that the present-day temperature is not sufficient to induce melting of the bulk peridotitic or pyrolitic mantle, at all depths throughout upper mantle, transition zone and lower mantle. Melting can still arise in certain conditions, i.e. (i) in presence of significant amounts of volatile elements, such as water or CO2, because it can decrease the melting temperature of silicate rocks by hundreds of
degrees or (ii) for significant compositional changes, e.g. when the oceanic crust is subducted in the mantle.
In this study, we performed melting experiment on a homogeneous glass with chondritic composition, a proxy for the primitive Earth’s mantle after core segregation. We performed in situ synchrotron X-ray diffraction and in situ impedance spectroscopy measurements to detect the onset of melting during the experiments in a multi anvil apparatus, at pressures up to 25 GPa, in order to determine the solidus temperature of the primitive upper mantle. Our results show that previous studies overestimated the solidus by approximately 250 K. The implication for a lower solidus are manifold. Firstly, partial melting could take place in the mantle today at lower temperatures than previously believed, especially when volatile elements such as H are present. The variation of the solidus temperature as a function of water content was therefore calculated using the cryoscopic relation reported in previous studies. Our results show that 500-600 ppm of water are required to depress the solidus temperature enough to cross the mantle geotherm at depths in which LVL are observed, which is compatible with the reported maximum water storage capability of the upper mantle.
Another major implication concerns the early state of the upper mantle. Mantle temperatures 200-300 K higher than today, as suggested from the composition of ancient non-arc basalts and komatiites, would induce partial melting at depths from ~200 to ~400 km. Thus, a shell of partially molten material could have persisted in the upper mantle for long geological times. Such weak layer could have decoupled the convection in upper and lower part of the mantle, possibly disabling the establishment of modern tectonic during the Archean. Then, upon secular mantle cooling, the final mantle crystallization at mid upper-mantle depths would have drastically modified the mantle dynamics, inducing global mantle convection.
In this work, the melting properties of the basaltic crust subducted in the lower mantle is also presented. Subduction of the oceanic lithosphere is thought to be a major responsible for mantle heterogeneities. At shallow depths, slabs undergo dehydration, which induces partial melting of the mantle wedge and arc magmatism. Still, the layered structure of the slab, formed by a ~2 km thick layer of MORB (mid-ocean ridge basalt) sitting on a depleted harzburgitic residue, can penetrate deep into the mantle, as evidenced by seismic tomography. The reason is that the enriched MORB material is denser than the surrounding mantle because of its higher Fe-content and its lower temperature. Injection of colder, denser and chemically different material in the deep lower mantle should affect its physical properties. By itself, it could affect the geophysical observables (e.g. seismic velocities, electrical and thermal conductivities) sufficiently to be detected from the Earth's surface. However, interpretations of the seismic signature remain controversial. In particular, seismic anomalies in compressional and shear velocities suggest the presence of some melt in the so-called ultra-low velocity zones (ULVZ) located just above the core-mantle boundary. We therefore explored MORB melting properties using in situ synchrotron X-ray diffraction in a laser-heated diamond anvil cell (LH-DAC), at pressures up to the 135 GPa found at the CMB. We observed an increase in the solidus temperature from about 2100(150) K to 3200(150) K at pressures from 20 to 80 GPa, respectively. At 80 GPa, which corresponds to a mantle depth of 1900 km, the MORB solidus is identical to that of a chondritic-type mantle. With further increase in pressure to 135 GPa, however, the MORB solidus temperature increases to 3800 K, while that of the mean mantle increases to 4150 K. The flattening of the MORB solidus could be linked to a change in liquid composition with pressure. Indeed, our data show a significant increase of the SiO2 content in
the melt with increasing pressure. We thus expect that the subducted basaltic slab should will undergo partial melting when reaching the lowermost mantle, producing a SiO2-rich liquid that
will eventually percolates and diffuses out of the slab into the lower mantle. Such liquid would react with the surrounding MgO-rich environment, producing bridgmanite (the major phase of the lower mantle) and thus favouring the "recycling" of the SiO2-excess present subducted
RÉSUMÉ
Les processus de fusion ont joué un rôle clé dans l'évolution de la Terre. Au cours des premiers stades de la formation de la Terre, de grandes quantités de chaleur ont été libérées par (i) l'énergie gravitationnelle lors de la ségrégation noyau-manteau, (ii) la désintégration radioactive et (iii) les collisions entre corps orbitant autour du Soleil (en incluant l'impact géant qui a formé la Lune). Tous ces évènements ont conduit à la fusion du manteau et à des épisodes d'océan magmatique. Ensuite, les processus complexes de cristallisation du manteau ont conduit à la ségrégation chimique entre les différents réservoirs terrestres. Ces phénomènes ont été contrôlés par les propriétés de fusion des matériaux qui constituent le manteau.
La fusion partielle se produit encore aujourd'hui dans les différentes régions du manteau. Comme preuves, des zones de vitesses sismiques faibles (LVZ) ont été rapportées dans le manteau supérieur, pour des profondeurs allant de 80 jusqu'à 410 km, grâce à différentes études sismologiques et magnétotelluriques. La diminution de vitesse des ondes sismiques est compatible avec la fusion partielle du manteau. Toutefois, cette question reste la source de vifs débats. Les études expérimentales portant sur la fusion des matériaux du manteau montrent en effet que la température actuelle du manteau est insuffisante pour provoquer la fusion du manteau péridotitique (ou pyrolitique) dans le manteau supérieur. La fusion peut seulement se produire dans certaines conditions, à savoir (i) en présence d'une quantité importante d'éléments volatils, tels que l'eau ou le CO2, car ces éléments diminuent significativement la
température de fusion, ou (ii) pour des changements importants de composition chimique, par exemple pour de la croûte océanique subduite dans le manteau.
Dans une première partie de cette étude, nous avons effectué des expériences de fusion sur un verre homogène, de composition chondritique, comme analogue du manteau de la Terre primitive après la ségrégation du noyau. Nous avons effectué des études in situ de diffraction de rayons X et de spectroscopie d'impédance pour détecter les premiers stades de fusion. À l'aide d'une presse à multi-enclumes, nous avons reproduit des pressions jusqu'à 25 GPa en vue de déterminer la température de solidus du manteau supérieur primitif. Nos résultats suggèrent que les études précédentes qui utilisaient la méthode de la trempe ont surestimé le solidus d'environ 250 K. Les implications sont multiples. Tout d'abord, cela suggère que la fusion partielle pourrait avoir lieu plus facilement dans le manteau actuel qu'on ne le pensait initialement, en particulier lorsque des éléments volatils, tels que H, sont présents. Nous avons calculé l'effet de l'eau sur la température de solidus en fonction de la teneur en eau, en utilisant la relation cryoscopique. Nos résultats montrent que 500-600 ppm d'eau sont suffisantes pour abaisser la température de solidus jusqu'à la température actuelle du manteau. La présence d'eau dans le manteau pourrait donc expliquer les LVZ observées sismiquement.
Une autre implication majeure concerne l'état du manteau supérieur au cours de l'Archéen. Des températures mantelliques 200 à 300 K plus élevées qu'aujourd'hui, comme le suggère la composition d'anciens basaltes et de komatiites, induiraient la fusion partielle à des profondeurs d’environ 200 à 400 km. Ainsi, une couche de matériau partiellement fondu pourrait avoir persistée pendant de longues périodes géologiques au milieu du manteau supérieur. Cette couche aurait entraîné le découplage dynamique entre les parties supérieure et
inférieure du manteau, pour éventuellement inhiber la convection globale du manteau. Ensuite, avec le refroidissement séculaire, la disparition de cette zone partiellement fondue aurait pu induire, il y a environ 2.5 milliards d'années, une convection globale et la tectonique des plaques telle que nous l'observons aujourd'hui.
Un autre chapitre de cette thèse traite des propriétés de fusion de la croûte basaltique qui est subduite dans le manteau profond. Le devenir des plaques subduites reste méconnu, bien qu'elles puissent être responsables d'hétérogénéités dans le manteau. À de faibles profondeurs, la plaque subit la déshydratation, ce qui induit la fusion partielle du coin mantellique, et la mise en place du magmatisme d'arc. Pourtant, la structure en couches de la croute océanique, formée de basalte sur une épaisseur d'environ 2 km assis sur un résidu harzburgitique appauvri, peut pénétrer profondément dans le manteau, comme en témoigne la tomographie sismique. En effet, le basalte enrichi en fer est plus dense que le manteau qui l'entoure. L'injection dans le manteau profond de matière plus dense et chimiquement différente peut affecter les propriétés physico-chimiques de façon suffisamment importantes pour produire des hétérogénéités détectables par les méthodes géophysiques (vitesses sismiques, conductivités électriques, etc.). Toutefois, la signature des matériaux subduits n’est pas omniprésente et les interprétations demeurent controversées. Dans la couche D", située juste au-dessus de la frontière noyau-manteau, les mesures sismiques subissent indiquent une forte diminution des vitesses de cisaillement (ULVZ), ce qui a été interprété comme de la fusion partielle. La fusion partielle du manteau pyrolitique ne parvient pas à expliquer ces anomalies sismiques. Nous avons donc exploré les propriétés de fusion du basalte jusqu'à la pression de 135 GPa régnant à la CMB, en utilisant la diffraction X, dans une cellule à enclumes de diamant chauffée à l'aide d'un laser infrarouge. Nous avons observé l'augmentation progressive de la température de fusion au solidus, d'environ 2100 K à 3200 K, pour des pressions de 20 à 80 GPa. A la pression de 80 GPa, qui correspond à une profondeur de 1900 km dans le manteau, le solidus du basalte est similaire à celui du manteau moyen. Cependant, pour des pressions jusqu'à 135 GPa, la température de fusion du basalte augmente jusqu'à 3800 K, alors que celle du manteau augmente jusqu'à 4150 K. La fusion du basalte se produit donc à des températures inférieures, un effet qui pourrait être lié à un changement de la composition chimique du liquide avec la pression. Nos données montrent en effet une augmentation significative de la teneur en SiO2 dans le liquide avec l'augmentation de la pression. La plaque basaltique subduite pourrait
donc subir la fusion partielle dans le manteau inférieur et générer un liquide riche en SiO2. Ce
liquide finirait par percoler et réagir avec le matériau riche en MgO qui compose le manteau moyen. Ce phénomène pourrait faciliter le "recyclage" de basalte subducté par réaction chimique, et donc conduire à une ré-homogénéisation du manteau.
1. INTRODUCTION
...11.1. CI Chondrite: a primitive Earth proxy...2
1.2. Structure of the Earth...4
1.3. Mantle Heterogeneities...7
1.3.1. Seismic anomalies in the upper mantle...7
a. Melting curves of the upper mantle/transition zone...9
b. Effect of volatiles on melting curves...10
c. Melting in the early Earth’s mantle...12
d. Aim of this study...13
1.3.2. Ultra-low velocity zones at the CMB...14
2.
METHODS...172.1. Sample preparation...18
2.2. Multi Anvil Experiments...22
2.2.1. Electrical conductivity experiments...23
a. High-pressure assembly...23
b. Temperature gradient...24
c. In situ impedance spectroscopy method...25
d. Electrical conductivity measurements...27
2.2.2. Synchrotron X-ray diffraction experiments...30
a. High-pressure assembly used for X-ray diffraction...31
b. X-ray diffraction method...32
c. Crystallization in subsolidus conditions...33
2.3. Diamond anvil cell (DAC)...34
2.3.1. High temperature in the DAC...39
2.3.2. In situ synchrotron X-Ray diffraction...40
2.4. Analytical techniques...41
2.4.1. Scanning Electron Microscopy...41
a. Textural and semi-quantitative analysis...42
2.4.2. Determination of the water contents...44
3. RESULTS
...473.1. Implications of a low solidus melting-temperature for the history of the Earth’s upper mantle...48
3.1.1. Electrical conductivity measurements...48
3.1.2. X-ray diffraction measurements...51
3.1.3. The revisited solidus temperature: comparison with previous studies...52
3.1.4. Determination of the degree of partial melting in previous experiments...54
3.1.5. Implications for the presence of water in the upper mantle today ...56
3.1.6. Implications for state and dynamics of the early upper mantle...58
3.1.7. Implications for Magma Ocean crystallization...61
3.2. Melting of subducted basalt at the core-mantle boundary (CMB)...65
4. CONCLUSIONS
...841
2 The most widely recognised theory for the formation of the terrestrial planets in the early solar system states that planetary accretion takes place in three main stages, (i) the settling of a disk of dust and gas spinning around a young sun. This process takes place over timescales of thousands of years, in which the condensation of materials allow the (ii) merging of dust grains into km-size planetesimals. This leads to gravitational instabilities in different zones of the disk and runaway of the planetary embryos, triggering (iii) catastrophic collisions of planetesimals, resulting in the growth of larger planets. The energy released by such collisions would have been sufficient not only to raise the temperature of a proto-planet by thousands of degrees, but also most likely enough to create large molten pond across its surface. In the case of the Earth, it is crucial to highlight that such extensive melting events played a major role not only in the initial stages of accretion and differentiation of the planet, but also in the setting up the foundations to the mechanisms controlling the Earth’s dynamics today. In the following paragraphs, therefore, we will investigate the melting processes that dominated the Earth’s evolution, from its early stages to the present day.
1.1. CI Chondrite: a primitive Earth proxy
Our sun contains 99.9% of the mass of the solar system, and by analysing its chemical composition, we are able to infer the composition of circumsolar disk in the cooling nebula from which the planet embryos accreted. Yet, the composition of the planets today is widely heterogeneous, due to the mechanisms that segregated different elements in the early stages of planetary accretion. In order to investigate the processes that took place in the primitive Earth, we need to find a suitable composition. Meteorites offer us the opportunity to extend both of these dimensions. Meteorites are conventionally classified into three main groups, according to their structure, chemical and isotopic composition and mineralogy, namely (i) stony meteorites, mainly composed of silicate minerals, (ii) iron meteorites, largely composed of metallic alloys, and (iii) stony-iron meteorites that contain large amounts of both metallic and rocky material. Stony meteorites are then traditionally divided into two other categories, achondrites (meteorites that have been differentiated and chondrites. The formers represent meteorites originating from planetary bodies that have experience differentiation. Chondrites on the other hand are undifferentiated chemically primitive meteorites, having compositions (volatile elements excluded) very similar to that of the sun. Most chondrites in fact contain refractory inclusion enriched in elements such as Ca and Al (thus, calcium-aluminium
3 inclusions, or CAIs). These inclusions are the first, and therefore the oldest, object to condense from the nebular disk, and isotopic analysis have dated the oldest CAIs in chondrites at ~4.56 Ga (Amelin et al., 2002). Chondrites are divided in three main groups.
(i) Ordinary chondrites are more abundant than all other types of meteorites. They are chemically similar but differ in their contents of iron and other siderophile, and in the ratio of oxidized to metallic iron. Along with olivine, feldspar and diopside, common mineralogy of ordinary chondrite include Cr- and Ti-rich iron oxides, along with iron sulphides.
(ii) Enstatite chondrites take their name from their main mineralogy, i.e. enstatite (MgSiO3). In these meteorites, iron is mostly found in its metallic form or in sulphides. They are in fact the most chemically reduced type of chondrite. A recent study proposes that enstatite chondrites could in fact represent the material from which the proto-Earth had formed, due to the mostly identical isotopic composition between E-chondrites and Earth (Boujibar et al., 2015). The authors report that the difference in Si/Mg ratio could be in fact due to collisional erosion of the early Earth proto-crust.
(iii) Carbonaceous chondrites are the most primitive and volatile-rich kind of chondrite. The high concentration of volatiles (such as water and organic compounds) in the majority of carbonaceous chondrites may suggest that since their formation such meteorites must not have be affected by high temperatures.
Classification of carbonaceous chondrites based on their compositions reflects the type of parent body from which they originated. Among carbonaceous chondrites, CI chondrites distinguish themselves for the absence of chondrules, as well as for having a chemical composition closely matching that of the Sun, with the exception of the most volatile elements. In particular, the concentration of oxygen, magnesium, silicon and iron in chondrites matches on a first approximation the proportion found in the Earth.
In the last years, however, several studies have attempted to solve a long lasting dispute on whether our planet share a common origin as chondrites. While comparing Earth’s composition with that of the Sun or CI chondrites, in fact, one can notice few differences. First, the primitive Earth mantle, also referred to as bulk silicate Earth (BSE), is depleted of volatile and siderophile elements. The latter, even if they are refractory, are most likely depleted due to partitioning into the Earth’s core. Moreover, Si/Mg ratio of the BSE is lower than is found
4 in chondrites. Several theories have been proposed to explain this, such as partitioning of Si into the core (Gessmann et al., 2001; Takafuji et al., 2005), or that the proto Earth did not accrete from the same material as chondrites (Drake and Righter, 2002).
Another issue revolves around the difference in the isotopic composition of the Earth compared to the solar ratio inferred from chondrites. Several studies have in fact observed that 142Nd/144Nd ratio measured for the Earth does not match the chondritic values, which conflicts with the idea that the BSE composition is chondritic (Boyet and Carlson, 2005; Campbell and O'Neill, 2012; Caro et al., 2008). The formation of a layer rich in incompatible elements and depleted in 142Nd at a specific point in the Earth’s early history has been proposed in order to explain this discrepancy. The presence of such layer in the deep Earth, however, does not reconcile with the heat transport from mantle plumes, hence alluding to the possibility that such layer could have been lost into space through collisional erosion. In both cases, a “missing” reservoir is needed to justify the chondritic origin of the Earth. In their recent work, however, (Burkhardt et al., 2016) disproven the need for such reservoir to explain the difference in radiogenic 142Nd between BSE and chondrites. In their study, an enrichment in neodymium in the Earth’s parental bodies through the process of nucleosynthesis is advocated as responsible for the discrepancy in 142Nd/144Nd ratios. Corrections for such process leads to a virtually identical ratio between BSE and chondrites, hence refuting the models from previous studies, and concluding that chondrites are indeed a suitable proxy for the Earth’s composition.
We can therefore conclude that CI chondrites are most likely the best candidate to represent the undifferentiated protoplanetary material, reproduce the volatile depleted primordial composition of the terrestrial planets, in particular that of the primitive Earth.
1.2. Structure of the Earth
Uncovering the hidden mechanisms that control the Earth has been the main goal for geoscientists over the centuries. Even though we are unable to directly observe the mantle’s mineralogy, information about the composition of the upper half of the mantle can be obtained from different sources. Peridotite, for example, is an ultramafic rock composed primarily by olivine (Ol), clino- and ortho-pyroxenes (Cpx, Opx), and garnet (Grt), that is carried to the surface as mantle xenoliths by the rising magmas, and it is the upper mantle’s major constituent. Similarly, evidences of high pressure minerals similar to those present in the Earth’s deep mantle can be found in meteorites, which are produced by shock-metamorphism due to the
5 high-velocity impact. Geological samples from the Earth’s interior, however, are limited to just few hundreds kilometer in depth, which, compared to the whole extent of the Earth’s interior, does not allow us to have a clear view of what is the mineralogy and the structure of the Earth up to its very core.
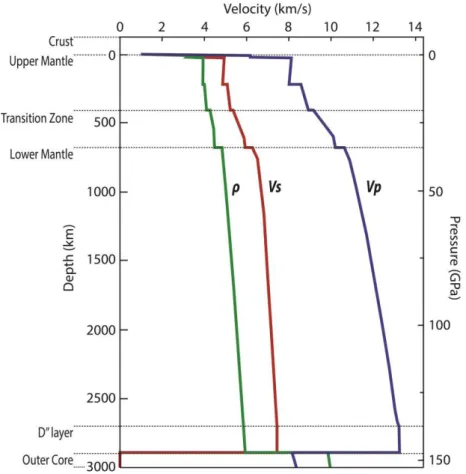
Figure 1.1. Preliminary Reference Earth Model (PREM).
A first Earth’s interior subdivision, however, can be obtained from seismological and geophysical analysis (Jeffreys and Bullen, 1940). Such data have not only improved our knowledge of the Earth’s structure, but they have also provided several fundamental information about the composition, the mineralogy and the elastic and dynamics properties of Earth’s materials.At the planetary scale, the most important information we can obtain on the Earth’s interior comes in fact from the measurement of seismic waves velocities. Seismic waves originating from earthquakes, would pass through the innermost parts of the Earth, refracting when encountering seismic discontinuities, and they would be recorded by seismograms at different locations around the globe. By analysing the seismograms, one can obtain major information on the Earth’s geophysical properties, such as the location of seismic boundaries and different heterogeneities within the Earth. From the measured velocities of
6 compressional (primary, P) and shear (secondary, S-) waves through a media, we can in fact derive the density (ρ), and bulk (Ks) and shear (μ) moduli can also be inferred from P- and S-waves, respectively, using:
𝑉𝑝= √
𝐾𝑠+43 𝜇 𝜌 and
𝑉𝑠 = √𝜇𝜌
From the analysis of the seismic waves velocities through the Earth, we can observe a number of discontinuity in the waves propagation, representing sharp changes in physical properties with depth. Many discontinuities in fact occur at conditions that correspond closely to the pressure and temperature of phase transformations known from experimental studies. Phase transformations also depend on composition, which means that seismic discontinuities can also constrain information on the chemistry of the mantle. Figure 1.1 shows one of the models describing the variation of seismic waves velocities, also known as PREM, Preliminary Reference Earth Model (Dziewonski and Anderson, 1981).
Some of the discontinuities observed from seismic analysis allow us to divide the Earth’s mantle in three main domains, i.e. upper mantle, transition zone, and lower mantle (figure 1.2). The first sharp change in velocity gradient at 410 km corresponds to the phase transition of olivine (Mg,Fe)2SiO4, the most important paragenesis of the upper mantle (56-60% of its total mass) into wadsleyite (β-olivine). Wadsleyite would then transform into ringwoodite (γ-olivine) at 520 km, marking a smaller seismic boundary within the transition zone. The most important phase transition in the mantle is likely the one responsible for the seismic discontinuity observed at around 660 km. At such depth, ringwoodite decomposes into ferropericlase (Mg,Fe)O and bridgmanite, Al-(Mg,Fe)SiO3. The most significant seismic anomaly in the lower mantle is the one defining the so-called D” layer (Kellogg et al., 1999). This ~200 km thick layer located above the boundary can be attributed to the phase transition from bridgmanite to post-perovskite, its high pressure polymorph (Murakami et al., 2004).
7
Figure 1.2. Earth’s mantle mineralogy (modified from (Frost, 2008)).
1.3. Mantle Heterogeneities
1.3.1. Seismic anomalies in the upper mantle
Over the years, numerous studies have explored the nature of anomalies in the upper mantle (e.g. (Romanowicz, 1995a)). Seismic and magneto-telluric profiles of the oceans and continental regions present prominent anomalies, in particular at depths between 80 and 250
8 km, corresponding to a decrease of about 3–6% in S-wave velocity. This low-velocity zone (LVZ)occurs close to the boundary between the lithosphere and the asthenosphere in the upper mantle, with both depth and thickness varying from one tectonic environment to another. The presence of partial melting has since long been advocated as the main theory to explain the observations of such zones in the upper mantle (Anderson and Sammis, 1970; Lambert and Wyllie, 1970; Sato et al., 1989; Solomon, 1972; Thybo, 2006). At these depths, in fact, melts have been shown to be thermodynamically stable, due to the depression of the solidus temperature by the presence of fluids and volatiles (Hirschmann, 2010).
Recently, localized seismic and electrical anomalies have also been reported atop the 410-km mantle discontinuity (e.g. (Revenaugh and Sipkin, 1994; Song et al., 2004; Vinnik and Farra, 2007)), at different areas around the globe (e.g. Asia, north America, pacific and Africa). Recent seismological studies have shown that such low velocity layer (LVL) is actually not limited in specific isolated locations (Tauzin et al., 2010), but it can in fact be found globally atop the 410 km discontinuity, with thicknesses ranging from few tens of km to 200 km. The nature of the LVL is however still unclear. Lateral variations of the LVL thickness are in fact difficult to resolve as caused by a temperature variation, nor by variations in thickness of the transition zone boundary. On the other hand, several studies have concluded that the presence of partial melt is most likely responsible for the low-velocity layer (Kawakatsu et al., 2009; Mierdel et al., 2007; Tan and Helmberger, 2007), as thermochemical effect alone cannot explain the magnitude of the anomalies. (Bercovici and Karato, 2003a) in fact proposed that LVL may be caused by dehydration-induced melting, caused by upwelling mantle material (pushed up by the cold subducting slab) from the high-water-solubility transition zone into the low-water-solubility upper mantle. (Mierdel et al., 2007) presented experimental evidence that water storage capacity could have a minimum at depths corresponding to the seismically observed low velocity layer, concluding that water content in peridotite could indeed depress the solidus temperature enough to cross the geotherm, producing low degree of partial melting. Alternative mechanisms based on solid-state processes, such as anelastic relaxation or hydrogen diffusion (Karato, 2014; Priestley and McKenzie, 2013; Stixrude and Lithgow-Bertelloni, 2005) have been alternatively proposed. However, the recent finding of young (< 10 Ma) alkali basalt on the 135 million-year-old Pacific Plate (Hirano et al., 2006) provides strong physical evidences for partial melting in the asthenosphere.
Despite the great number of studies investigating the partial melting origin of the LVL, several major factors remain unconstrained. Namely, despite the fact pressures are well constrained at all mantle depths based on the density profile provided by seismology, our
9 knowledge on the mantle’s temperature profile remains imprecise. Anchor points are provided by phase transformations in the major mantle minerals, which are responsible for the seismic discontinuities between 410 and 660 km depths. It yields a potential temperature (Tp) of ~1600 K, which corresponds to the extrapolation to the Earth's surface of the adiabatic temperature profile going through these anchor points (Katsura et al., 2010). Altogether, it happens that the mantle geotherm plots at significantly lower temperatures compared to the melting curve of the peridotitic mantle determined experimentally (see fire 1.3). Noticeable exceptions exist, for example at mantle ridges, where the uprising of hot mantle material can eventually melt when pressure is released at the approach of the Earth's surface. Nevertheless, if partial melting would indeed occur at mid upper mantle depths, volatile elements should be present to significantly lower the mantle solidus (e.g. (Hirschmann et al., 1999)).
a. Melting curves of the upper mantle/transition zone
Measuring the melting curves of the mantle is therefore a crucial step in understanding the nature of seismic discontinuities in the upper mantle. Several studies have pursued the task of experimentally determine the solidus of different mantle materials, in order to clarify whether melting is possible in upper mantle regions were seismic anomalies were recorded, particularly for the LVL (Figure 1.3). (Herzberg and Zhang, 1996; Zhang and Herzberg, 1994) performed melting experiments on anhydrous mantle peridotite KLB-1 at pressures between 5 and 23 GPa, using a large volume apparatus. Their results show that melting could occur in an anhydrous upper mantle only for mantle temperatures hotter than those of the present-day. The comparison between different studies on natural peridotites at both low (Hirschmann, 2000; Walter, 1998) and high pressures (Tronnes and Frost, 2002), with the present day geotherm (Katsura et al., 2010) also showed that melting of dry mantle material is unlikely to take place in the upper mantle today. The same kind of result was found for synthetic CMAS-pyrolite under anhydrous conditions, up to 25 GPa (Litasov and Ohtani, 2002). In their study, however, the authors also performed melting experiments on the same sample under hydrous conditions (2% H2O). They observed a significant depression of the solidus temperature in hydrous experiments, concluding that dehydration melting of rising wet material from the transition zone up to the base of the upper mantle could in fact be possible.
10
Figure 1.3. Solidus curves of different mantle materials compared to the present day mantle adiabat.
ZH94-HZ96: (Herzberg and Zhang, 1996; Zhang and Herzberg, 1994); W-98: (Walter, 1998); H-00: (Hirschmann, 2000); LO-02: (Litasov and Ohtani, 2002); TF-02:(Tronnes and Frost, 2002); K-10: (Katsura et al., 2010).
b. Effect of volatiles on melting curves
The results of (Litasov and Ohtani, 2002) showed that hydrous conditions influences the solidus of the mantle. In their study, however, the amount of water required to justify the presence of partial melt at the depths in which the LVL are reported is significantly greater than the maximum water storage capacity of the mantle, reported to be not greater than 1000 ppm at such conditions (Ferot and Bolfan-Casanova, 2012). Their results, however, opened a question that is crucial in solving the question around the partial melting-nature of the LVL. How much do volatiles (such as water and/or CO2) influences the melting temperature of the mantle?
The presence of carbon in the mantle is apparent not only form the occurrence of carbonate in mantle xenoliths, but also from the existence of ultra-deep diamonds (Pearson et al., 2014). Experimental studies on melting of carbonated periodotites below 20 GPa (Figure 1.4), have clearly shown that the presence of CO2 has a quite drastic effect on the solidus temperature of the mantle (Dasgupta and Hirschmann, 2010; Litasov and Ohtani, 2009; Litasov et al., 2014). The presence of carbonated melt may therefore generate seismic low-velocity zones in the upper mantle (Dasgupta and Hirschmann, 2006). Such conclusions are supported
11 by electrical conductivity measurements of carbonated melts, which show that the high conductivity observed in the oceanic asthenosphere could be explained by a small degree of carbonated partial melt (Gaillard et al., 2008). Carbonated fluids, however, might not be ubiquitously distributed in the upper mantle, in contrast with the observations of a global distribution of the LVL.
Figure 1.4. Comparison between different mantle solidi for “dry” peridotite (H-00, (Hirschmann, 2000)) and
other reports with presence of volatile elements in the experimental charges, in relation to the mantle adiabat (K-10, (Katsura et al., 2010)). Nominally anhydrous carbonated peridotite (DH-10: C-Peridotite (Dasgupta and Hirschmann, 2010)); Pyrolite with 2wt.% H2O (L-02: H-Pyrolite (Litasov and Ohtani, 2002)); Peridotite with a reduced C-O-H fluid (L-14: reduced-C-H-Peridotite(Litasov et al., 2014)). Dashed grey lines represent the phase
transitions between olivine (ol), wadsleyite (wd), and ringwoodite (rw), including depth intervals for the progressive transitions. The purple shadow region corresponds to mantle depths where seismic anomalies have
12 Water, on the other hand, is well known to be more abundant in the upper mantle than carbon, and since H can be stored as a defect in nominally anhydrous minerals (Ferot and Bolfan-Casanova, 2012), water can easily be present in anomalously high amount in parts of the mantle that are otherwise considered dry. Several studies have investigated the effect of water on the melting properties of the mantle (Green et al., 2014; Novella and Frost, 2014). The concentration of water in the mantle necessary to depress the solidus temperature enough to cross the mantle geotherm and cause a sufficient amount of melt to explain the seismic observations at the LVZ, however, has still not been successfully defined. A number of studies have tried to use a so-called “cryoscopic relation” (see Methods) based on experimental determination of water solubility in silicate melts to model the depression of the solidus in the mantle (Aubaud et al., 2004; Hirschmann et al., 1999), but the lack of experimental data available for partitioning coefficient limit the suitability of such model beyond the transition zone.
c. Melting in the early Earth’s mantle
Within the first 100 million years of the Earth's history, the giant Moon forming impact (MFI) melted Earth almost entirely (Nakajima and Stevenson, 2015). Release of energy induced by gravitational segregation of the impactor’s core could have potentially heated the Earth’s core by 3500–4000 K above the temperature reached prior to giant impact (Herzberg et al., 2010; Nakajima and Stevenson, 2015; Rubie et al., 2015). It could have led to a CMB temperature on the order of 6000 K (Davies et al., 2015; Labrosse, 2015; Nakagawa and Tackley, 2010), which is well above the mantle solidus of ~4150 K. Therefore, MFI could have caused intensive melting at all mantle depths. There are geochemical evidences, however, that the accretion processes and MFI did not induce complete chemical homogenization of the Earth’s mantle. For example, excesses in 182W (produced by the decay of 182Hf) measured in 2.7 Ga-old komatiites require a large-scale magmatic differentiation during the first 30 Ma of the Solar system’s history (Touboul et al., 2012). Same conclusion arises for the difference in Xenon isotopic composition between MORBs and the Iceland plume (Mukhopadhyay, 2012). Geodynamical arguments also suggest presence of an unmixed and primordial material in the deep mantle (Davaille, 1999; Kellogg et al., 1999). Therefore, it is unlikely that the primordial mantle temperatures were above liquidus at all mantle depths. Low viscosity of magma-ocean is expected to induce vigorous and turbulent convective flows, which favour a homogeneous mixing. In the meantime, heat flux at the magma ocean surface could have been as high as ~106 W/m2, which suggests its crystallization within ~103 years after MFI (Solomatov, 2007).
13 Longer time scale are also possible, due to eventual formation of an opaque atmosphere at the Earth's surface or other geodynamical complications, such as physical or chemical mantle layering, etc. (Hamano et al., 2013; Lebrun et al., 2013; Sleep et al., 2014; Zahnle et al., 1988). On the other hand, petrological analyses of Archean and Proterozoic basalts preserved at Earth's surface show primary magma compositions compatible with Tp only 200-300 K greater than today (Herzberg et al., 2010). A similar temperature change is reported between Archean tonalite-trondhjemite-granodiorite associations of 4.0 to 2.5 Ga old (Martin and Moyen, 2002). This modest increase of mantle temperature compared to the present situation suggests a relatively rapid mantle cooling just after the MFI. In the lowermost mantle, it has been suggested that a basal magma ocean (BMO) could have lasted for very long times, billions of years, in correlation with an outer-core temperature significantly higher than the mantle solidus (e.g. (Labrosse, 2015)). This issue remains largely opened, however, because geodynamical models do not explain what could prevent such a hot core from rapid cooling (Monteux et al., 2016; Nakagawa and Tackley, 2010). We note that the gravitational descent of mantle melts to the CMB could have facilitated the persistence of a BMO (Nomura et al., 2011). Such layer may still be present at the base of the mantle, thus explaining the seismological anomalies called ultra-low velocity zones (ULVZ) detectable today by seismic observations (see chapter below).
d. Aim of this study
Previous experimental studies addressing the melting of the upper mantle report solidus temperatures much higher than the present-day temperature profile (e.g. (Katsura et al., 2010; Litasov and Ohtani, 2002)). Thus, the dry peridotitic or pyrolitic mantle compositions should not encounter melting in the upper mantle. Melting could still take place in the mantle if certain conditions are fulfilled, i.e. (i) presence of significant amounts of volatile elements, such as water or CO2, because it decreases the melting temperature of silicate rocks by hundreds of degrees 3 or (ii) for significant compositional changes, e.g. when the oceanic crust is subducted in the mantle (e.g. (Andrault et al., 2014; Martin et al., 2014)). However, the lack of precision concerning the previous experimental determination of the solidus temperature at the upper mantle conditions may affect our understanding of the melting behaviour. Previous studies, in fact, used the so-called “quench method”. This technique based on the analyses of recovered samples, where the first low-degree of partial melting could be difficult to detect due to fast sample recrystallization upon cooling (e.g. (Laporte et al., 2004)). This could lead to an over-estimation of the solidus temperatures.
14 In this part of my PhD thesis, we will determine the mantle solidus temperature with two independent in situ techniques, X-ray diffraction and electrical conductivity measurements, at pressures and temperatures up to ~25 GPa and ~2500 K using multi anvil apparatus. These in situ techniques are sensitive to the presence of small amount of melt in the sample and they allow monitoring the sample behaviour at wide temperature range.
Our newly measured solidus will be compared to the temperature profile of the upper mantle, and we will discuss the implications the presence of water in the upper mantle. Using the cryoscopic relation ((Hirschmann et al., 1999), see Methods), in fact, we will determine the amount of water necessary to deplete the solidus enough to cross the geotherm, and determine whether the nature seismic anomalies such as the LVL atop the 410 km discontinuity can be attributed to the presence of volatiles-induced partial melting.
We will use our original data of the chondritic upper mantle solidus to discuss the thermal evolution of the early Earth in relation to the presence of partial melting, and in particular the effects that crystallization of a partially molten layer would have on the geodynamics of the mantle in the Archean-Proterozoic age.
1.3.2. Ultra-low velocity zones at the CMB
Seismological studies have observed the presence of ultra-low velocity zones (ULVZ) in specific locations in the mantle just above the core-mantle boundary (CMB), characterized by a decrease in P- and S- wave velocities of 10 and 30%, respectively (Garnero and McNamara, 2008; Lay et al., 2004; Stutzmann et al., 2000; Wen and Helmberger, 1998; Williams and Garnero, 1996). Their size is limited to just about 100 km wide, and few tens of km in thickness, and their density have been found to be about 10% higher than the surrounding mantle. ULVZ may truly be laterally discontinuous, rather than representing the thicker portions of an otherwise ubiquitous thin layer, but the existence of a very thin ULVZ-like layer spanning the entire CMB cannot be ruled out.
15
Figure 1.5. Solidus (S-) and liquidus (L-) curves for different lower mantle compositions, together with the
present-day mantle adiabat (Katsura et al., 2010). F10: (Fiquet et al., 2010); A11: (Andrault et al., 2011b); N14: (Nomura et al., 2014).
Despite being reported in several regions across the CMB, it is still unclear whether ULVZ exhibit the same characteristic ubiquitously (Thorne and Garnero, 2004). Their observation has generally been interpreted as being an outcome of the presence of partial melting due to the steep temperature gradient at the CMB. A degree of partial melting between 5 and 30% could in fact decrease P- and S- seismic wave velocities to a similar value as that reported for ULVZ (Rost et al., 2005). In their study, however, (Thomas and Asimow, 2013) concluded that the ambient mantle cannot produce a partial melt in equilibrium with a residue that is sufficiently dense to be compatible with the observed ULVZ. Moreover, solidi determinations of pyrolitic, peridotitic and chondritic mantle, show that partial melting is not likely to happen in the mantle today, as melting temperatures are much higher than the present-day geotherm (Figure 1.5) (Andrault et al., 2012; Fiquet et al., 2010; Nomura et al., 2014; Nomura et al., 2011). Alternatively, partial melting in the D” layer could eventually be induced by a change in the chemical composition of the mantle. A local concentration of incompatible elements (Na, K) and/or volatiles (H2O, CO2) could in fact have a moderate effect on the solidus temperature. Another hypothesis involve the presence of a basal magma ocean enriched in incompatible elements (Labrosse et al., 2007). At the present, however, the most likely explanation for the nature of the ULVZ is that they represent compositionally distinct material, probably iron enriched, which may or may not be partially molten. Sinking of particularly
16 dense melts from the mantle above and accumulation at the CMB could provide a source for melting that is chemically diverse from the surrounding mantle, thus explaining the ULVZ in the D” region.
17
18 Understanding the deep structure and the composition of our planet is the main goal of Earth’s scientists. Seismology is the most reliable tool to investigate the inaccessible part of the Earth. However, even if the study of the propagation of the seismic waves through the Earth allows us to identify the presence of discontinuities through the Earth, such important approach cannot explain by itself the origin and the nature of such discontinuities. Therefore, in order to understand the behaviour of different materials at conditions typical of the Earth’s interior, high pressure and high temperature experiments have become the most important tool in mineral physics. Throughout the years a number of high pressure devices have been developed, such as diamond anvil cell (DAC) and multi anvil apparatus (MAA). In both DAC and MAA the smaller the compressed area (so called pressure chamber), the higher the resulting pressure. DACs have a smaller pressure chamber than MAAs (an advantage to reach higher pressures) but they employ smaller samples. Usually, a typical size of a DAC sample is some tens of µm3, whereas that of a MAA experiment is up to few tens mm3. Through the years, geoscientists have tried to develop new types of both MAAs and DACs, in order to extend the range of pressure and temperature achievable, but still preserving a relatively large size of the samples.
2.1. Sample preparation
Table 2.1. Composition of our starting material.
Our sample consisted in a mixture of oxides with composition typical of the chondritic mantle after core segregation (see Table 2.1). We used two different compositions, with or without Fe, in order to test the effect of Fe on the melting curves. No trace elements were added to the mixture. Their effect on the melting curves is believed to be negligible, since they do not partition strongly to the melt and instead preferably enter Ca-rich phases (Corgne et al., 2003).
19 Powders were initially grinded to a homogeneous mixture in an agate mortar for approximately 1 hour.
Figure 2.1. Close-up of the molten glass sphere levitating on the aluminium nozzle (Credit: Oak Ridge National
Laboratory).
Starting powders were molten into glass spheres of ~2.5 cm in diameter, using the high temperature aerodynamic levitation system at the laboratory Conditions Extrêmes et Matériaux: Haute Température et Irradiation in Orléans (France). This containerless method uses a regulated gas flow, through a conical nozzle below the sample, eliminating completely any contact between sample and container and thus, preventing any contamination. The oxide powders were first pressed in a pellet die with a load of 6 tons. Weighted pieces of these pellets were melted for a few minutes at a temperature above 2000°C in an aluminium nozzle, giving a spherical shape to the sample (Figure 2.1). Then the samples were quenched down to room temperature in few seconds with a maximum cooling rate of 500°C/s. In order to obtain reduced and oxidized atmospheres the levitation chamber can either first evacuated and further filled with pure Ar with less than 0.05 ppm of oxygen, however the vessel remained opened to air during the synthesis at high temperature. This prevents for the formation of metallic Fe at very high temperatures when using a reduced atmosphere. A description of the complete laser-heating levitation procedure can be found in ((Hennet et al., 2006); (Hennet et al., 2011)). The recovered glass spheres were polished in the shape of a cylinder that can be directly inserted into the capsule of the high pressure assembly. Such starting material provides consistent advantages when performing studies of the melting behaviour. Firstly, the presence of moisture at the surface of the grain is decreased drastically. Moreover, chemical homogeneity is ideal in the glass, compared to the intrinsic heterogeneities typical of the mixtures of powders.
20 The key diffusive length scale for equilibration is micron scale of the grains. Achievement of such equilibrated textures, including documentation of well-developed triple junctions devoid of melt or excess phases (see for example, (Davis et al., 2011)). It seems rather logical that the scale of heterogeneity will be smaller at the solidus temperature when starting from an homogeneous glass rather than from a mixture of powders with an initially broad distribution of grain scale. When our glass recrystallizes, it produces nanograins first that do not achieve a size larger than a micron until we reach the solidus. This is shown in our SEM images (see figure 2.14). We note that in previous studies (e.g. (Herzberg et al., 2000b)), the grain size of the initial powder is not mentioned. It demonstrate that the kinetic effects, in particular the grain to grains diffusion, was not taken into account in this previous study.
Table 2.2 provides a list of the experimental runs performed in this work, for both synchrotron X-ray diffraction experiments and in situ electrical conductivity measurements. Pressure P(GPa) is the experimental pressure at the onset of melting. Tobs is the raw experimental temperature when the melting criterion is observed. ΔTgrad is temperature correction for presence of thermal gradients in the cell assembly (see figure 2.3). ΔTH2O is the temperature correction for presence of 90 ppm water in the sample (see figure 2.16). TSolidus is the true solidus temperature. Tcryst is the temperature at crystallisation of the glassy starting material is observed. Phases is the list of minerals present in the sample, as refined from the X-ray diffraction patterns (see figure 2.12). Oli, Gt and Wad stand for olivine, garnet and wadsleyite, respectively.
21
Table 2.2. Summary of the experimental run performed in this study. * During conductivity experiments, onset
of sample crystallization was observed below 1273 K. Then, the temperature was keep constant between 1373 and 1573 K for ~3h.
Exp. # P(GPa) Tobs (°C) Dtgrad DTH2O TSolidus(K) Tcryst(K) Phases
MA2_05 1 1130 80 36 1519 1250 Gt, Oli MA2_05 11.6 1630 80 47 2030 Gt, Oli MA2_06 4.7 1430 80 40 1823 1473 Gt, Oli MA2_07 9.8 1608 80 45 2006 1500 Gt, Oli MA2_08 17.4 1750 80 52 2155 1600 Gt, Wad MA3_08 1.4 1211 80 36 1600 1173 Gt, Oli MA3_09 7 1444 80 42 1839 1273 Gt, Oli MA4_01 9 1520 80 44 1917 1550 Gt, Oli MA4_02 16 1703 80 51 2107 1500 Gt, Wad MA4_03 24 1860 80 55 2268 1573 Gt, MgO MA4_04 13.5 1660 80 49 2062 1385 Gt, Oli LMV-157 5 1472 80 40 1865 1373-1573* LMV-183 5 1447 80 40 1840 1373-1573* LMV-170 5 1447 80 40 1840 1373-1573* LMV-171 5 1422 80 40 1815 1373-1573* LMV-172 5 1422 80 40 1815 1373-1573* LMV-285 20 1777 80 55 2185 1373-1573* Electrical Conductivity X-ray diffraction
22
2.2. Multi Anvil Experiments
During the last 50 years, a number of different MAAs have been used in high pressure and high temperature experiments. From the Bridgman anvil (developed in 1952 and used by Ringwood to observe the olivine-spinel transformation (Ringwood, 1970) to the 6/8 Kawai-type multi anvil (Kawai and Endo, 1970), the evolution of such devices passed through many stages. We can distinguish between three main MAAs, i.e. tetrahedral, cubic and octahedral types, corresponding to the geometry of the system. Each type has a precise number of anvils (4, 6 and 8, respectively) and a different polyhedral pressure medium (cubic, tetrahedral and octahedral, respectively). In the so-called Hall’s tetrahedral apparatus (Hall, 1958), four tungsten carbide anvils compress simultaneously four faces of the tetrahedral pressure medium (usually pyrophyllite), and, at room temperature, a maximum pressure of ~12 GPa can be reached (Ito, 2007). Today, the most used large volume apparatuses are the DIA-type multi anvil and the 6/8 Kawai-type multi anvil. In the DIA-type MAA (cubic geometry) six so-called primary-stage anvil (made of either hardened steel or tungsten carbide) are driven along three opposite directions perpendicular to each other, compressing a cubic high pressure medium. Since pressure generation in the DIA-type MAA is usually limited to approximately 10 GPa, a second stage anvil system can be implemented to achieve higher pressure (see later). A modified version of the cubic geometry large volume press is the D-DIA (deformation-DIA) MAA, which allows us to drive independently two of the six primary anvils, in order to create a non-hydrostatic stress and to apply a controlled strain rate to the sample. In the Kawai-type MAA (also known as split cylinder-type), the force is applied simultaneously to 8 inner cubic anvils (tungsten carbide, synthered diamond, polycrystalline diamond) by 6 outer anvils, usually made of hardened steel or tungsten carbide. When implementing a secondary stage system, a corner of each cube has been truncated in order to create a triangular face with a precise edge length (TEL, truncation edge length). The cavity generated by the eight truncations is the vessel of the pressure medium. The pressure medium is usually made of semi-sintered MgO-5%Cr2O3 ceramic, although other ceramic material, such as zirconia or pyrophyllite, are sometimes used. During compression, the pressure medium edges are extruded into the space between the anvils. This determines non-hydrostatic conditions inside the pressure chamber. In order to prevent such problem, a lateral supports for the pressure medium is used. The support, called gasket, should be made of a softer material than the pressure medium (e.g. pyrophyllite).
23
2.2.1. Electrical conductivity experiments a. High-pressure assembly
Electrical conductivity measurements were performed using the 1500-Tons 6-8 split cylinder Kawai-type multi anvil apparatus operating at the Laboratoire Magmas et Volcans (Clermont-Ferrand, France). Quasi-hydrostatic pressures of 5, 10 and 20 GPa were provided by compressing octahedral pressure medium with edge length of 18, 14 or 10 mm between 8 tungsten carbide cubic anvils which edges truncated to 11, 8 or 4 mm, respectively. The sample pressure estimations were was based on room temperature pressure calibration of Bi (2.55, 7.7 GPa), ZnS (15.6 GPa), GaAs (18.3 GPa) and GaS (22 GPa) (Bean et al., 1986) and at high temperature using the phase transformation of quartz to coesite (Bose and Ganguly, 1995), CaGeO3 garnet to perovskite (Susaki et al., 1985), coesite to stishovite (Zhang et al., 1996), forsterite to wadsleyite (Katsura et al., 2004), wadsleyite to ringwoodite (Suzuki et al., 2000) and majorite to perovskite (Hirose et al., 2001). The error in pressure determination at high temperature is of about 0.5-1 GPa.
Figure 2.2. Schematic drawing of the high pressure assembly for electrical conductivity experiments.
A schematic view of our sample assembly is shown in Figure 2.2. We used octahedra made of semi-sintered MgO with 5% Cr2O3, which encompasses the interesting properties of low thermal conductivity, low electrical conductivity and high melting point. A ZrO2 cylindrical sleeve was placed around the heater to enhance thermal insulation. The heater was made of a 50 μm thick rhenium foil folded into a cylindric shape and inserted within the ZrO2 sleeve. Re provides very stable heating for temperatures up to more than 2273K. We kept
24 sample length to less than 1mm, in order to reduce the effect of temperature gradient during heating.. A cylindrical sleeve of MgO is inserted between the heater and the sample to (i) prevent chemical reactions with the Re heater, (ii) insure the electrical insulation of the sample and (iii) contain the sample upon melting.
The sample temperature was measured using type C thermocouple (W5%Re-W26%Re). Diameter of thermocouple wires were adapted the size of the octahedra (50 μm for 18/11 and 14/8, and 30 μm for 10/4 assemblies). The thermocouple was positioned on one side of the assembly. We added a third W5%Re wire on the other side of the cylindrical sample to allow measurements of the sample impedance. The Re disks placed either side of the sample facilitate the electrical connection between the sample and the electrode wires.
b. Temperature gradient
Because the temperature determination is major in this study, it is crucial to estimate the thermal gradient in our sample. We modelled the cell assembly used for electrical conductivity measurements based on the finite element method (Hernlund et al., 2006). The schematic cut of ¼ of the high pressure assembly was modelled for thermocouple temperatures between 1473 and 2273 K (Figure 2.3).
Figure 2.3. Thermal gradient simulations for the 18/11 mm assembly and for thermocouple temperatures of
1473 (left), 1873 (centre) and 2273 K (right). The sample size is 1.5mm (only half of its size is drawn here). The difference between the thermocouple reading and the sample temperature remains constant at 80 K.
As expected, the hottest part is found at the centre of the sample (extreme top-left position). The limited distance between sample and thermocouple (TC, blue dot) is achieved thanks to the penetration of thermocouple wires at the centre of the cylindrical Re-furnace (See
25 figure 2.2). Each temperature contour (thin black lines) represents a temperature interval of 50 K. In all simulations, the temperature difference (DTSimul) between the sample centre and the thermocouple does not exceed 100 K. In this work, we apply a temperature correction DTSimul to all our temperature measurements (see Table 2.2).
c. In situ impedance spectroscopy method
Impedance spectroscopy (IS) is a very well-known method of characterizing many of the electrical properties of materials, and it is an ideal technique in experimental petrology to monitor the evolution of a sample during experiments, since it can be used to investigate the changes in the conductance of solids (due to e.g. chemical reactions, defects, compositional changes). Generally, impedance spectroscopy is used to measure the total opposition that a material presents to a current flow when applying alternating (AC) signals of varying frequency. IS provides both a magnitude and a phase (|Z|, θ), and it can be described by a real and an imaginary component (Z’, Z”). It is given by
𝑍(𝜔) = 𝑍′− 𝑗𝑍",
where Z(ω) is impedance as a function of frequency for alternating current, j is √-1, 𝑍′ = |𝑍|𝑐𝑜𝑠𝜃 and 𝑍"= |𝑍|𝑠𝑖𝑛𝜃. The phase angle (θ) can be obtain from 𝜃 = 𝑡𝑎𝑛−1(𝑍"/𝑍′). Impedance spectroscopy measurements are usually carried out by applying a single-frequency voltage (or current) to the interface and measuring the phase shift and amplitude (or real and imaginary parts) of the resulting current at that frequency.
Impedance data are plotted in the complex impedance plane (Z’, Z”) as semi-circular arcs and the sample’s resistance can be ideally given by the intersection between the real impedance Z' and the arc itself. Impedance arcs are characterized by a relaxation time (𝜏 = 𝑅 × 𝐶), and they are related to one or more distinct conduction processes taking place at a specific frequency range. Generally, a basic impedance arc is generated by an electrical circuit where a resistor is in parallel with a capacitor (RC circuit). In the case of a polycrystalline material, the single impedance arc is characteristic of conduction through the grain interior (Figure 2.4).In many cases however, since transport properties in polycrystalline solids are strongly affected by microstructure, and impedance spectra usually contain features that can be directly related to microstructure, a more complicated pattern can be observed when data are plotted in the complex impedance plane. A perfect example is given by the asymmetry of the
26 arc in complex plane, which is ideally centered on the real axis, but can be frequently displaced below it. This can be due to the presence of microstructures in the sample, which generally can result in the presence of multiple arcs at higher frequencies. Such complex datasets can be solved using the equivalent circuit model by replacing simple capacitor with a constant-phase-element (CPE). Equivalent circuits are electrical circuits made of resistors and capacitors in arrangement, which respond with frequency in the same manner as the sample. Each part of the circuit represents different processes taking place either in the sample. In their work, (Roberts and Tyburczy, 1991) provided an ideal example of a simple equivalent circuit, composed by three resistor-capacitor (RC) circuits. This RC circuit translate to the complex plane as three impedance arcs, corresponding to three distinct conductions media in the sample: conduction through grain interior (first arc), conduction through grain boundary (second arc), and reactions taking place at the sample-electrode interface (third arc), from the highest to the lowest frequency, respectively.
Figure 2.4. Schematization of a resistor-capacitor circuit representing conduction through grain interior in a
polycrytalline material, and its representation on the complex impedance plane.
Figure 2.5. Schematization of IS models for melting experiments. (a) represents a model at the onset of melting,
at a melt fraction low enough for melt to be stable in isolated pockets at the grain boundaries. (b) illustrate the change in conduction mechanism as soon as melt will interconnect within the sample.
27
d. Electrical conductivity measurements
Electrical conductivity was determined using impedance sp ectroscopy method in the frequency range of 10 6 -101 Hz (F igure 2.6). Insulation resi stance (detection limit) of the
assembly at sim ilar pressure-temperature conditions was determined prior to the actua l experiments. Polycrystalline samples are characterized by a combination of resister- / constant phase element (R-C/CPE) circuits and the resistance can be obtained by fitting the impedance spectra to appropriate equivalent circuits . Once the sam ple resistance is determ ined, conductivity can be calculated using the sam ple diameter and length m easured after each experiment, assuming the sample geometry remained unchanged during the experiment using,
,
where l and A are sample length and area of the cross-section, respectively.
The activation enthalpy (H) of each conduction mechanism can be obtained by fitting the data to Arrhenius equation, where
is the e lectrical conductivity (S/m), T the absolute temperature,
0 the pre-exponential factor (S/m), and k the Boltzmann constant (J/K):∆ .
For each experiment, we performed a series of heating and cooling cycles, similar to previous works (e.g. (Manthilake et al., 2009), see figure 3.1.a). The low activation enthalpy observed in the first heating cycle below 573 K is likely to result from an extrinsic mechanism such as the presen ce of free pro tons. The ad sorbed moisture in the assem bly poses overestimation of the electrical conductivity due to current leakages through the surrounding ceramic components. We m inimized such e ffects during our experim ents by keeping the assembly at 500 K at desired pressure for more than 12 hours. While maintaining a temperature of 500 K, electrical resistance of the sample was measured at regular intervals until the sample resistance reached a steady value, often 1-2 or ders of magnitude higher than the res istance measured at the beginning of the heating cycle. Sample resistance was usually m easured in several heating-cooling cycles at temperature steps of 50-100 K until the heating and cooling paths were fully reproducible. Upon heating to higher temperatures, we observed a clear drop in the sample conductivity at around 1100 K, due to the glass transition in the sample. It induces the sample crystallization that was clearly observed during the in situ X-ray diffraction
28 experiments (see below, figure 2.10). The samples were kept between 1370 and 1570 K for ~3h, allowing the complete crystallization of initial glass, which is confirmed by the textural analysis of quenched experiments. Sample resistance was usually measured in several heating-cooling cycles at temperature steps of 50-100 K until the heating and heating-cooling paths were reproducible. This minimizes the uncertainty of electrical conductivity measurements. Below the melting temperature of our sample impedance appears to vary exponentially with temperature with an activation energy of 1.02 eV (Figure 3.1.b, green line). This is typical of electron hole hopping between Fe2+ and Fe3+ conduction mechanism by small polarons (Yoshino, 2010).
For a nominal pressure of 5 GPa, we observed a clear change of slope in the conductivity profile at a temperature of ~1700 K, It can be interpreted as the onset of partial melting in the sample. At small melt fractions, the melt is likely found within grain boundaries and/or in isolated melt pockets and the total conductivity is weekly affected by their contribution. Thus, reaching the solidus temperature is not expected to produce a first order change in the overall sample conductivity. However, when temperature is further increased, progressive increase of the melt fraction induces more interconnection between the melt pockets. The conductivity is observed to increase up to ~102 S/m. At this temperature, the melt becomes the dominant conductive phase, interconnected between the two electrodes, with an ionic conduction mechanism (Gaillard et al., 2008). Similar evolutions of sample conductivity were already interpreted previously by the occurrence of an interconnected network of melt (Maumus et al., 2005; Partzsch et al., 2000; Sato and Ida, 1984).
As long as the sample is below solidus temperature, conduction will mostly happen through the grain interior (simple RC circuit, figure 2.4). At the onset of melting, however, isolated melt pockets will start to form within grain boundaries, and the sample electrical behaviour can be modelled by two RC circuit in series, one for conduction through grain interior and one for the contribution of the isolated melt pockets at the grain boundaries (Figure 2.5.a). The total resistance of the sample will therefore be equal to the sum of the individual resistances of the two circuits. With a melt fraction sufficiently high, melt pockets will interconnect within the sample, becoming the preferable medium for conduction. The sample can be modelled by two RC circuit in parallel (Figure 2.5.b), and total resistance is equal to the sum of the two resistances divided by their products.