HAL Id: hal-00989203
https://hal.archives-ouvertes.fr/hal-00989203
Submitted on 9 May 2014
HAL is a multi-disciplinary open access
archive for the deposit and dissemination of
sci-entific research documents, whether they are
pub-lished or not. The documents may come from
teaching and research institutions in France or
abroad, or from public or private research centers.
L’archive ouverte pluridisciplinaire HAL, est
destinée au dépôt et à la diffusion de documents
scientifiques de niveau recherche, publiés ou non,
émanant des établissements d’enseignement et de
recherche français ou étrangers, des laboratoires
publics ou privés.
Towards an Efficient Discovery of Topological
Representative Subgraphs
Wajdi Dhifli, Mohamed Moussaoui, Engelbert Mephu, Saidi Rabie
To cite this version:
Wajdi Dhifli, Mohamed Moussaoui, Engelbert Mephu, Saidi Rabie. Towards an Efficient Discovery of
Topological Representative Subgraphs. Reconnaissance de Formes et Intelligence Artificielle (RFIA)
2014, Jun 2014, France. �hal-00989203�
Towards an Efficient Discovery of Topological Representative Subgraphs
Wajdi Dhifli
1,2, Mohamed Moussaoui
3, Engelbert Mephu Nguifo
1,2and Rabie Saidi
41CNRS, UMR 6158, LIMOS, F-63173 Aubiere, France.
2Clermont University, Blaise Pascal University, LIMOS, BP 10448, F-63000 Clermont-Ferrand, France. 3Department of Computer Science - FSEGJ - University of Jendouba, Jendouba 8100, Tunisia.
4European Bioinformatics Institute, Hinxton, Cambridge, CB10 1SD, United Kingdom.
{dhifli,mephu}@isima.fr - [email protected].
Résumé
La sélection de motifs basée sur la similarité structu-relle exacte ou approximative est un moyen de réduire le nombre élevé des sous-graphes fréquents. Cependant, les stratégies actuelles de similarité structurelle ne sont pas efficaces dans beaucoup de contextes réels. En outre, la nature combinatoire des graphes rend l’isomorphisme exact ou approximatif très coûteux. Dans ce papier, nous proposons une approche qui permet de sélectionner un sous-ensemble de sous-graphes topologiques représenta-tifs parmi les fréquents. L’approche proposée surmonte le coûteux test d’isomorphisme exact ou approximatif en me-surant la similarité structurelle globale en se basant sur un ensemble d’attributs topologiques considérés. Elle permet aussi de détecter des similaritées structurelles cachées (tels que la densité, le diamètre,etc.) qui ne sont pas considé-rées par les approches existantes. En outre, l’approche pro-posée est flexible et peut être facilement étendue avec des attributs définis par l’utilisateur selon l’application. Les analyses expérimentales sur des bases de graphes réelles et synthétiques montrent l’efficacité de notre approche.
Mots Clef
Sélection de motifs, sous-graphes topologiques représenta-tifs, sous-graphes fréquents, bases de graphes.
Abstract
Feature selection based on exact or approximate structural similarity is a way to reduce the high number of frequent subgraphs. However, current structural similarity strate-gies are not efficient in many real-world cases. Besides, the combinatorial nature of graphs makes performing exact or approximate isomorphism very costly. In this paper, we propose an approach that mines a subset of topological re-presentative subgraphs among frequent ones. The propo-sed approach overcomes the costly exact or approximate isomorphism by measuring the overall structural simila-rity based on a considered set of topological attributes. It also allows detecting hidden structural similarities (such as density, diameter,etc.) that existing approaches ignore. In addition, the proposed approach is flexible and can be
easily extended with any user defined attributes depending on the application. Empirical studies on real and synthetic graph datasets show the efficiency of our approach.
Keywords
Feature selection, topological representative subgraphs, frequent subgraphs, graph databases.
1
Introduction
With the emergence of graph databases, the task of frequent subgraph discovery has been extensively addressed. Many approaches have been proposed in the literature allowing the extraction of frequent subgraphs in an efficient way. Yet, the number of discovered frequent subgraphs is ex-tremely high which causes information overload that may hinder or even makes unfeasible further exploration. Feature selection is a way to tackle this information over-load problem. As structural similarity represents one major cause of redundancy in frequent subgraphs, many works have been proposed for subgraph selection based on exact or approximate structural similarity [1, 2, 3, 4]. Some works have been proposed based on closed and maximal subgraphs such as [1, 2, 6, 5]. Although the set of closed or maximal subgraphs is much smaller than that of frequent ones, the number of subgraphs is still very high. In some applications, slight differences between subgraphs do not matters. Yet, in real-world cases very similar subgraphs so-metimes slightly differ in structure. Exact structural iso-morphism does not help to overcome this issue.
Many works have been proposed for subgraph selection based on approximate structural similarity. In [3], authors proposed an approach for subgraphs extraction and selec-tion. For selection, the structural similarity between two subgraphs is measured by how much does their maximum common subgraph represents from their overall structure. A very close work is [4], where authors proposed an ap-proach for mining a set of structural representative sub-graphs among the frequent ones. They adopted a two-step approach that is based on approximate structural similarity on micro and macro sides. In the first step, they consider a tolerance threshold to summarize approximately
isomor-phic subgraphs into one representative. In the second step, they collapse multiple structurally similar subgraphs into one representative using a clustering algorithm.
Existing selections approaches, that are based on exact or approximate structural similarity, look into every single de-tail and test the structural similarity by establishing a mat-ching between subgraphs. This similarity detection stra-tegy is not efficient in many real-world applications. On one hand, because computing every possible matching bet-ween subgraphs is very costly. On the other hand, exact structural similarity does not allow detecting similar yet slightly different subgraphs, and approximate structural similarity has the problem of threshold setting. Since a tight threshold will prevent detecting similar subgraphs that slightly differ in structure beyond the tolerance threshold. In contrast, a loose threshold will hinder the soundness of the selection because of false positives. This rises the need for a different way to consider the structural similarity such that both close and distant structural similarities would be detected with respect to the soundness of results.
In order to overcome these drawbacks, we propose a novel approach that mines a subset of topological representative subgraphs among frequent ones. At a glance, our approach involves two steps. In the first step, each subgraph is en-coded into a topological description-vector containing the corresponding values for a set of topological attributes. In the second step, subgraphs with similar topological des-criptions are clustered and the central subgraph in each cluster is considered as the representative delegate. Our ap-proach overcomes the costly exact or approximate isomor-phisms and allows detecting hidden similarities between subgraphs (such as spectral radius or closeness centrality) that existing structural similarity approaches ignore. Be-sides, It can be easily extended by enabling the user to target a specific set of topological attributes depending on how important each one is to the application.
Considering topological properties was inspired by works like [8, 9, 10] where authors showed the efficiency of to-pological attributes in describing graph data. For instance, in [8], authors proposed a classification framework based on the assumption that graphs belonging to the same class have similar topological descriptions. Our approach is ba-sed on similar assumption and consider that structurally si-milar subgraphs should have sisi-milar topological properties such that even a slight difference does not affect the ove-rall topological similarity. Besides, in some applications, the user may be only interested in some specific structu-ral properties. Considering exact or approximate structustructu-ral similarity approaches does not allow this specificity. The remainder of the paper is organized as follows. Section 2 presents and defines the preliminary concepts as well as the main algorithm of our approach. Section 3 describes the datasets and the experimental settings. In Section 4, we present the obtained results and the discussion.
2
Material and methods
In this section, we present the fundamental definitions and the formal problem statement of the proposed approach.
2.1
Preliminaries
Definition 1. (Graphs and graph databases) LetG be a da-tabase of connected graphs. Each graphG= (V, E, Σ, L) ofG is given as a set of nodes V and edges E. The nodes are labeled within an alphabetΣ and L is the label func-tion.|V | and |E| represent the number of nodes and edges. Definition 2. (Subgraph isomorphism) A labeled graphG is subgraph of another oneG0, denoted byG✓ G0, if there
exists an injective functionf : V ! V0, such that :
- 8u, v 2 V : 8{u, v} 2 E ! {f (u), f (v)} 2 E0
- 8v 2 V : L(v) = L0(f (v))
- 8{u, v} 2 E(G) : L{u, v} = L0{f (u), f (v)}
whereL and L0are the label functions ofG and G0. Under
these conditions,f is called an embedding of G in G0,G is
a subgraph ofG0, andG0is a supergraph ofG.
Definition 3. (Frequent subgraph) Given a subgraphg, a graph databaseG, and a minimum frequency threshold τ , letGgbe the set of graphs whereg appears (i.e. g has a
subgraph isomorphism in each graph inGg). The subgraph
g is considered as frequent if support(g) = |Gg|
|G| ≥ τ .
Problem Statement: Even though the existing approaches for subgraph selection greatly enhanced the selection pro-cess, the number of selected subgraphs is still high. Yet, we want to show as few subgraphs as possible so that the user’s reviewing efforts are minimized. The general framework of our selection strategy is as follows. Given a set of frequent subgraphs Ω and an integer k 2 [1..|Ω|], we want to select up to k representative subgraphs Ωk ✓ Ω such that each
frequent subgraph g 2 Ω has one representative subgraph-delegate g⇤ 2 Ω
k, and each representative subgraph is the
closest one to all the subgraph it represents.
2.2
Naïve approach
A fundamental part in our selection approach is the graph encoding which consists in transforming each subgraph into a different format that is accepted by the clustering al-gorithm. A very common way of encoding in the literature (for instance [8] and [12]) is to transform the input sub-graphs into a context-matrix where each subgraph is repre-sented by a binary vector denoting by 1 or 0 the presence or the absence of the subgraph in each graph in the data-base. After that, the context-matrix is considered as input for clustering. We term this method naïve approach and we consider it for comparison.
2.3
Topological representative subgraph
se-lection
The main idea of our approach, termed TRS (for Topological Representative Subgraph), is based on the as-sumption that structurally similar subgraphs should have
similar topological properties such that even a slight diffe-rence in the structure does not affect the overall similarity. Accordingly, we adopt a two-step selection approach. In the first step, we encode each subgraph into a topological description-vector based on a set of topological attributes. In the second step, we cluster the topological description-vectors in order to select one representative delegate from each set of topologically similar subgraphs.
Topological attributes. We select a set of topological at-tributes from the literature [8] that are interesting and effi-cient in describing connected graphs. In the following, we list and define the considered attributes :
1. Number of nodes : The total number of nodes in the graph, also called the graph order |V |.
2. Number of edges : The total number of edges in the graph, also called the graph size |E|.
3. Average degree : The degree of a node u, denoted deg(u), represents the number of nodes adjacent to u. The average degree of a graph G is the average value of the degrees of all nodes in G. Formally : deg(G) =
1 n
Pn
i=1deg(ui) where deg(ui) is the degree of the
node uiand n is the number of nodes in G.
4. Density : The density of a graph G = (V, E) mea-sures how many edges are in E compared to the maxi-mum possible number of edges between the nodes in V. Formally : den(G) = (|V |⇤(|V |−1))2|E| .
5. Average clustering coefficient : The clustering co-efficient of a node u, denoted by c(u), measures how complete the neighborhood of u is i.e. c(u) =
2eu
ku(ku−1)) where kuis the number of neighbors of u
and euis the number of connected pairs of neighbors.
The average clustering coefficient of an entire graph Ghaving n nodes, is given as the average value over all the nodes in G. Formally : C(G) = 1
n Pn
i=1c(ui).
6. Average effective eccentricity : For a node u, the ef-fective eccentricity represents the maximum length of the shortest paths between u and every other node v in G, i.e., e(u) = max{d(u, v) : v 2 V }. The average effective eccentricity is defined as Ae(G) =
1 n
Pn
i=1e(ui), where n is the number of nodes of G.
7. Effective diameter : The effective diameter repre-sents the maximum value of effective eccentricity over all nodes in the graph G, i.e., diam(G) = max{e(u) | u 2 V } where e(u) represents the ef-fective eccentricity of u as defined above.
8. Effective radius : The effective radius represents the minimum value of effective eccentricity over all nodes in the graph G, i.e., rad(G) = min{e(u) | u 2 V } where e(u) represents the effective eccentricity of u. 9. Closeness centrality : It measures how fast
infor-mation spreads from a given node to other reachable nodes in the graph. For a node u, it represents the re-ciprocal of the average shortest path length between
uand every other reachable node in the graph, i.e., Cc(u) = P n−1
v∈{V \u}d(u,v) where d(u, v) is the length
of the shortest path between the nodes u and v. For a graph G, we consider the average value of closeness centrality of all the nodes, i.e., Cc(G) = 1nP
n i=1ui.
10. Percentage of central nodes : Here, we compute the ratio of the number of central nodes from the number of nodes in the graph. A node u is considered as cen-tral point if the value of its eccentricity is equal to the effective radius of the graph, i.e., e(u) = rad(G). 11. Percentage of end points : It represents the ratio of
the number of end points from the total number of nodes of the graph. A node u is considered as end point if deg(u) = 1.
12. Number of distinct eigenvalues : Any graph G can be represented by an adjacency matrix A. Here, we count the number of distinct eigenvalues of A. 13. Spectral radius : Let A be the adjacency matrix of the
graph G and h1, h2, ..., hmbe the set of eigenvalues
of A. The spectral radius of G, denoted ρ(G), repre-sents the largest magnitude eigenvalue, i.e., ρ(G) = max(| hi|) where i 2 {1, .., m}.
14. Second largest eigenvalue : The value of the second largest eigenvalue of the adjacency matrix.
15. Energy : The energy of an adjacency matrix A of a graph G is defined as the squared sum of the eigenva-lues of A. Formally : E(G) =Pn
i=1h2i.
16. Neighborhood impurity : The impurity degree of a node u belonging to a graph G, having a label L(u) and a neighborhood (adjacent nodes) N(u), is defined as ImpurityDeg(u) =| L(v) : v 2 N(u), L(u) 6= L(v) |. The neighborhood impurity of a graph G re-presents the average impurity degree over all nodes with positive impurity.
17. Link impurity : An edge (u, v) is considered to be impure if L(u) 6= L(v). The link impurity of a graph Gwith k edges is defined as : |(u,v)2E:L(u)6=L(v)|k . As efficiency and scalability remain big challenges for graph mining algorithms, the proposed description is uni-fied which helps to overcome both challenges. On one hand, these attributes are an efficient description that allows revealing hidden topological similarities that exact and ap-proximate structural isomorphism do not consider. On the other hand, considering a fixed number of descriptors gua-rantee that the encoded vectors would be of a fixed size no matter what the number of graphs in the database is. K-medoids clustering. Here, we discuss the second part of our selection approach which is the clustering step. We use k-Medoids [11] which is a well known clustering algo-rithm that is widely used in unsupervised learning. It takes as input a set of objects Ω and a number of clusters k, and gives as output the k clusters’ centers (called medoids). To do so, k-Medoids uses these definitions :
Definition 4. (Pairwise distance between objects) Given two objectsO1 andO2 correspondingly described by the
vectors X and Y , the distance between them, denoted d(O1, O2), is defined as follows :
d(O1, O2) =P|X|i=1|xi− yi|
Definition 5. (Global distance between objects) Given a set of objects Ω, the total distance between an object O and all the other ones inΩ is defined by :
DO =P8Oi2Ω\Od(O, Oi)
Definition 6. (Cluster medoid) An objectO⇤is said to be cluster’s medoid (the most centrally located object of the cluster), if it has the minimum sum of distances to all the other objectsOiwithin the clusterC. Formally :
DO∗ = minO
i2C(DOi)
The general algorithm of k-Medoids is described in Algo-rithm 1. First, it randomly selects k objects from Ω to be the medoids, i.e. Ω⇤. Then, it assigns each non-selected object
to the cluster of the nearest medoid. After that, it swaps the kmedoid objects with other non-medoid objects aiming to minimize the overall distance. D(Ω⇤) is the total distance
before the swap and D(Ω0
k) is the total distance after the
swap. If the cost of the swap (C = D(Ω0
k) − D(Ω⇤)) is
strictly negative then the swap is considered as beneficial, otherwise it is ignored. The assignment and swap steps are iteratively performed until no change or until a user-defined maximum number of iteration is reached. Many implemen-tations of k-Medoids have been proposed in the literature. We use CLARANS [11] since it was shown that it is effi-cient for large-scale data clustering.
Algorithme 1:K-MEDOIDS
Data: Set of objects Ω, number of clusters k, maximum number of iterations maxiter
Result: Set of medoids Ω⇤= {O
1, O2, ..., Ok} 1 begin
2 Ω⇤ Ωk: start with K objects randomly selected
from Ω;
3 repeat
4 Assign each one of the non-selected objects to the
cluster having the most similar medoid;
5 Calculate the cost Ci= (D(Ω0k) − D(Ω⇤)) for
each swap of one medoid with another object;
6 ifCi<0 then 7 Ω⇤ Ω0k; 8 nbiter= nbiter+ 1 ;
9 until (no change) or (nbiter ≥ maxiter);
3
Experimental analysis
3.1
Datasets
To experimentally evaluate our approach, we use different graph datasets : protein 3D-structures and chemical
com-pounds. Table 1 summarizes the characteristics of the data-sets : dataset, |G|, Avg.|V |, Avg.|E| and | Ω | correspond respectively to the name of the corresponding protein fa-mily or chemical compound dataset, number of graph, ave-rage number of nodes, aveave-rage number of edges and num-ber of frequent subgraphs obtained from each dataset.
TABLE1 – Benchmark datasets
Dataset |G| Avg.|V| Avg.|E| | Ω |
G-proteins 66 246 971 114792
C1 set domains 76 238 928 258371
AIDS antiviral screen 43850 28 30 6749
The first two datasets were previously used in [12]. Both datasets will be used to evaluate the quality of the selec-ted subgraphs. Each dataset is equally divided between positive and negative samples. Positive proteins are sam-pled from a selected protein family, namely G-proteins and C1 set domains, whereas negative proteins are randomly sampled from the Protein Data Bank [13]. The last data-set contains the activity test information of 43850 chemi-cal compounds. This dataset was previously used in many studies such as [4] and is publicly available on the website of the Developmental Therapeutics Program1.
3.2
Protocol and settings
Graph building :For chemical compounds, each atom is represented by a node and labeled with the atom type. An edge exists between two nodes if there exists a chemical bond between their corresponding atoms. For protein 3D-structures, each protein is parsed into a graph of amino acids. Each node represents an amino acid residue and is labeled with its amino acid type. Two nodes u and v are lin-ked by an edge if the euclidean distance between their two Cαatoms is below a threshold distance δ. We use δ = 7Å.
Frequent subgraph mining :We use the state-of-the-art method gSpan [14] to find frequent subgraphs in each da-taset. We tried different minimum frequency threshold in order to obtain a reasonable number of frequent subgraphs from each dataset. The retained minimum frequency thre-shold are 30% for G-proteins and C1 set domains, and 5% for AIDS antiviral screen dataset.
Representative subgraph selection :Both selection me-thods (naïve approach and TRS) were implemented in R. Subgraph encoding :To measure the quality of subgraphs, each one of them is encoded into a binary vector by deno-ting 1 or 0, the presence or the absence of the subgraph in each graph in the dataset. The quality of the selected sub-graphs is measured over their encoding vectors.
4
Results and discussion
4.1
Empirical Results
As previously mentioned, we first evaluate our approach using the classification datasets G-proteins and C1 set
mains. We measure the quality of the selected subgraphs using the information gain which is one of the most po-pular interestingness measures in data mining. The infor-mation gain is measured separately for each subgraph in each set in order to measure how each representative is in-formative for the considered task (i.e. classifying the two protein datasets). The average value of information gain is computed for all the frequent subgraphs then for the repre-sentative subgraphs selected by TRS and those selected by the naïve approach using different number of representa-tives. The average information gain value obtained with all the frequent subgraphs is considered as standard value for comparison such that a good set of representatives should be at least as informative as the whole initial set of all frequent subgraphs. Table 2 shows the obtained results.
TABLE2 – Comparison of average information gain of the
topological representative subgraphs (TRS) with those se-lected by the naïve approach (NA) and the initial set of all frequent subgraphs (FSG).
G-proteins C1 set domains
FSG 0.216 0.148 #representatives NA TRS NA TRS 50 0.104 0.324 0.068 0.254 100 0.092 0.342 0.061 0.285 200 0.096 0.343 0.044 0.273 300 0.097 0.347 0.058 0.267 400 0.094 0.339 0.051 0.276 500 0.090 0.348 0.052 0.269 600 0.096 0.340 0.054 0.267 700 0.097 0.343 0.055 0.272 800 0.098 0.352 0.054 0.274 900 0.094 0.358 0.054 0.276 1000 0.094 0.353 0.056 0.276 Average 0.095+0.008 −0.005 0.344+0.013−0.020 0.055+0.012−0.011 0.271+0.013−0.017
Table 2 shows that TRS is able to select a subset of sub-graphs that are more informative than those selected by the naïve approach and the initial frequent subgraphs. Whe-reas, the quality of the subsets of representative subgraphs selected by the naïve approach did not even reach the infor-mation gain value of the whole set of frequent subgraphs. Both previous interpretations goes with all the used num-bers of representatives. This proves the reliability of our selection approach and shows that using the topological at-tributes for description is more efficient than using the oc-currence information. It enables k-medoids to better detects similarity relations between subgraphs and thus to select a subset of representatives that are most informative.
4.2
Runtime analysis
In this section, we study the runtime of our algorithm com-pared to that of the naïve approach.
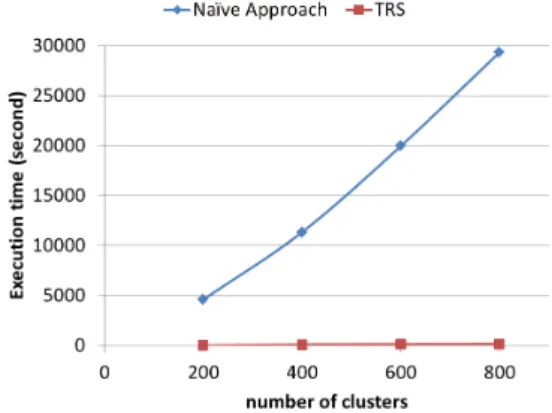
Scalability to higher number of clusters. We study the effect of varying the number of clusters k on the runtime of clustering for both TRS and the naïve approach. We se-lect the representative subgraphs among the frequent ones previously extracted from the AIDS antiviral screen data-set. Figure 1 illustrates the evolution of runtime using
dif-ferent values of k ranging from 200 to 800 with a step-size of 200. Figure 1 shows a huge difference in runtime
bet-FIGURE 1 – Runtime of clustering for TRS and naïve
ap-proach with different number of clusters (k).
ween the two approaches. In fact, for 200 clusters, the naïve approach consumed more than one and half hour to fi-nish the clustering, whereas TRS needed only few seconds. This difference becomes much bigger with higher values of k. As the number of clusters increases, the runtime of the naïve approach considerably increases as well. Yet, the clustering time in TRS did not increase significantly and al-most stays steady with higher values of k. Since the cluste-ring is almost polynomial and considers each possible pair of subgraphs for comparison, the smaller the description of the subgraphs is, the faster the clustering would be. Conse-quently, the huge gain in runtime is basically due to the small and fixed size of the topological description-vectors used in TRS compared to the context description-vectors in the naïve approach.
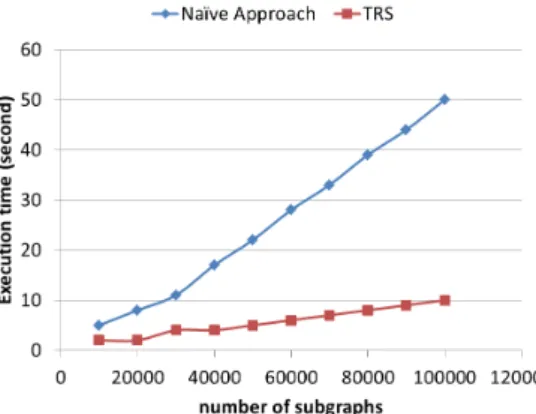
Scalability to higher number of subgraphs. Here, we study the effect of varying the number of frequent sub-graphs on clustering runtime for both TRS and the naïve approach. We select the representative subgraphs among different sets of frequent subgraphs ranging from 10000 to 100000 with a step size of 10000. The input subgraphs were randomly selected among the frequent subgraphs pre-viously extracted from the C1 set domains dataset. Figure 2 illustrates the evolution of runtime with higher number of subgraphs, for 100 clusters. As shown in the Figure, TRS takes only few seconds to select the representative subgraphs, whereas, the naïve approach takes clearly much more time. Increasing the number of subgraphs does no af-fect the runtime of TRS as much as it does with the naïve approach. This shows that TRS is more scalable than the naïve approach to higher numbers of subgraphs.
Scalability to higher number of graphs. In real-world applications, the size of databases is usually very high. We study the effect of varying the number of graphs on the runtime of both TRS and the naïve approach. We fix the number of subgraphs to 10000, and we synthetically mani-pulate the list of occurrences of each frequent subgraph and
FIGURE2 – Runtime of clustering for TRS and naïve
ap-proach to select 100 representatives among different num-bers of subgraphs.
replace it by a random list of random occurrences between 0 and a considered number of graphs. The considered num-bers of graphs are between 1000 and 10000, with a step size of 1000. Figure 3 illustrates the evolution of runtime with higher number of graphs for 100 clusters.
FIGURE3 – Runtime of clustering for TRS and naïve ap-proach to select 100 representatives among 10000 sub-graphs whith variation of the number of sub-graphs.
As the naïve approach uses the occurrence information to construct the context description-vectors, this makes it highly affected by the increasing of the size of the database. Figure 3 shows that the runtime of the naïve approach in-creases considerably with higher numbers of graphs. Whe-reas, the runtime of TRS is only few seconds and remains stable no matter what the size of the database is. This shows that TRS is scalable and more robust in real-world applica-tions that usually deals with huge amounts of data.
5
Conclusion
We proposed a novel approach that mines a subset of to-pological representative subgraphs among frequent ones. Instead of exact or approximate structural similarity our approach follows a more meaningful selection strategy,
that helps on both selecting a subset of topologically irre-dundant and informative subgraph-delegates, and detecting hidden similarities between subgraphs that current selec-tion approaches ignore. This approach can be easily exten-ded using any user defined attribute. Besides graph data-bases, it can also handle other scenarios such as subgraph selection in single graph. Empirical studies on real and syn-thetic graph datasets showed that our approach is fast and allows selecting informative subgraphs. In many applica-tion, the user may not be able to define a specific number of clusters. A promising future direction could be to re-move the k constraint. This can be done using a parameter free clustering algorithm such as Medoids-shifts [15]. In order to extend our work to supervised classification, we also plan to compare our approach with other approaches based on structural similarity such as treelets [17, 16]. We will study how to combine this approach with a semantical based one as described in [7].
Acknowledgements
We would like to thank the anonymous reviewers for their useful comments. This work was partially supported by the Tunisian government through a Master study grant to the second author.
References
[1] X. Yan, J. Han. Closegraph : mining closed frequent graph patterns, in : ACM KDD 2003, pp. 286–295. [2] L. T. Thomas, S. R. Valluri, K. Karlapalem. Margin :
Maximal frequent subgraph mining, in : IEEE ICDM 2006, pp. 1097–1101.
[3] V. Chaoji, M. Al Hasan, S. Salem, J. Besson, M. J. Zaki. Origami : A novel and effective approach for mining representative orthogonal graph patterns, Statistical Analysis and Data Mining 1 (2) (2008) 67– 84.
[4] C. Chen, C. X. Lin, X. Yan, J. Han. On effective pre-sentation of graph patterns : a structural representa-tive approach, in : CIKM 2008, pp. 299–308. [5] I. Takigawa, H. Mamitsuka. Efficiently mining
δ-tolerance closed frequent subgraphs, Machine Lear-ning 82 (2) (2011) 95–121.
[6] J. Li, G. Liu, H. Li, L. Wong. Maximal biclique sub-graphs and closed pattern pairs of the adjacency ma-trix : A one-to-one correspondence and mining algo-rithms, IEEE TKDE 19 (12) (2007) 1625–1637. [7] W. Dhifli, R. Saidi, E. Mephu Nguifo. Smoothing 3D
protein structure motifs through graph mining and amino-acids similarities, Journal of Computational Biology 21(2)(2014) 162-172.
[8] G. Li, M. Semerci, B. Yener, M. J. Zaki. Effective graph classification based on topological and label at-tributes, Statistical Analysis and Data Mining. 5 (4) (2012) 265–283.
[9] J. Gibert, E. Valvenya, H. Bunke. Feature selection on node statistics based embedding of graphs, Pattern Recognition Letters 33 (15) (2012) 1980–1990. [10] M. Veeramalai, D. Gilbert. A novel method for
comparing topological models of protein structures enhanced with ligand information, Bioinformatics 24 (23) (2008) 2698–2705.
[11] R. T. Ng, J. Han. Clarans : A method for clustering objects for spatial data mining, IEEE TKDE 14 (5) (2002) 1003–1016.
[12] H. Fei, J. Huan. Boosting with structure information in the functional space : an application to graph clas-sification, in : ACM KDD 2010, pp. 643–652. [13] H. M. Berman, J. Westbrook, Z. Feng, G. Gilliland,
T. N. Bhat, H. Weissig, I. N. Shindyalov, P. E. Bourne. The protein data bank, Nucleic Acids Research 28 (1) (2000) 235–242.
[14] X. Yan, J. Han. gSpan : Graph-based substructure pat-tern mining, in : IEEE ICDM 2002, pp. 721–724. [15] Y. A. Sheikh, E. A. Khan, T. Kanade. Mode-seeking
by medoidshifts, in : IEEE ICCV 2007, pp. 1–8. [16] B. Gaüzère, L. Brun, D. Villemin. Noyau de
Tree-lets appliqué aux graphes étiquetés et aux graphes de cycles. Revue d’Intelligence Artificielle (RIA), 27(1)(2013) 121-144.
[17] S. Bougleux, F. Dupé, L. Brun, B. Gaüzère, M. Mo-khtari. Shape similarity based on combinatorial maps and a tree pattern kernel. ICPR 2012, pp. 1602-1605.