HAL Id: hal-01584776
https://hal.archives-ouvertes.fr/hal-01584776v2
Submitted on 19 Sep 2017HAL is a multi-disciplinary open access
archive for the deposit and dissemination of sci-entific research documents, whether they are pub-lished or not. The documents may come from teaching and research institutions in France or abroad, or from public or private research centers.
L’archive ouverte pluridisciplinaire HAL, est destinée au dépôt et à la diffusion de documents scientifiques de niveau recherche, publiés ou non, émanant des établissements d’enseignement et de recherche français ou étrangers, des laboratoires publics ou privés.
Automatic reconstruction of urban wastewater and
stormwater networks based on uncertain manhole cover
locations
Benjamin Commandre, Nanée Chahinian, Jean-Stéphane Bailly, Marc
Chaumont, Gérard Subsol, Fabrice Rodriguez, Mustapha Derras, Laurent
Deruelle, Carole Delenne
To cite this version:
Benjamin Commandre, Nanée Chahinian, Jean-Stéphane Bailly, Marc Chaumont, Gérard Subsol, et al.. Automatic reconstruction of urban wastewater and stormwater networks based on uncertain manhole cover locations. ICUD: International Conference on Urban Drainage, Sep 2017, Prague, Czech Republic. pp.2345-2352. �hal-01584776v2�
Automatic reconstruction of urban wastewater and
stormwater networks based on uncertain manhole
cover locations
Benjamin Commandré1,8,Nanée Chahinian2*, Jean-Stéphane Bailly3, Marc Chaumont4, Gérard Subsol5,
Fabrice Rodriguez6, Mustapha DERRAS7, Laurent Deruelle7, Carole Delenne1,8.
1 Université de Montpellier, UMR HydroSciences Montpellier CC56, 163 rue Auguste Broussonnet, 34090 Montpellier, France 2 Institut de Recherches pour le Développement, UMR HydroSciences Montpellier, 34090 Montpellier, France.
3 AgroParisTech, UMR LISAH, Place Viala, 34080 Montpellier, France 4 Université de Nîmes, UMR LIRMM, Montpellier, France
5 CNRS, UMR LIRMM, Montpellier, France 6 IFSTTAR, GERS-LEE, Bougenais, France 7 Berger-Levrault, Montpellier, France 8 Inria, Lemon, Montpellier, France
* Corresponding author’s e-mail: nanee.chahnian@ird.fr
Summary
Accurate maps of sewer and stormwater networks in cities are mandatory for an integrated management of water resources. However, in many countries this information is unavailable or inaccurate. A new two-fold mapping method is put forward. The first step consists in using image processing techniques to detect buried network surface elements such as manhole covers on very high resolution aerial imagery. The second step consists in connecting them automatically using a tree-shaped graph constrained by industry rules. The method is tested on Prades-le-Lez, Southern France. The shape and topology of the reconstructed network are compared to the actual ones. The impact of the detected objects’ density is also assessed.
Keywords
Wastewater and stormwater networks, High resolution aerial imagery, Spanning tree, Network mapping, optimisation
Introduction
Getting accurate and updated information on the underground wastewater and stormwater networks is a cumbersome task, especially in cities undergoing urban expansion (Metje et al., 2007). With the development of smart city technologies, a growing number of towns are getting equipped with electronic sensors which are able to log and transmit data continuously. Getting accurate and updated information on the underground wastewater and stormwater networks is a cumbersome task, especially in cities undergoing urban expansion. With the development of smart city technologies, a growing number of towns are getting equipped with electronic sensors that are able to measure and transmit data continuously. It thus becomes easier to monitor the evolution of environmental variables in quasi real time and to make adequate decisions based on the prevailing conditions. However, data on the location and the geometric features of the water networks are still incomplete or missing. This is due in particular to the fact that many countries only recently passed bills on the localisation accuracy and precision that contractors need to report back when they undertake works in the vicinity of underground utility networks. In France for instance, this bill was passed in 2012 (JORF, 2012).
When working on a catchment where very little information about the network configuration is available, one solution may be to reconstruct it based on visible features such as manhole covers. These could be localized precisely and quickly by using new processing techniques in aerial imagery. Attempts have been made to find the optimal design configuration for wastewater and stormwater networks based on topographic and hydraulic constraints or economic costs (Walters, 1985; Izquierdo et al., 2008; Afshar, 2007; Moeini and Afshar, 2012). However, in real world applications, exogenous factors such as existing network branches may render these solutions quite inefficient. Some authors have generated virtual urban networks (Möderl et al., 2009; Sitzenfrei et al., 2010). Fewer attempts have been made in the literature to reproduce the layout of actual networks. Attempts have been made by Allard et al., 2013 and Blumensaat et al., 2012 but in both cases the node to link information was provided by urban databases or local operators. In this paper, we put forward a methodology to reconstruct a map of the wastewater or stormwater networks based on Very-High Resolution aerial imagery. The focus is put on the mapping algorithm. Readers interested in the detection of the network’s aerial elements are referred to Pasquet et al., 2016 and Commandré et al., 2017.
Materials and Methods
We assume that manhole covers are located accurately and are given as a set 𝑆 of georeferenced points 𝑃𝑖(𝑥𝑖, 𝑦𝑖). We assume that these points constitute the nodes of the network to be
reconstructed. Manhole localization may be done manually or automatically by using Very High Resolution aerial images as proposed in Pasquet et al., 2016 or in Commandré et al., 2017.
The reconstruction methodology is two-fold. In a first step, we compute a Delaunay triangulation based on the set 𝑆. This has the property that no point 𝑃𝑖 is inside the circumcircle of any triangle.
The edges of this triangulation give a consistent subset of all the possible connections between points of 𝑆, forming a planar graph. Then, we assign to each edge 𝑃𝑖𝑃𝑗 a value 𝑐(𝑃𝑖𝑃𝑗) which
defines the “cost” to make wastewater flowing from 𝑃𝑖 to 𝑃𝑗. Of course, the edge is oriented so
that 𝑐(𝑃𝑖𝑃𝑗) = −𝑐(𝑃𝑗𝑃𝑖). Several cost functions can be tested, two are presented in the following.
This first step results in a valued oriented graph.
In a second step, the Minimum Spanning Tree of this oriented graph is extracted by using the Kruskal algorithm (1956). The resulting network connects all the manholes without any cycles and with the minimal overall cost.
Two cost functions are tested in this study. The first one (Eq.1) favours small connections, following the road network and the steepest slope. We assume that the pipe slope is parallel to the terrain slope. This is a strong hypothesis, often used in hydrological modelling (Beven, 2011). Eq.1 corresponds to the older networks, which, unlike current industry rules, favoured a fast transfer of urban waters.
𝑐(𝑃𝑖𝑃𝑗) = (𝛼𝑙𝑙𝑖𝑗
max− (1 − 𝛼)
Δ𝑧𝑖𝑗
Δ𝑧max) + 𝛽 + 𝛾 (Eq. 1)
Where 𝑙𝑖𝑗: length of edge 𝑃𝑖𝑃𝑗[L];
𝑙max : maximum length of all the edges 𝑃𝑖𝑃𝑗 [L];
Δ𝑧𝑖𝑗: elevation difference between nodes 𝑃𝑖 and 𝑃𝑗 [L];
Δ𝑧max: maximum elevation difference between all connected nodes [L];
and , are penalty parameters when the edge intersects a road or a building. These penalties can be easily defined if we have the corresponding information in the GIS of the city.
The second cost function favours softer slopes, favouring gravity fed flow but within current industry rules used in France. Thus, the pipe slope can only vary between 2 ‰ and 7 ‰ (Eq. 2).
𝑐(𝑃𝑖𝑃𝑗) = 𝛼 𝑟𝑎𝑛𝑘(𝑙𝑖𝑗) 𝑚𝑎𝑥(𝑟𝑎𝑛𝑘(𝑙𝑖𝑗)) + (1 − 𝛼)𝛿 𝑟𝑎𝑛𝑘(|𝑆𝑖𝑗−𝑆𝑚|) 𝑚𝑎𝑥(𝑟𝑎𝑛𝑘(𝑆𝑖𝑗−𝑆𝑚)) + 𝛽 + 𝛾 (Eq.2)
Where 𝑆𝑖𝑗: slope of edge 𝑃𝑖𝑃𝑗 [L.L-1];
𝑆𝑚 : mean value of the interval [2 ‰, 7 ‰] [L.L-1]
𝛿 = 0 if the slope is in the interval, otherwise 𝛿 =1
The rank function is used to normalize the two first criteria within [0;1] interval. In this test case, because precise information is available on the location of buildings and roads, high penalty values are chosen, i.e. 𝛽 = 2 and 𝛾 = 5. These values may be adapted to the confidence that can be associated with the available information.
In the following, the reconstructed network is validated against the actual map using three criteria:
• Positional errors (Heipke et al., 1997); • network hierarchy (Shreve, 1966)
• distance to the outlet (Allard et al.2013).
The full procedure is automated. The Deep Learning code is written in python and its output is a text file consisting of 3 columns, object id, x coordinate and y coordinate. This file is input into the reconstruction code, which in turn outputs a shapefile and an attribute table for the created segments. A procedure to recreate the network’s full geometry i.e. pipe diameter, rim and invert elevation and depth is currently under development. Unlike examples found in the literature (Afshar, 2006 and 2007), our methodology does not involve any calibration to determine these values and relies only on hydraulic continuity rules and industry practices. Each hydraulic simulation code having its own data structure, the output format will be code specific and will have to be further adapted to the chosen code.
The methodology is tested on the town of Prades-le-Lez in southern France (34°41’51’’N; 3°51’53’’E). The validation database for the existing manhole locations is provided by Montpellier Métropole, the local operator. In total, there are 799 manhole covers and 23.45km of pipes in the study zone. All the geographical data used in this study are available through the French National Institute of Geography’s databases. To assess the efficiency of the reconstruction approach while accounting for the information loss that may stem from the automatic image processing techniques, a robustness test is carried out using a random selection of only half of the actual manhole locations (Commandré et al., 2017).
Results
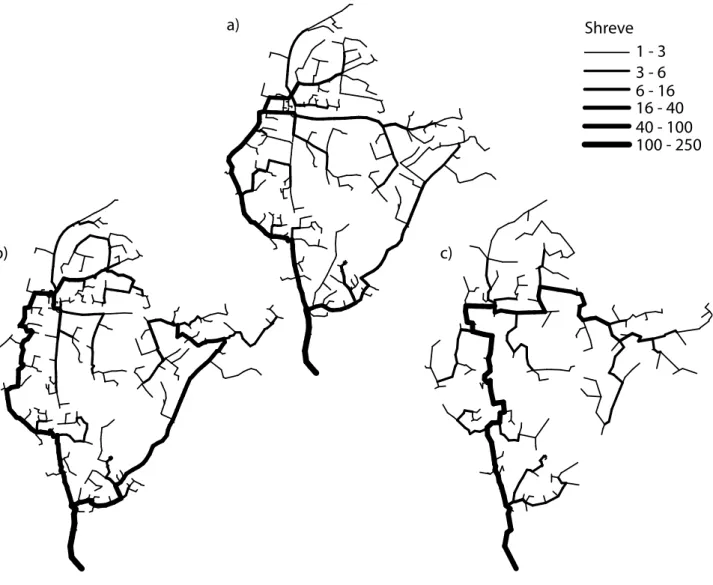
The actual and reconstructed networks (with all and half of the nodes) using the first cost function are presented in Fig.1. The best results are obtained for α ≥ 0.7. This means that distance weights more heavily than elevation when formulated as in Eq.1. When the entire data set is used, the reconstructed and actual networks have similar Shreve stream magnitudes (131 and 125 resp. at the outlet). Based on Heipke et al., (1997), Correctness = 0.89; Completeness = 0.84 and Quality = 0.76 (Tab. 1). These values drop to 0.44, 0.55 and 0.32 respectively when using only half of the nodes and the Shreve stream magnitude at the outlet drops to 84.
Fig. 1 Comparison between the actual and reconstructed networks using cost function 1 and =0.9,
=2 and =5. a) The actual network; b) The reconstructed network using the entire dataset; c) The
reconstructed network using half of the manhole cover locations.
The main dissimilarities rise from the fact that the reconstruction algorithm considers that flow is gravity fed while the actual network has a mainforce in the western part of the catchment. In addition, all nodes must be connected in a graph while there are isolated and unconnected sections in the operator's database. The Shreve magnitude is however much lower when using
only half of the nodes. Small segments and branches tend to disappear but the main collectors seem to be correctly represented. This also impacts the distance to the outlet (Fig. 2a) with shorter distances disappearing and longer distances appearing, especially when using only half of the nodes.
Tab. 1. Error criteria based on Heipke et al., 1997
Cost function Correctness Completeness Quality
Cost 1, all nodes 0.89 0.84 0.76
Cost 1, half of the nodes 0.44 0.55 0.32
Cost2, all nodes 0.90 0.93 0.84
Cost2, half of the nodes 0.54 0.66 0.42
Fig. 2 Frequency distribution of the distance to the outlet
The second cost function (Eq.2) yields better results: the completeness and quality (Heipke, 1997) increase to 93% and 84% respectively when using the entire data set and to 66% and 42% when using half of the nodes. Note that the correctness is also improved with more network branches created using the second cost function, namely with half of the nodes. This yields a higher coverage of the catchment area and a greater Shreve magnitude of 96. However, the network is disconnected in the eastern part of the catchment and the dissimilarities, due to the mainforce still persist in the western part of the catchment (Fig. 3b). The higher performance of the second function is also highlighted by the distances to the outlet, which are more similar to the ground truth. It thus appears that the second objective function produces more realistic results.
Fig. 3 Reconstructed networks using Cost function 2 with =0.9, =2 and =5. a) Using the entire
dataset; b) Using half of the manhole cover locations.
Discussion
We are currently testing our method using manhole covers which are automatically localized using VHR aerial images based on the Deep Learning procedure described in Commandré et al., 2017. We are confronted with a new challenge due to false positives i.e. manhole covers that do not exist in reality and that modify the distances between the network nodes.
The geometric feature which is most difficult to determine at this stage is the slope of the pipes which is also the most sensitive parameter both to control gravity fed flow and to model it. In the former examples, slope has been calibrated according to discharge and velocity. This procedure is not indicated in our case because the main point of reconstructing the network is to use it in urban hydrological modelling i.e. we would like to simulate discharge values based on measured precipitation data and not pre-determine them.
Slope is often one of the least documented variables in urban databases. In the case of Prades-le-Lez for instance, only 46% of the records have slope values and most of them are incoherent. This complicates both the validation process and the attempts made to find a rule or a method to predetermine slope values. Assuming that terrain and underground slopes are parallel would be a suitable hypothesis as long as there are no local constraints such as bedding planes or obstacles such as other buried networks, which could result in different layouts. Despite our best efforts, we could not find any open access geotechnical reports, which could give us an indication on bedding planes.
One solution would be to infer slope values based on the ground elevation and laying depths, knowing that in certain instances the laying depth is modified to insure adequate slope values and flow conditions. A linear relationship was established between the roadway elevation and the
pipe’s upstream and downstream inlet depths (R2=0,99) for Prades-le-Lez. This result is promising
and the method will be tested on other catchments. It does require accurate fine scale elevation data but a growing number of towns and county councils are providing this type of information through their open data web sites. In parallel, a sensitivity analysis of the hydraulic model will be carried out to assess the admissible error margin on slope based on catchment typology (topography, urban density and network configuration).
Conclusion and perspectives
A methodology to reconstruct a map of the wastewater and stormwater networks based on Very-High Resolution aerial images is put forward and tested on the town of Prades-le-Lez in southern France. The method consists in using manhole cover locations as the nodes of the network which will be reconstructed. A graph is constructed using a Delaunay triangulation and its Minimum Spanning Tree is extracted using the Kruskal algorithm. Two cost functions are tested in this work. The first one favours small connections, following the road network and the steepest slope. The second one favours softer slopes, favouring gravity fed flow but within current industry rules used in France.
The results indicate that the second function yields more realistic results in terms of Shreve magnitude and distance to the outlet and better scores for positional error. The reconstruction method is able to recreate a suitable network for the study zone. Future effort will be directed to i) the determination of the geometric features of the network, namely inlet elevation and pipe slope; ii) the inclusion of random noise on location and elevation data to account for uncertainty and the generation of probable network configurations; iii) the method’s validation on a greater number of catchments to insure its genericity.
Acknowledgement
This study is part of the project "Cart’Eaux" funded by the European Regional Development Fund (ERDF).
List of references
Afshar, M. H. 2006. Improving the efficiency of ant algorithms using adaptive refinement: Application to storm water network design. Advances in Water Resources, 29(9), 1371–1382. Afshar, M. H. 2007 Partially constrained ant colony optimization algorithm for the solution of constrained optimization problems: Application to storm water network design. Advances in Water Resources, 30(4), 954–965.
Allard, A., Chancibault, K., Andrieu, H. 2013 Construction du réseau de drainage de l’ensemble d’une agglomération urbaine – Cas de Nantes Est Construction of drainage network of an entire urban area - Case of Nantes East in Novatech 2013, Lyon France, pp. 1–10.
Beven, K. 2001. Rainfall-runoff modelling: the primer, Chichester, John Wiley and sons.
Blumensaat, F., Wolfram, M., and Krebs, P. 2012 Sewer model development under minimum data requirements. Environmental Earth Sciences, 65(5), 1427–1437.
Commandré, B., En-Nejjary,D., Pibre,L., Chaumont,M.,Delenne,C., and Chahinian,N. 2017. Manhole cover localization on aerial images with a deep learning approach in proceedings ISPRS Hannover Workshop 2017, Hannover, Germany, pp. 1-6.
Heipke, C., Mayer, H., Wiedemann, C., Sensing, R., and Jamet, O. 1997 Evaluation of Automatic Road Extraction. International Archives of Photogrammetry and Remote Sensing, 47–56.
Izquierdo, J., Montalvo, I., Pérez, R., and Fuertes, V. S. 2008 Design optimization of wastewater collection networks by PSO. Computers and Mathematics with Applications, 56(3), 777–784. JORF. 2012 Arrêté du 15 février 2012 pris en application du chapitre IV du titre V du livre V du code de l’environnement relatif à l’exécution de travaux à proximité de certains ouvrages souterrains, aériens ou subaquatiques de transport ou de distribution. Journal Officiel de la République Française, (45), 2988.
Kruskal, J. 1956. On the shortest spanning subtree of a graph and the traveling salesman problem in Proceedings of the American Mathematical Society. 7: 48–50.
Metje, N., Atkins, P., Brennan, M., Champan, D., Lim, H., Machell, J., Muggleton, J., Pennock, S., Ratcliffe, J., Redfern, M., Rogers, C., Saul, A., Shan, Q., Swingler, S., Thomas, A., N. 2007. Mapping the underworld: State of the art review. Tunnelling and underground space technology, 22, 568– 586.
Möderl, M., Butler, D., and Rauch, W. 2009 A stochastic approach for automatic generation of urban drainage systems. Water science and technology: a journal of the International Association on Water Pollution Research, 59(6), 1137–43.
Moeini, R. and Afshar, M. H. 2012 Layout and size optimization of sanitary sewer network using intelligent ants. Advances in Engineering Software, 51, 49–62.
Sitzenfrei, R., Möderl, M., Rauch, W. 2010 Graph-based approach for generating virtual water distribution systems in the software VIBe. Water Science & Technology: Water Supply, 10(6), 923– 932.
Pasquet, J., Desert, T., Bartoli, O., Chaumont, M., Delenne, C., Subsol, G., Derras, M., and Chahinian, N. 2016 Detection of Manhole Covers in High-Resolution Aerial Images of Urban Areas by Combining Two Methods. IEEE Journal of Selected Topics in Applied Earth Observations and Remote Sensing, 9(5), 1802–1807.
Shreve, R. L. 1966 Statistical Law of Stream Numbers. The Journal of Geology, 74(1), 17–37.
Walters, G. A. 1985 The Design of the Optimal Layout for a Sewer Network. Engineering Optimization, 9(1), 37–50.

![An Analytical Framework for the Steady State Impact of Carbonate Compensation on Atmospheric CO[subscript 2]](data:image/gif;base64,R0lGODlhAQABAIAAAP///wAAACH5BAEAAAAALAAAAAABAAEAAAICRAEAOw==)