HAL Id: hal-01248038
https://hal.archives-ouvertes.fr/hal-01248038
Submitted on 26 Dec 2016
HAL is a multi-disciplinary open access
archive for the deposit and dissemination of
sci-entific research documents, whether they are
pub-lished or not. The documents may come from
teaching and research institutions in France or
abroad, or from public or private research centers.
L’archive ouverte pluridisciplinaire HAL, est
destinée au dépôt et à la diffusion de documents
scientifiques de niveau recherche, publiés ou non,
émanant des établissements d’enseignement et de
recherche français ou étrangers, des laboratoires
publics ou privés.
Biochemical characteristics and bacterial community
structure of the sea surface microlayer in the South
Pacific Ocean
I Obernosterer, P Catala, R Lami, J Caparros, J Ras, A Bricaud, Christine
Dupuy, France van Wambeke, P Lebaron
To cite this version:
I Obernosterer, P Catala, R Lami, J Caparros, J Ras, et al.. Biochemical characteristics and
bacte-rial community structure of the sea surface microlayer in the South Pacific Ocean. Biogeosciences,
European Geosciences Union, 2008. �hal-01248038�
www.biogeosciences.net/5/693/2008/
© Author(s) 2008. This work is distributed under the Creative Commons Attribution 3.0 License.
Biogeosciences
Biochemical characteristics and bacterial community structure of
the sea surface microlayer in the South Pacific Ocean
I. Obernosterer1,2, P. Catala1,2, R. Lami1,2, J. Caparros1,2, J. Ras3, A. Bricaud3, C. Dupuy4, F. van Wambeke5,2, and P. Lebaron1,2
1Universit´e Pierre et Marie Curie-Paris6, UMR7621; F66650 Banyuls-sur-Mer, France
2CNRS, UMR7621, F-66650 Banyuls-sur-Mer, France
3CNRS, Laboratoire d’Oc´eanographie de Villefranche, 06230 Villefranche sur Mer, France; Universit´e Pierre et Marie
Curie-Paris6, Laboratoire d’Oc´eanographie de Villefranche, 06230 Villefranche sur Mer, France
4Universit´e de la Rochelle, Pˆole Science, CRELA, UMR6217, Av. Michel Cr´epeau, 17042 La Rochelle cedex 01, France
5Laboratoire de Microbiologie, G´eologie et Ecologie Marine (LMGEM), CNRS 6117, Universit´e de la M´editerran´ee, Campus
de Luminy – Case 901, 13288 Marseille cedex 9, France
Received: 10 July 2007 – Published in Biogeosciences Discuss.: 22 August 2007 Revised: 23 April 2008 – Accepted: 23 April 2008 – Published: 6 May 2008
Abstract. The chemical and biological characteristics of the
surface microlayer were determined during a transect across the South Pacific Ocean in October-December 2004. Con-centrations of particulate organic carbon (1.3 to 7.6-fold) and nitrogen (1.4 to 7-fold), and POC:PON ratios were consis-tently higher in the surface microlayer as compared to sur-face waters (5 m). The large variability in particulate or-ganic matter enrichment was negatively correlated to wind
speed. No enhanced concentrations of dissolved organic
carbon were detectable in the surface microlayer as com-pared to 5 m, but chromophoric dissolved organic matter was markedly enriched (by 2 to 4-fold) at all sites. Based on pigment analysis and cell counts, no consistent enrichment of any of the major components of the autotrophic and het-erotrophic microbial community was detectable. CE-SSCP fingerprints and CARD FISH revealed that the bacterial com-munities present in the surface microlayer had close similar-ity (>76%) to those in surface waters. By contrast,
bacte-rial heterotrophic production (3H-leucine incorporation) was
consistently lower in the surface microlayer than in surface waters. By applying CARD-FISH and microautoradiogra-phy, we observed that Bacteroidetes and
Gammaproteobac-teria dominated leucine uptake in the surface microlayer,
while in surface waters Bacteroidetes and
Alphaproteobacte-ria were the major groups accounting for leucine
incorpora-tion. Our results demonstrate that the microbial community in the surface microlayer closely resembles that of the surface
Correspondence to: I. Obernosterer
(ingrid.obernosterer@obs-banyuls.fr)
waters of the open ocean. Even a short residence in the sur-face microlayer influences leucine incorporation by different bacterial groups, probably as a response to the differences in the physical and chemical nature of the two layers.
1 Introduction
The air-water interface is a site of dynamic exchange pro-cesses of gaseous, liquid and particulate matter between the atmosphere and aquatic environments (Liss et al., 1997). The atmospheric-aquatic boundary layer, comprised of a series of sub-layers that are generally summarized as the sea surface microlayer (1–1000 µm), plays a pivotal role in these trans-fer processes. The enrichment of the surface microlayer in organic and inorganic matter affects physical features of the air-sea interface such as the surface tension, and thus air-sea fluxes (Frew, 1997). The potential contribution of biologi-cal activity in the surface microlayer to air-water exchange processes is far less known. The partial pressure of CO2 in the top layer (2 cm) of the ocean was recently reported to be linked to microbial community metabolism (Calleja et al., 2005). The consistently enhanced rates of respiration in samples collected from the surface microlayer in different coastal and offshore marine environments support this no-tion (Garab´etian, 1990; Obernosterer et al., 2005; Reinthaler et al., 2008). The biogenic gases dimethylsulfoxide (DMSO) and dimethylsulfoniopropionate (DMSP) were markedly en-riched in the surface microlayer as compared to surface wa-ters during calm wind conditions (Zemmelink et al., 2005). These observations could indicate that important biological
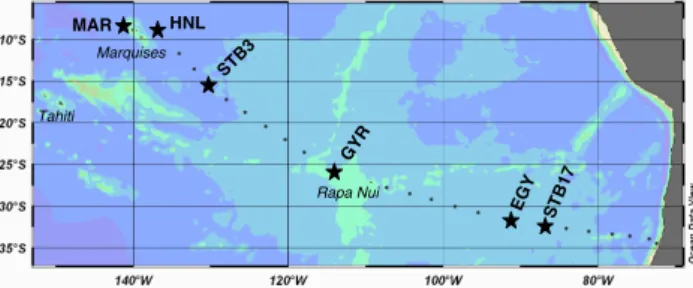
MAR HNL GY R STB 3 ST B1 7 ms-bgd-2007-0093-f01 EG Y Marquises Tahiti Rapa Nui
Fig. 1. Cruise track and sampled stations of the BIOSOPE
(BIo-geochemistry and Optics South Pacific Ocean Experiment) project. Stations where the sea surface microlayer was collected are indi-cated by stars.
processes at the air-water interface differ from those in sur-face waters, however, their impact on air-sea fluxes remains to be determined.
Whether organisms inhabiting the surface microlayer act as sources or sinks for various components will strongly de-pend on the abundance and activity of the different mem-bers of the microbial community. Reports on these biological features display large variability among studies, with enrich-ments, depletions or no differences observed (Agogu´e et al., 2004 and references therein). This is most likely due to the spatial and temporal variability in the development of the sur-face microlayer. The utilization of different sampling devices that collect layers of varying thickness could also account for the differences observed. Another important issue to be ad-dressed is the specificity of the autotrophic and heterotrophic community inhabiting the surface microlayer. Phytoneuston has long been viewed as a unique group of organisms in-habiting the surface film of aquatic environments (see review by Zaitsev, 1997), but this idea has recently been challenged. Based on the tight relationship between the abundance of dif-ferent groups of the plankton community in surface waters and that in the surface microlayer, the upward transport of organisms by physical processes rather than the in situ de-velopment has been suggested the source for their presence in the surface microlayer (Joux et al., 2006).
Only recently have molecular tools allowed to address the question whether heterotrophic bacteria inhabiting the sur-face microlayer display a specific community structure. The only two studies available up to date reveal contrasting con-clusions (Agogu´e et al., 2004; Franklin et al., 2005). Based on different sampling techniques and molecular approaches, the bacterial community structure associated with the surface microlayer was found to be similar in the coastal Mediter-ranean Sea (Agogu´e et al., 2004) or distinctly different in the North Sea (Franklin et al., 2005) to that from surface waters. The objective of the present study was to evaluate by two complementary molecular-based techniques whether the top layer of the ocean is inhabited by a distinct bacterioneuston community. Our aim was to describe the bacterial commu-nity structure in relation to major biological and chemical
features that characterized the surface microlayer in contrast-ing marine environments across the South Pacific Ocean.
2 Material and methods
2.1 Study sites
The BIOSOPE (BIogeochemistry and Optics South Pacific Experiment) cruise track crossed the South Pacific Ocean
from the Marquise Islands to Chile (Claustre et al., 20081).
The surface microlayer was sampled at 6 stations ranging from oligotrophic to ultraoligotrophic in the center of the South Pacific Gyre (Fig. 1). The sampled sites were lo-cated in the vicinity of the Marquise Islands (Station MAR), in High-Nutrient-Low-Chlorophyll waters east of the Mar-quise Islands (Station HNL), in the center of the South Pa-cific Gyre (Station GYR), in the eastern part of the South Pacific Gyre (Station EGY), and in the western (STB3) and eastern (STB17) part of the South Pacific Ocean (Fig. 1, Ta-ble 1). Wind speed was recorded every 10 s. Sea surface microlayer collection was done during calm wind conditions
(<3 m s−1)and the mean wind speed 6h prior to sampling
varied between 0.5 and 2.6 m s−1at the different stations.
2.2 Surface microlayer sampling
We used a metal screen (Garrett, 1965) to collect the surface microlayer (250–400 µm) as described previously (Obernos-terer et al., 2005). Sampling was done from a dinghy, roughly 0.5 nautical miles upwind from the research vessel. To pre-vent the collection of water adhering to the frame, the first 100 ml of water draining from the metal screen were rejected. Prior to collection, the metal screen was rinsed several times with the respective sample water. Surface water was col-lected at 5 m using a 5-l Niskin bottle. Samples colcol-lected in the surface microlayer and in surface waters were trans-ferred to 9-l polycarbonate (PC) carboys. Prior to sampling, the PC carboys were rinsed with 1 N HCl, Milli-Q water and 3 times with the respective water samples.
2.3 Particulate organic carbon (POC) and nitrogen (PON)
and dissolved organic carbon (DOC)
For POC-analysis, duplicate 700–1000-ml samples were
fil-tered onto combusted (450◦C for 5 h) Whatman GF/F filters.
The filters were rinsed with ∼2 ml of Milli-Q water to
re-move salts, then stored frozen (–20◦C) until analysis. POC
and PON measurements were performed on a 2400 Perkin Elmer CHN analyzer. The error for duplicate samples of POC and PON was, on average, 4% and 12%, respectively.
1Claustre, H., Sciandra, A., and Vaulot, D.: Introduction to the
special section: bio-optical and biogeochemical conditions in the South East Pacific in late 2004 – the BIOSOPE cruise, submittedto Biogeosciences Discuss., 2008.
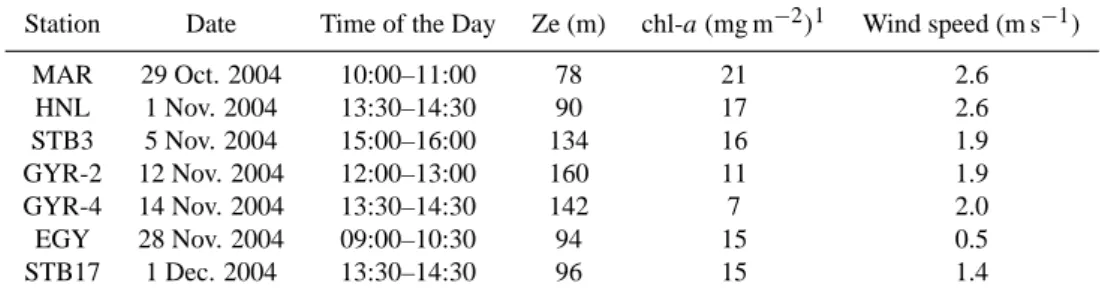
Table 1. Date and local time of the day of the surface microlayer collection and general characteristics of the study sites. Phytoplankton
biomass (chl-a) is integrated over the euphotic zone. Mean wind speed for 6 h prior to the surface microlayer collection is given. Ze – depth of the euphotic zone.
Station Date Time of the Day Ze (m) chl-a (mg m−2)1 Wind speed (m s−1)
MAR 29 Oct. 2004 10:00–11:00 78 21 2.6 HNL 1 Nov. 2004 13:30–14:30 90 17 2.6 STB3 5 Nov. 2004 15:00–16:00 134 16 1.9 GYR-2 12 Nov. 2004 12:00–13:00 160 11 1.9 GYR-4 14 Nov. 2004 13:30–14:30 142 7 2.0 EGY 28 Nov. 2004 09:00–10:30 94 15 0.5 STB17 1 Dec. 2004 13:30–14:30 96 15 1.4
1Data are from Ras et al. (2008)
For DOC-analysis, GF/F filtered samples were preserved
by adding 100 µl H3PO4(35%) to 20 ml subsamples. The
samples were stored in combusted glass vials with
Teflon-lined screw caps in the dark at 4◦C until analyzed. DOC
measurements were performed on a Shimadzu TOC-V-CSH (Benner and Strom, 1993). Prior to injection, DOC samples
were sparged with CO2-free air for 6 min to remove
inor-ganic carbon. Hundred µl of sample were injected in tripli-cate and the analytical precision was ∼2%. Standards were prepared with acetanilid. The error for duplicate DOC sam-ples was, on average, 1%.
2.4 Chromophoric Dissolved Organic Matter (cDOM)
The absorption coefficients of cDOM were measured throughout the ultraviolet-visible domain (280–735 nm) us-ing the multiple path length, liquid core waveguide system UltraPath (WPI Inc.), with a pathlength of 2 m. Samples were filtered immediately after collection, in dim light, us-ing 0.2 µm Millipore filters pre-rinsed with Milli-Q water. Filtered samples were then placed in the automatic sam-pler (maintained in the dark), and pumped into the sample cell of the Ultrapath instrument. Absorbance spectra were measured with reference to a salt solution (35 PSU), pre-pared with High Pressure Liquid Chromatographie (HPLC)-quality water and granular NaCl, to match the salinity and refractive index of samples. Between measurements, the cell was flushed successively with diluted detergent, high reagent grade MeOH, 2 M HCl, and Milli-Q water, and the cleanli-ness of the tube was controlled using a reference value for the transmittance of the reference water. As the absorption coefficients of pure water vary with temperature (especially in the infra-red), we minimized the temperature differences between the reference and the sample. The presence of mi-crobubbles in the sample cell was also avoided by using a peristaltic pump and a debubbler.
2.5 Pigment analysis
Three to six liters of seawater were filtered onto GF/F fil-ters (25 mm diameter) and the filfil-ters were stored in liquid ni-trogen until HPLC-analysis according to Van Heukelem and Thomas (2001). A detailed description of the pigment ex-traction and analysis is given in Ras et al. (2008).
2.6 Enumeration of heterotrophic bacteria, autotrophic
prokaryotic and eukaryotic cells by flow cytometry Three-ml subsamples were fixed with 2% formaldehyde
(fi-nal conc.), stored for 30 min at 4◦C, then frozen in
liq-uid nitrogen and stored at –80◦C until analysis. For flow
cytometric analysis of heterotrophic bacteria, samples were stained with the nucleic acid dye SYBR Green-I (Molecu-lar Probes) at 0.025% (vol/vol) final concentration (Lebaron et al., 2001). Counts were performed on a FACS-Calibur flow cytometer (Becton Dickinson, San Jose, CA) equipped with a 488 nm wavelength, 15 mW Argon laser. Stained bac-teria were excited at 488 nm wavelength and discriminated according to their right angle-light scatter (SSC, related to cell size) and green fluorescence at 530±15 nm wavelength. Based on a plot of green versus red fluorescence we dis-tinguished photosynthetic from non-photosynthetic prokay-otes. Enumeration of autotrophic cells was performed ac-cording to Marie et al. (2000). Synechococcus spp. was dis-criminated by its strong orange fluorescence (585±21 nm ) and pico- and nanoeukaryotes were discriminated by their scatter signals of the red fluorescence (>670 nm). The co-efficient of variation among replicate samples is generally
<5% (Agogu´e et al., 2004). To convert bacterial
abun-dance to bacterial biomass we applied a conversion factor
of 12.4 fg C cell−1(Fukuda et al., 1998).
2.7 Enumeration of nanoflagellates
Plastidic and heterotrophic nanoflagellates were determined after staining with Primulin according to Sherr et al. (1993).
Twenty to one hundred ml of raw seawater were fixed with
2% formaldehyde (final conc.) and filtered onto 0.8 µm
black PC membrane filters (25 mm filter diameter). The fil-ter was subsequently rinsed with two 1-ml aliquots of 0.1 M Trizma HCl (pH 4.0). The filter was covered with Primulin
(250 g ml−1, 0.1 M Trizma-HCl) and incubated in the dark
for 15 min. After removing the Primulin solution by filtra-tion, the filter was rinsed again with 0.1 M Trizma HCl, be-fore being mounted onto a glass slide. Heterotrophic and au-totrophic nanoflagellates were subsequently visualized using UV and blue light excitation, respectively, using an epifluo-rescence microscope (x 1000, Zeiss, Axiovert Mot plus).
2.8 Bacterial heterotrophic production
Bacterial production was determined by [3H] leucine
in-corporation applying the centrifugation method (Smith and Azam 1992). Briefly, 1.5 ml samples were incubated with
a mixture of [4,5–3H]leucine (Amersham, specific activity
160 Ci mmol−1)and nonradioactive leucine at final
concen-trations of 7 and 13 nM, respectively. Samples were incu-bated in the dark at the respective in situ temperatures for 2–3 h. Linearity of leucine incorporation over this time pe-riod was tested at the three stations. Incubations were ter-minated by the addition of trichloracetic acid (TCA, Sigma) to a final concentration of 5%. To facilitate the precipitation of proteins, bovine serum albumine (BSA, Sigma, 100 mg
l−1final concentration) was added prior to centrifugation at
16 000 g for 10 min (Van Wambeke et al., 2002). After dis-carding the supernatant, 1.5 ml of 5% TCA were added and the samples were subsequently vigorously shaken on a vortex and centrifuged again. The supernatant was discarded, 1.5 ml of PCS liquid scintillation cocktail (Amersham) added and the radioactivity incorporated into bacterial cells was counted aboard with a Packard LS 1600 Liquid Scintillation Counter. The variation between two replicate measurements was on average ±10% from the mean.
2.9 Catalyzed reporter deposition – fluorescence in situ
hybridization and microautoradiography (MICRO-CARD-FISH)
At three stations (MAR, GYR and STB17) the bacterial community structure and the activity of the major bacte-rial groups was determined applying MICRO-CARD-FISH. Raw seawater samples (50 ml) were incubated with [4,5–
3H]leucine (Amersham, specific activity 160 Ci mmol−1)at
a final concentration of 20 nM in the dark at in situ temper-ature for 2–4 h. The incubation was terminated by adding paraformaldehyde (PFA, 2% final concentration), and con-trols were fixed with PFA (2% final concentration) prior to
incubation with 3H-leucine. Samples were stored at 4◦C
in the dark for 12 h before filtration onto 0.2 µm PC filters (25 mm filter diameter, Nuclepore). The filters were stored
at –20◦C until treated by CARD-FISH using the protocols
described in Pernthaler et al. (2002) and Sekar et al. (2003). Filters were embedded in low-melting-point agaraose (0.2% final concentration), dried, dehydrated (96% EtOH, 1 min)
and treated with lysozyme (Fluka, 10 mg ml−1, 100 mM Tris
[pH 8], 50 mM EDTA) for 1h at 37◦C to allow cell wall
permeabilization. The filters were subsequently washed in Milli-Q water and dehydrated in ethanol (96%) for 1 min.
We determined the relative contribution of the major bac-terial groups using the probes ALF968 (5’-GGT AAG GTT CTG CGC GTT-3’) for Alphaproteobacteria, GAM42a (5’-GCC TTC CCA CAT CGT TT-3’) for
Gammaproteobacte-ria, and CFB319a (5’-TGG TCC GTG TCT CAG TAC-3’)
for Bacteroidetes, and a mix of the the probes EUB338I (5’-GCT GCC TCC CGT AGG AGT-3’), EUB338II (5’-GCA GCC ACC CGT AGG TGT-3’) and EUB338III (5’-GCT GCC ACC CGT AGG TGT-3’) for the identification of
Bac-teria. The negative control (NON338, 5’-ACT CCT ACG
GGA GGC AGC-3’) was used to determine non-specific binding. Probe working solution was added at a final
con-centration of 2.5 ng µl−1and the hybridization was done at
35◦C for 2 h.
For the microautoradiographic development, we followed the protocol described by Cottrell and Kirchman (2000). Briefly, the previously hybridized filter sections were placed onto slides coated with photographic emulsion (type NTB-2; Kodak, diluted 1:1 with Milli-Q water). The photographic
emulsion was heated at 43◦C for 30–60 min before
utiliza-tion. The slides were then dried (for 15 min) on an ice-cold aluminum plate and kept in a dark box during exposure at
4◦C. The slides were developed for 2 min (Dektol developer
[1:1 dilution with Q water], Kodak), rinsed with Milli-Q water for 10 s, fixed for 6 min (Fixer Tmax, Kodak) and again rinsed for 6 min in Milli-Q water. After having dried the slides in a desiccator for 12 h, filter sections were peeled off and the cells were counterstained with a DAPI mix (4 parts Citifluor, 1 part Vectashield (Vector Laboratories) with
DAPI at a final concentration of 0.5 µg ml−1). To determine
the appropriate exposure time for samples collected in the surface microlayer and surface waters, slides were developed after 12 h, 24 h, 36 h, 48 h, 72 h and 96 h at Stations GYR and STB17. At both stations, the percent of DAPI-stained cells associated with silver grains increased during the first 48 h and remained stable thereafter. We subsequently used an exposure time of 48 h. The slides were examined un-der a Olympus AX70 epifluorescence microscope and an image analysis system as described in Cottrell and Kirch-man (2003). For each slide, 20 fields were enumerated, re-sulting in a minimum of 500 DAPI-stained cell counts. Mean values and the standard errors among the cell counts of 20 fields are presented. To determine the contribution of differ-ent bacterial groups to leucine incorporation, the number of probe-positive cells associated with silver grains was divided by the number of DAPI-stained cells associated with silver grains.
2.10 Capillary electrophoresis – single strand conforma-tion polymorphism (CE-SSCP)
At all stations CE-SSCP was performed on DNA extracts to obtain molecular fingerprints of the surface microlayer and surface waters. Seawater samples (<3 µm size frac-tion, 0.5 l) were filtered onto 0.2 µm PC filters (47 mm,
Nu-clepore) and filters were kept frozen (–80◦C) until nucleic
acid extraction. Nucleic Acid extraction was performed as described previously (Ghiglione et al., 2005). Primers used for polymeric chain reaction (PCR) were the specific bacte-rial primers w49dir (5’ –A CGG TCC AGA CTC CTA CGG G– 3’; Delb`es et al., 2000) and w34rev (5’ –TTA CCG CGG CTG CTG GCA C– 3’; Lee et al., 1996) synthesized com-mercially (Eurogentec). Primer w34 was fluorescently 5’-labelled with phosphoramidite (TET, Eurogentec). Primers were designed to target a short sequence (around 200 pb), al-lowing a good resolution of the CE-SSCP signal (V3 region of 16SrDNA, Escherichia coli positions 329–533, .Brosius et al., 1981). Amplifications were performed in 50 µl, with 1 µl of DNA, 0.3 µM of each primer, 0.8 mM dNTPs, and 1X buffer (Promega), before adding 1.0 U of pfu polymerase (Promega). Samples were amplified (Robocycler 96,
Strata-gene) with the following program : 94◦C (3min) for
denatu-ration, 25 cycles at 94◦C (denaturation, 30 s), 61◦C
(anneal-ing, 25 s), 72◦C (extension, 30 s), before a final extension at
72◦C (10 min). The amplicon size was checked on agarose
gel (2%), and the PCR products were purified using a PCR purification kit (Qiagen).
2.10.1 CE-SSCP electrophoresis
CE-SSCP was performed according to a previously described protocol (Ghiglione et al., 2005) on the Genetic Analyser ABI310 (Applied Biosystems). Briefly, each sample was diluted between 2- and 40-fold in sterile Tris-borate-EDTA
(TBE)(10 mM Tris, 1mM EDTA) to obtain 10 ng µl−1 of
PCR product. From this resulting dilution, 1 µl of PCR
product was mixed with 0.1 µl of an internal size stan-dard (GeneScan-400 Rox, Applied Biosystems) and 18.9 µl
of deionised formamide (Applera), before heating (94◦C,
10 min) and cooling in a water/ice bath (10 min). Samples were electrokinetically injected (5 s, 12 kV) into a capillary (47 cm×50 µm) filled with 5.6% GeneScan polymer (Ap-plied Biosystems) gel containing 10% autoclaved glycerol in sterile TBE buffer (90 mM Tris-borate, 2 mM EDTA [pH
8.0]). Samples migrated for 30 min (15 kV, 30◦C).
Phospho-ramidite (TET)-labelled fragments were detected by a laser with a virtual filter C (detection wavelengths 532, 537 and 584 nm). Data collection was performed with the ABI Prism 310 collection software (Applied Biosystems).
0
1
2
3
4
5
6
7
8
0
0.5
1
1.5
2
2.5
3
POC PONRatio of particulate organic matter
in the SML to SW
Wind speed (m s-1)
ms-bgd-2007-0093-f02
Fig. 2. Relation between the ratio of particulate organic carbon
(POC) and nitrogen (PON) in the surface microlayer (SML) to that in surface waters (SW) and the mean wind speed 6 h prior to sam-pling.
2.10.2 CE-SSCP fingerprints analysis
Electrophoregrams were aligned with the GeneScan anal-ysis software by fixing positions of the internal standard (GeneScan-400 Rox, Applied Biosystems) with a second-order least-square curve (i.e. linear regression). Peak detec-tion on environmental fingerprints was realized using the first derivative of a polynomial curve fitted to the data within a window that was centred on each data point (GeneScan anal-ysis software). Peaks overlapping were observable on the obtained fingerprints, to avoid artefacts in peak enumeration we used a high polynomial degree (10) to increase peak sen-sitivity. The peak amplitude threshold was fixed at 50 and applied for both Rox and TET fluorescent dyes.
3 Results
3.1 Particulate and dissolved organic matter
The surface microlayer was markedly enriched in particulate organic matter, by factors varying between 1.3 and 7.6 for POC, and between 1.4 and 7 for PON (Table 2). The vari-ability in particulate organic matter enrichment was largely explained by wind history. The ratio of POC in the surface microlayer to that of surface waters (i.e. the enrichment fac-tor) was negatively correlated to the mean wind speed 6 h
prior to sampling (r2=0.97, n=6, p< 0.0001, Fig. 2). This
was also the case for the PON enrichment factor (r2=0.93,
0 0.05 0.1 0.15 0.2 0 0.05 0.1 0.15 0.2 0 0.05 0.1 0.15 0.2 0 0.05 0.1 0.15 0.2 Pigment concentration in SW (µg l-1 ) Pigment concentration in SML (µg l -1) 0 0.05 0.1 0.15 0.2 0 0.05 0.1 0.15 0.2 0 0.05 0.1 0.15 0.2 0 0.05 0.1 0.15 0.2 a 0 2 4 6 8 10 0 2 4 6 8 10 0 2 4 6 8 10 0 2 4 6 8 10 0 2 4 6 8 100 2 4 6 8 10 0 2 4 6 8 10 0 2 4 6 8 10 0 2 4 6 8 10 0 2 4 6 8 100 2 4 6 8 10 0 2 4 6 8 10 Cell abundance in SW (x 105 -108 cells l-1 ) Cell abundance in SML (x10 5-10 8 cells l -1) b ms-bgd-2007-0093-f03 Fig. 3. Relation between (a) pigment concentration and (b) the
abundance of autotrophic and heterotrophic cells in the surface mi-crolayer (SML) and in surface waters (SW). Data of all pigment analyses and all cell counts are pooled. (a) filled circles: chl-a; empty circles: chl-b; filled squares: chl-c; empty squares: Divinyl chl-a. (b) filled circles: Synechococcus spp. (×107l−1); empty circles: Pico/Nanoeukaryotes (×106l−1); filled squares: Plastidic Nanoflagellates (×106l−1); empty squares: Heterotrophic bac-teria (×108l−1); empty triangles: Heterotrophic nanoflagellates (×105l−1). Dashed line indicates the 1:1 line.
of particulate organic matter in the surface microlayer and in surface waters was detectable. C/N ratios of particulate organic matter were by 1.1 to 1.6-fold higher in the surface microlayer than at 5 m, indicating preferential accumulation of carbon-rich organic matter. Concentrations of dissolved organic carbon did not display any particulate pattern (Ta-ble 2). By contrast, cDOM was enriched in the surface mi-crolayer by 2-fold at Stations MAR, HNL, STB3 and GYR, and by 4-fold at Station EGY (Table 2).
3.2 Autotrophic and heterotrophic components of the sea
surface microlayer
The components of the microbial community determined in the present study did not exhibit any consistent pattern in terms of biomass or abundance in the surface microlayer as compared to surface waters (Fig. 3). Concentrations of chlorophyll-a in the surface microlayer exceeded those at 5 m at Stations MAR and EGY by factors of 1.2 and 1.5, respectively. At Stations HNL, GYR and STB17 concentra-tions of chlorophyll-a in the surface microlayer were sim-ilar or depleted compared to those at 5 m (Table 3). The group specific pigments chlorophyll-b (Chlorophytes) and chlorophyll-c (Chromophytes) revealed a similar trend as chlorophyll-a with pronounced enrichments only at Station EGY (by 2.8- and 1.9-fold, respectively). Concentrations of divinyl chlorophyll-aindicated an enrichment of
Prochloro-coccus in the surface microlayer at Stations MAR (by
1.8-fold) and EGY (by 1.3-1.8-fold), similar to that of
Synechococ-cus based on cell abundances (by 1.2- and 1.4-fold,
respec-tively) (Tables 3 and 4). Pico- and nanoeukaryotes displayed similar abundances in the surface microlayer and in sur-face waters. Plastidic and heterotrophic nanoflagellates were more abundant (by 1.2- to 4-fold) in the surface microlayer
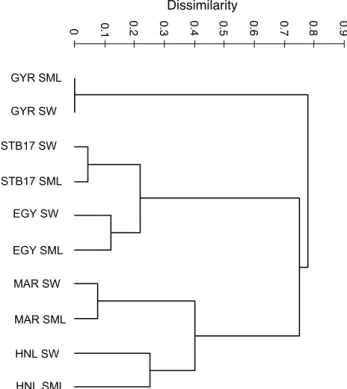
0 0.1 0.2 0.3 0.4 0.5 0.6 0.7 0.8 0.9 Dissimilarity GYR SML GYR SW STB17 SW STB17 SML EGY SW EGY SML MAR SW MAR SML HNL SW HNL SML ms-bgd-2007-0093-f04 Fig. 4. UPGMA dendrogram generated from the CE-SSCP profiles
from the surface microlayer (SML) and surface waters (SW). Scale bar indicates the dissimilarity.
in 3 out of 5 surface microlayer samplings. Phaeopigments were below the limit of detection in the surface microlayer and in surface waters of all stations. No marked enrichment of heterotrophic bacterial abundances was detectable in the surface microlayer (mean 1.04, range 1.01–1.08), except for Station EGY where abundances exceeded those at 5 m by 1.3-fold (Table 4).
3.3 Bacterial community structure
The CE-SSCP fingerprints revealed overall close similarity (>76%) of the bacterial community structure between the surface microlayer and surface waters (Fig. 4). The UPGMA dendrogram is based on the comparison of the presence or absence of peaks (thereafter referred to as ribotype) among the CE-SSCP fingerprints. The number of peaks represented on the fingerprints ranged between 13 and 24. Minor, but noticeable differences between the surface microlayer and surface waters were detectable at Stations EGY and STB17, owing to the presence of two distinct ribotypes in the surface microlayer. At Station HNL, a few minor ribotypes distin-guished the CE-SSCP profile from the surface microlayer to that of surface waters.
At Stations MAR, GYR and STB17 we compared the rela-tive contribution of major bacterial groups in the surface mi-crolayer and surface waters, using in situ hybridization. The percent DAPI-stained cells identified by a combination of the
Table 2. Concentration of particulate organic carbon (POC) and nitrogen (PON), dissolved organic carbon (DOC) and chromophoric
dis-solved organic matter (cDOM) in the sea surface microlayer (SML) and in surface waters (SW). n.d. – not determined. MAR HNL STB3 GYR-2 EGY STB17 POC (µM) SML 10.3 11.5 14.8 7.3 25.7 23.0 SW 5.4 8.8 4.0 2.8 3.4 4.7 PON (µM) SML 1.0 1.0 1.2 0.5 4.2 2.8 SW 0.7 1.0 0.5 0.3 0.6 0.8 POC:PON SML 10.8 11.5 12.7 14.6 6.2 8.3 SW 7.6 8.5 7.9 8.4 5.2 6.0 DOC (µM) SML 80 85 94 81 105 88 SW 85 92 88 78 99 88 cDOM (Abs350 nmm−1) SML 0.072 0.097 0.051 0.036 0.073 n.d. SW 0.037 0.050 0.027 0.016 0.014 n.d.
Table 3. Concentrations of chlorophyll-a (chl-a), b (chl-b), c (chl-c) and Divinyl chla in the sea surface microlayer (SML) and surface
waters (SW). BD – below limit of detection.
MAR HNL GYR-4 EGY STB17 chl-a (µg l−1) SML 0.201 0.075 0.013 0.095 0.12 SW 0.168 0.128 0.021 0.064 0.11 chl-b (µg l−1) SML 0.017 0.011 0.001 0.011 0.124 SW 0.017 0.020 0.001 0.004 0.110 chl-c (µg l−1) SML 0.047 0.003 0.001 0.015 0.024 SW 0.033 0.016 0.002 0.008 0.023 Divinyl chl-a (µg l−1) SML 0.048 0.042 0.003 0.010 BD SW 0.027 0.049 0.004 0.008 BD 0 10 20 30 40 50 60 70 80 SML SSW b 0 10 20 30 40 50 60 70 80 SML SSW Bacteria Alphaproteobacteria Gammaproteobacteria Bacteroidetes c 0 10 20 30 40 50 60 70 80 SML SSW
Relative abundance of bacterial groups
(% of DAPI-stained cells)
a
ms-no-f05 Fig. 5. Relative contribution of Bacteria and major bacterial groups
to total DAPI-stained cells in the surface microlayer (SML) and in surface waters (SW) at Stations MAR (a), GYR (b) and STB17 (c). The control probe NON was on average 2% of DAPI-stained cells. Mean values ±SE are given.
three probes EUB338I, EUB338II and EUB338III varied be-tween 46–54% and 51–65% in the surface microlayer and in surface waters, respectively (Fig. 5). Our detection rate of
Bacteria is in the lower range of values reported in the
litera-ture, and it is also lower than those we observed in the coastal and off-shore Mediterranean Sea and in the Southern Ocean (70–90%, unpublished data). The low metabolic activity and the small size of bacterial cells, and possibly also an
inef-ficient cell-wall permeabilization could account for the low detection rate observed in the present study.
The slightly lower percentage of DAPI-stained cells iden-tified as Bacteria in the surface microlayer probably reflects the lower heterotrophic bacterial activity in this layer as com-pared to surface waters (see below). The sum of the rela-tive contributions of Alpha-, and Gammaproteobacteria and
Bacteroidetes amounted to 82±20% (mean±SD, n=3) in the
surface microlayer and equaled (mean±SD, 100±10%) the percent EUB positive cells in surface waters. Overall, no differences in the relative contribution of the major bacte-rial groups were detectable between the surface microlayer and surface waters (Fig. 5). At Station MAR, Alpha-, and
Gammaproteobacteria and Bacteroidetes had similar relative
contributions in both layers. At Station GYR Bacteroidetes were the dominant phylogenetic group (33 to 39% of DAPI-stained cells), and at STB17 Bacteroidetes (16 to 19% of DAPI-stained cells) and Gammaproteobacteria (20 to 22% of DAPI-stained cells) dominated in terms of abundance the heterotrophic bacterial community.
Table 4. Abundance of the major components of the microbial community in the sea surface microlayer (SML) and surface waters (SW).
n.d. – not determined; b.d. – below limit of detection. * - data are based on flow cytometric analysis; ** – data are based on microscopic observations.
MAR HNL STB3 GYR-2 GYR-4 EGY STB17
Synechococcus spp.* (×107l−1) SML 5.8 1.2 0.3 0.1 0.02 0.7 0.2 SW 4.9 1.4 0.3 0.1 0.04 0.5 0.2 Pico/Nanoeukaryotes* (×106l−1) SML 3.9 5.1 0.8 0.5 0.4 3.0 3.9 SW 3.6 5.7 1.4 0.6 0.4 2.6 3.7 Plastidic Nanoflagellates** (×105l−1) SML 19.9 21.5 5.3 0.4 0.4 n.d. n.d. SW 16.6 22.2 3.5 0.1 0.6 n.d. n.d. Heterotrophic bacteria* (×108l−1) SML 9.6 8.9 6.5 3.8 3.6 9.0 8.4 SW 9.4 8.7 6.1 3.7 3.5 7.0 7.8 Heterotrophic nanoflagellates** (×105l−1) SML 7.6 5.4 1.1 1.8 2.4 n.d. n.d. SW 4.2 2.7 1.7 b.d. 2.4 n.d. n.d.
3.4 Contribution of major bacterial groups to bulk leucine
incorporation
By contrast to the heterotrophic bacterial abundance, distinct differences in bacterial heterotrophic production, as
deter-mined by3H-leucine incorporation, were detectable between
the two layers. Bacterial leucine incorporation in the sur-face microlayer accounted for 5% to 80% (n=6) of that at 5 m and the inhibition of bacterial heterotrophic production in the surface microlayer was most pronounced at low wind speeds (Fig. 6). An exception to this pattern was Station HNL, where leucine incorporation in the surface microlayer was enhanced by 20% as compared to surface waters. Only a small fraction of DAPI-stained cells incorporated leucine in the surface microlayer (4–13%) in comparison to surface waters (19–33%), further indicating the inhibition of the bac-terial activity in the surface microlayer.
Different bacterial groups were responsible for bulk leucine incorporation in the surface microlayer as compared to surface waters at Stations GYR and STB17 (Fig. 7). At Station GYR, Bacteroidetes clearly dominated leucine up-take in the surface microlayer (43% of DAPI-stained cells as-sociated with silver grains), while in surface waters both
Al-phaproteobacteria and Bacteroidetes (26% and 36%,
respec-tively, of DAPI-stained cells associated with silver grains)
had similar contributions to leucine uptake. At Station
STB17, Gammaproteobacteria and Bacteroidetes dominated leucine uptake in the surface microlayer (28% and 25% respectively, of DAPI-stained cells associated with silver grains), while the three bacterial groups studied contributed equally to leucine uptake in surface waters (13% to 16% of DAPI-stained cells associated with silver grains) (Fig. 7).
0
0.5
1
1.5
2
2.5
3
0
0.2
0.4
0.6
0.8
1
1.2
1.4
Wind speed (m s
-1)
Ratio of bacterial heterotrophic
production in SML to SW
ms-bgd-2007-0093-f06
Fig. 6. Relation between the ratio of bacterial heterotrophic
produc-tion in the surface microlayer (SML) to surface waters (SW) and the mean wind speed 6h prior to sampling.
4 Discussion
The thickness of the surface microlayer sampled, and thus its definition for a given study, depends on the sampling de-vice applied. The metal screen we used in the present study collects the upper 250–440 µm water layer (Garrett 1965), while the layers collected by the glass plate (Harvey and Burzell 1972) and the rotating drum (Harvey 1966) are thin-ner (60–100 µm). For specific microbiological studies mem-branes are used to collect the upper 1 to 40 µm (Kjelleberg et al., 1979). These differences are mainly due to the phys-ical mechanisms to sample the uppermost layer of aquatic systems, with some devices being more selective than
oth-0 5 10 15 20 25 30 35 40 0 10 20 30 40 50 60 70 80 SSW SML a 0 2 4 6 8 10 0 10 20 30 40 50 60 70 80 SSW SML 3
H-Leucine Incorporation (pmol l-1 h-1)
Contribution of major bacterial groups to leucine incorporation (% of DAPI-stained cells associated with silver grains)
b 0 5 10 15 20 25 0 10 20 30 40 50 60 70 80 SSW SML Leucine Incorporation Alphaproteobacteria Gammaproteobacteria Bacteroidetes c ms-bgd-2007-0093-f07 Fig. 7. Bulk3H-leucine incorporation and relative contribution of bacterial groups to leucine-incorporation in the surface microlayer (SML) and in surface waters (SW) at Stations MAR (a), GYR (b) and STB17 (c). For3H-leucine incorporation, mean values ±variation of duplicate incubations, and for the relative contribution of bacterial groups mean values ±SE are given.
ers. Based on a large data set of chemical (Momzikoff et al., 2004) and biological (Agogu´e et al., 2004) parameters col-lected both with the metal screen and the glass plate in the coastal Mediterranean Sea, no significant differences in the enrichment factors between the two samplers were observed. Kuznetsova et al. (2004) report a more efficient collection of surface microlayer dissolved and particulate material by the screen than by the drum, despite the thinner layer sampled by the latter. These studies demonstrate that the collection of the surface microlayer to study the parameters considered herein are most likely not biased due to dilution with surface waters, despite the larger thickness of the layer sampled. Our choice of the screen sampler is driven by the efficient, non-selective sampling of a relatively large water volume for chemical and biological analyses.
The marked accumulation of particulate organic matter at the sea surface observed in the present study was not ac-companied by any pronounced enrichment in photo- or het-erotrophic organisms. This suggests that detrital particles, in-cluding colloidal aggregates, transparent exopolymeric par-ticles (TEP), and submicron parpar-ticles most likely constitute an important fraction of the surface microlayer biofilm. The higher C:N ratios of particulate organic matter observed in the present and previous studies (Nishizawa, 1971; Taguchi and Nakajima, 1971) further support this notion. The enrich-ment in particulate organic matter was strongly controlled by wind history, but independent of particulate organic mat-ter concentrations in surface wamat-ters, suggesting that phys-ical processes, such as turbulent mixing, transport by ris-ing bubbles or buoyant particles were important for the sur-face microlayer formation. The most pronounced accumu-lation of particulate organic matter was observed at Station
EGY where calm wind conditions (≤2 m s−1)prevailed over
roughly 18 h prior to surface microlayer collection. It was
interesting to note that at this site the C:N ratio of particu-late organic matter in the surface microlayer was similar to that in surface waters (Table 2). Station EGY was the only site where a pronounced enrichment in cell abundance and biomass of autotrophic and heterotrophic organisms was ob-served (Tables 3 and 4). These observations could indicate the transport of fresh material to the ocean surface, but they could also reflect photo- and heterotrophic biomass produc-tion in the surface microlayer when calm wind condiproduc-tions exist over an extended time period. The latter idea is, how-ever, not supported by results from the present study, as the inhibition in bacterial heterotrophic production in the sur-face microlayer was most pronounced at calm sea conditions (Fig. 6). This suggests that wind-induced physical processes determine not only the amount, but to some extent also the characteristics of the particulate organic matter that accumu-lates at the air-water interface.
The chemical characteristics of surface microlayer dis-solved organic matter (DOM) appear to contrast the obser-vations on particulate organic matter. Recent studies per-formed in the open Atlantic and the western Mediterranean Sea report a pronounced enrichment in dissolved free amino acids and a substantially lower C:N ratio in the DOM from the surface microlayer as compared to that from surface wa-ters (Kuznetsova et al., 2004; Reinthaler et al., 2008). Inter-estingly, Reinthaler et al. (2008) concluded that the biore-activity of the surface microlayer DOM was low, despite the high contribution of amino acids to DOC and DON. Se-lective accumulation, and also in situ production were both suggested to account for the enrichment in amino acids in the surface microlayer (Kuznetsova et al., 2004; Reinthaler
et al., 2008). The consistently higher concentrations of
chromophoric DOM (cDOM) in the surface microlayer ob-served in the present and previous studies (Carlson, 1983) are
clearly indicative for the selective accumulation of DOM at the air-water interface. Removal of cDOM by photominer-alization and photobleaching is most likely rapid in the sur-face microlayer, the observation that cDOM is consistently enriched strongly suggests the continuous supply from bulk seawater by selective scavenging.
In the present study, bacterial heterotrophic production was clearly reduced in the surface microlayer as compared to surface waters. Previous studies support (Sieburth et al., 1976; Carlucci et al., 1986) or contrast (Dietz et al., 1976; Bell and Albright, 1982; Bailey et al., 1983; Williams et al., 1986; Agogu´e et al., 2004; Reinthaler et al., 2008) this obser-vation. A more consistent pattern among studies is observed on rates of bacterial (<0.8 µm fraction) or microbial commu-nity respiration in the surface microlayer, generally exceed-ing those in surface waters by several-fold (Garab´etian 1990; Obernosterer et al., 2005; Reinthaler et al., 2008). These contrasting responses most likely reflect the different char-acteristics of the surface microlayer. The enrichment in or-ganic and inoror-ganic matter renders the surface microlayer a potentially favorable habitat for heterotrophic bacteria, at the same time it is exposed to drastic changes in temperature, pH, salinity and also to high intensities of solar radiation, in particular ultraviolet radiation. Based on the short incubation time, bacterial heterotrophic production provides an instan-taneous response to the conditions in the surface microlayer. By contrast, respiration measurements require 12 h–24 h in-cubations in the dark and they more likely reflect the poten-tial of organic matter originating from the surface microlayer in sustaining bacterial metabolism.
Bacterial growth rates could further indicate the activity of the bacterial community in the surface microlayer. Bac-terial growth rates are commonly calculated on the basis of total bacterial cell abundance even though several indepen-dent approaches have shown that only a fraction of the bacte-rial community can be considered active (Gasol et al., 1999; Lebaron et al., 2001, Zubkov et al., 2001). The microau-toradiographic observations performed in the present study allowed us to estimate the fraction of active cells, accounting for roughly 10% and 25% of DAPI-stained cells in the sur-face microlayer and sursur-face waters, respectively. Assuming that this percentage represents the active part of the bacterial
community, growth rates in the surface microlayer (0.6 d−1)
exceeded those in surface waters (0.3 d−1)by a factor of two.
Could this indicate that only a few bacterial groups are active in the surface microlayer accounting for most of the bacterial heterotrophic production in this particular environment?
Our results from the fingerprints and the in situ hybridiza-tion suggest that the surface microlayer is not inhabited by a particular bacterioneuston community. Two complemen-tary approaches, a based (i.e. CE-SSCP) and a PCR-independent method (i.e. CARD-FISH) support this notion. The overall close similarity of the CE-SSCP fingerprints, each represented by 13–24 ribotypes, indicate that the bac-terial community structure in the surface microlayer strongly
resembles that in surface waters. Even though the probes we used in the present study provide information on a low phylo-genetic level, the results from the in situ hybridization appear to support this conclusion. Given the low bacterial growth rates determined in the present study, and the relatively short time period over which the surface microlayer persists, an in situ development of a specific bacterioneuston community is unlikely. Physical processes are mainly responsible for the formation of the surface microlayer, with upward transport of particulate material being a predominant process. The dif-ferences that we observed in the fingerprints between the two layers is most likely owing to the selective enrichment of the surface microlayer by specific ribotypes. Likely candidates are bacteria attached to particles that are transported to the air-sea interface. The structure of the bacterial community attached to particles in the water column differs from that of free-living bacteria (Acinas et al., 1999; Riemann and Wind-ing, 2001; Ghiglione et al., 2007) and Bacteroidetes were found to have an important contribution to the bacterial com-munities associated with aggregates (DeLong et al., 1993; Ploug et al., 1999; Simon et al., 2002). Marine aerosol parti-cles have also been observed to be enriched in bacteria, and their transport in the atmosphere has been suggested a poten-tially important dispersal mechanism (Aller et al., 2005).
Our conclusion on the close similarity between the bacte-rial community structure in the surface microlayer and sur-face waters is supported by results from samples collected in the same way from the coastal Mediterranean Sea (Agogu´e et al., 2004), but they contrast the conclusion of a study conducted in the coastal North Sea (Franklin et al., 2005). These authors utilized hydrophilic membranes to collect sur-face microlayer bacteria, and based on 16S rRNA clone li-braries they observed a lower bacterial diversity in the sur-face microlayer as compared to sursur-face waters (Franklin et al., 2005). The potentially selective adsorption of bacte-ria onto hydrophilic membranes as discussed in Agogu´e et al. (2004), could at least partly account for the different con-clusions obtained by these studies.
In contrast to the similarity between the two layers in terms of community structure and abundance of major bacterial groups, differences in the composition of the active commu-nity were detectable. This was particularly pronounced at Station STB17 where Bacteroidetes and
Gammaproteobac-teria dominated the active community in the surface
mi-crolayer, while the three bacterial groups investigated con-tributed equally to the active community in surface wa-ters (Fig. 7). Even though these bacterial groups contain each a diverse assemblage of sub-groups, they have been attributed specific characteristics, based on different experi-mental approaches. There is for instance increasing evidence that members of the Bacteroidetes group play an important role in the degradation of complex polymeric substances (Cottrell and Kirchman, 2000; Kirchman 2002; Cottrell et al., 2005). Several members belonging to the planktonic heterotrophic Gammaproteobacteria were characterized as
“opportunistic” due to their ability to rapidly respond to nu-trient enrichment (Pinhassi and Berman, 2003). Pronounced growth of Gammaproteobacteria was detectable in nitrogen-amended incubations at Station GYR (Van Wambeke et al., personal communication). The dominance of Bacteroidetes and Gammaproteobacteria in the active community in the surface microlayer could reflect the rapid response of mem-bers of these bacterial groups to changes in the growth condi-tions, such as the enrichment and composition of organic and inorganic matter. These results suggest that even short time periods in the surface microlayer result in differences in bac-terial groups accounting for leucine incorporation, probably as a response to the differences in the physical and chemical nature of the two layers.
In the open ocean, the organic matter accumulating at the air-sea interface originates predominantly from phytoplank-ton primary production. The vertical flux of phytoplankphytoplank-ton- phytoplankton-derived organic carbon to the ocean surface has, to the best of our knowledge, never been evaluated. The potential impor-tance of an upward flux of organic matter has been illustrated by studies on buoyant particles. TEP-rich microaggregates, for example, have been reported to ascend at velocities as
fast as 0.1–1 m d−1 to the ocean surface (Azetsu-Scott and
Passow, 2004). The accumulation of organic matter at the sea surface impacts its physical structure and consequently the gas transfer rates. Photochemical mineralization of sur-face microlayer organic matter could have important conse-quences for the air-sea gas exchange (Obernosterer et al., 2005). The results from the present study suggest that het-erotrophic bacteria in the surface microlayer do not represent an assemblage specific to this environment. The strong inhi-bition of bacterial biomass production in the surface micro-layer indicates a lack of adaptation of the bacterial commu-nity, most likely due to its short residence time. This could lead to the conclusion that heterotrophic bacteria do not have a major contribution to the degradation of surface microlayer organic matter. This idea, however, contrasts the conclusion drawn from bacterial and community respiration rates based on bottle incubation experiments (Calleja et al., 2005; Ober-nosterer et al., 2005; Reinthaler et al., 2008). To better under-stand and determine the importance of biological processes for the air-sea exchange, clearly novel techniques allowing in situ measurements of biological fluxes at the air-water inter-face are required.
Acknowledgements. We are greatful to S. Blain, D. Marie and
A. Sciandra for their help with the surfae microlayer sampling. We thank the chief scientists H. Claustre and A. Sciandra, and the captain and the crew of the R/V Atalante for their support aboard. D. Taillez kindly provided the wind speed data. Two anonymous reviewers helped improve an earlier version of the manuscript. Financial support for this work came from the French National program PROOF (INSU/CNRS).
Edited by: A. Boetius
References
Acinas, S. G., Anton, J., and Rodriguez-Valera, F.: Diversity of free-living and attached bacteria in offshore Mediterranean wa-ters as depicted by analysis of genes encoding 16S rRNA, Appl Environ. Microbiol., 65, 514–522, 1999.
Agogu´e, H., Casamayor, E. O., Joux, F., Obernosterer, I., Dupuy, C., Lantoine, F., Catala, P., Weinbauer, M. G., Reinthaler, T., Herndl, G. J., and Lebaron, P.: Comparison of samplers for the biological characterization of the sea surface microlayer, Limnol. Oceanogr. Methods, 2, 213–225, 2004.
Aller, J. Y., Kuznetsova, M. R., Jahns, C. J., and Kemp, P. F.: The sea surface microlayer as a source of viral and bacterial enrich-ment in marine aerosols, Aerosol Science, 36, 801–812, 2005. Azetsu-Scott, K. and Passow, U.: Ascending marine particles:
Sig-nificance of transparent exopolymer particles (TEP) in the upper ocean, Limnol. Oceanogr., 49, 741–748, 2004.
Bailey, C. A., Neihof, R. A., and Tabor, P. S.: Inhibitory effect of solar radiation on amino acid uptake in Chesapeake Bay bacteria, Appl. Environ. Microbiol., 46, 44–49, 1983.
Bell, C. R. and Albright, L. J.: Bacteriological investigation of the neuston and plankton in the Fraser River estuary, British Columbia., Estuar. Coast. Shelf Sciences, 15, 385–394, 1982. Benner, R. and Strom, M.: A critical evaluation of the analytical
blank associated with DOC measurements by high- temperature catalytic oxidation, Mar. Chem., 41, 153–160, 1993.
Brosius, J., Dull, T., Sleeter, D. D., and Noller, H. F.: Gene orga-nization and primary structure of a ribosomal RNA operon from Escherichia coli, J. Molecular Biology, 148, 107–127, 1981. Calleja, M. L., Duarte, C. M., Navarro, N., and Agusti, S.:
Con-trol of air-sea CO2disequilibria in the subtropical NE Atlantic
by planktonic metabolism under the ocean skin, Geophys. Res. Lett., 32, 2005.
Carlson, D. J.: Dissolved organic materials in surface microlayers: Temporal and spatial variability and relation to sea state, Limnol. Oceanogr., 28, 415–431, 1983.
Carlucci, A. F., Craven, D. B., Robertson, K. J., and Williams, P. M.: Surface-film microbial populations: diel amino acid metabolism, carbon utilization, and growth rates, Mar. Biol., 92, 289–297, 1986.
Cottrell, M. T. and Kirchman, D. L.: Natural assemblages of marine proteobacteria and members of the Cytophaga-Flavobacter clus-ter consuming low-and high-molecular-weight dissolved organic matter, Appl. Environm. Microbiol., 66, 1692–1697, 2000. Cottrell, M. T. and Kirchman, D. L.: Contribution of major bacterial
groups to bacterial biomass production (thymidine and leucine incorporation) in the Delaware estuary, Limnol. Oceanogr., 48, 168–178, 2003.
Cottrell, M. T., Yu, L., and Kirchman, D. L.: Sequence and expres-sion analyses of Cytophaga-like hydrolases in a Western arctic metagenomic library and the Sargasso Sea, Appl Environ Micro-biol, 71, 8506–8513, 2005.
Delb`es, C., Moletta, R., and Godon, J.: Monitoring of activ-ity dynamics of an aerobic digester bacterial communactiv-ity us-ing 16S rRNA polymerase chain reaction-sus-ingle-strand confor-mation polymorphism analysis, Environ Microbiol, 2, 506–515, 2000.
DeLong, E. F., Franks, D. G., and Alldredge, A. L.: Phylogenetic diversity of aggregate-attached vs. free-living marine bacterial assemblages, Limnol. Oceanogr., 38, 924–934, 1993.
Dietz, A. S., Albright, L. J., and Tuominen, T.: Heterotrophic activ-ities of bacterioneuston and bacterioplankton, Can. J. Microbiol., 22, 1699–1709, 1976.
Franklin, M. P., McDonald, I. R., Bourne, D. G., Owens, N. J. P., Upstill-Goddard, R. C., and Murrell, J. C.: Bacterial diver-sity in the bacterioneuston (sea surface microlayer): the bacteri-oneuston through the looking glass, Environ Microbiol, 7, 723– 736, 2005.
Frew, N. M.: The role of organic films in air-sea gas exchange, 121– 172, in: The sea surface and global change, edited by: Liss, P. S. and Duce, R. A., Cambridge University Press, 1997.
Fukuda, R., Ogawa, H., Nagata, T., and Koike, I.: Direct determina-tion of carbon and nitrogen contents of natural bacterial assem-blages in marine environments, Appl. Environ. Microbiol., 64, 3352–3358, 1998.
Garab´etian, F.: Production de CO2 `a l’interface air-mer, Une
ap-proche par l’´etude des ph´enom`enes respiratoires dans la micro-couche de surface, Int Rev ges Hydrobiol, 76, 219–229, 1990. Garrett, W. D.: Collection of slick-forming materials from the sea
surface, Limnol. Oceanogr., 10, 602–605, 1965.
Gasol, J. M., Zweifel, U. L., Peters, F., Fuhrman, J. A., and Hagstr¨om, A.: Significance of size and nucleic acid content het-erogeneity as measured by flow cytometry in natural planktonic bacteria, Appl. Environ. Microbiol., 65, 4475–4483, 1999. Ghiglione, J.-F., Larcher, M., and Lebaron, P.: Spatial and tempral
scales of variation in the bacterioplankton community structure in the NW Mediterranean Sea, Aquat. Microb. Ecol., 40, 229– 240, 2005.
Ghiglione, J.-F., Mevel, G., Pujo-Pay, M., Mousseau, L., Lebaron, P., and Goutx, M.: Diel and seasonal variations in abundance, activity, and community structure of particle-attached and free-living bacteria in NW Mediterranean Sea, Microb Ecol, 54, 217– 231, 2007.
Harvey, G. W.: Microlayer collection from the sea surface: a new method and initial results, Limnol. Oceanogr., 11, 608–614, 1966.
Harvey, G. W. and Burzell, L. A.: A simple microlayer method for small samples, Limnol. Oceanogr., 17, 156–157, 1972.
Joux, F., Agogu´e, H., Obernosterer, I., Dupuy, C., Reinthaler, T., Herndl, G. J., and Lebaron, P.: Microbial community structure in the sea surface microlayer at two contrasting coastal sites in the northwestern Mediterranean Sea, Aquat. Microb. Ecol., 42, 91–104, 2006.
Kirchman, D. L.: The ecology of Cytophaga-Flavobacteria in aquatic environments, FEMS Microbiology Ecology, 39, 91, 2002.
Kjelleberg, S., Stenstr¨om, T. A., and Odham, G.: Comparative study of different hydrophobic devices for sampling lipid surface films and adherent microorganisms, Mar. Chem., 53, 21–25, 1979. Kuznetsova, M., Lee, C., Aller, J., and Frew, N.: Enrichment of
amino acids in the sea surface microlayer at coastal and open ocean sites in the North Atlantic Ocean, Limnol. Oceanogr., 49, 1605–1619, 2004.
Lebaron, P., Servais, P., Agogue, H., Courties, C., and Joux, F.: Does the high nucleic acid content of individual bacterial cells allow us to discriminate between active cells and inactive cells in aquatic systems?, Appl. Environ. Microbiol., 67, 1775–1782, 2001.
Lee, D. H., Zo, Y. G., and Kim, S. J.: Non-radioactive method to
study genetic profiles of natural bacterial communities by PCR-single-strand-conformation polymorphism, Appl. Environ. Mi-crobiol., 62, 3112–3120, 1996.
Liss, P. S., Watson, A. J., Bock, E. J., Jaehne, B., Asher, W. E., Frew, N. M., Hasse, L., Korenowski, G. M., Merlivat, L., Philips, L. F., Schluessel, P., and Woolf, D. K.: Physical processes in the microlayer and the air-sea exchange of trace gases, 1–33, in: The sea surface and global change, edited by: Liss, P. S. and Duce, R. A., Cambridge University Press, 1997.
Marie, D., Simon, N., Guillon, L., Partensky, F., and Vaulot, D.: Flow cytometry analysis of marine picoplankton, 421–454, in: Living Color: Protocols in flow cytometry and cell sorting, edited by: Maggio, D., Springer Verlag, 2000.
Momzikoff, A., Brinis, A., Dallot, S., Gondry, G., Saliot, A., and Lebaron, P.: Field study of the chemical characterization of the upper ocean surface using various samplers, Limnol. Oceanogr, Methods, 2, 374–386, 2004.
Nishizawa, S.: Concentration of organic and inorganic material in the surface skin at the Equator, 155◦W, Bull. Plankton Soc. Japan, 18, 42–44, 1971.
Obernosterer, I., Catala, P., Reinthaler, T., Herndl, G. J., and Lebaron, P.: Enhanced heterotrophic activity in the surface mi-crolayer of the Mediterranean Sea, Aquat. Microb. Ecol., 39, 293–302, 2005.
Pernthaler, A., Pernthaler, J., and Ammann, R.: Fluorescence in situ hybridization and catalyzed reporter deposition for the identifi-cation of marine bacteria, Appl. Environ. Microbiol., 86, 3094– 3101, 2002.
Pinhassi, J. and Berman, T.: Differential growth response of colony-forming Alpha-and Gammaproteobacteria in dilution culture and nutrient addition experiments from Lake Kinneret (Israel), the Eastern Mediterranean Sea, and the Gulf of Eilat, Appl. Environ. Microbiol., 69, 199–211, 2003.
Ploug, H., Grossart, H. P., Azam, F., and Joergensen, B. B.: Pho-tosynthesis, respiration and carbon turnover in sinking marine snow from surface waters of Southern California Bight: impli-catiosn for the carbon cycle in the ocean, Mar. Ecol. Prog. Ser., 179, 1–11, 1999.
Ras, J., Claustre, H., and Uitz, J.: Spatial variability of phytoplank-ton pigment distributions in the Subtropical South Pacific Ocean: comparison between in situ and modelled data, Biogeosciences, 5, 353–369, 2008,
http://www.biogeosciences.net/5/353/2008/.
Reinthaler, T., Sintes, E., and Herndl, G. J.: Dissolved organic mat-ter and bacmat-terial production and respiration in the sea-surface mi-crolayer of the open Atlantic and the western Mediterranean Sea, Limnol. Oceanogr., 53, 122–136, 2008.
Riemann, L. and Winding, A.: Community Dynamics of Free-living and Particle-associated Bacterial Assemblages during a Freshwa-ter Phytoplankton Bloom, Microb. Ecol., 42, 274–285, 2001. Sekar, R., Pernthaler, A., Pernthaler, J., Warnecke, F., Posch, T., and
Amann, R.: An improved protocol for quantification of freshwa-ter Actinobacfreshwa-teria by fluorescence in situ hybridization, Appl. Environ. Microbiol., 69, 2928–2935, 2003.
Sherr, E. B., Caron, D. A., and Sherr, B. F.: Staining of het-erotrophic protists for visualization via epifluorescence croscopy, 213–227, in: Handbook of methods for aquatic mi-crobial ecology, edited by: Kemp, P. F., Sherr, B. F., Sherr, E. B., and Cole, J. J., Lewis Publishers, 1993.
Sieburth, J. M. N., Willis, P.-J., Johnson, K. M., Burney, C. M., Lavoie, D. M., Hinga, K. R., Caron, D. A., French Iii, F. W., Johnson, P. W., and Davis, P. G.: Dissolved organic matter and heterotrophic microneuston in the surface microlayers of the North Atlantic, Science, 194, 1415–1418, 1976.
Simon, M., Grossart, H. P., Schweitzer, B., and Ploug, H.: Micro-bial ecology of organic aggregates in aquatic ecosystems, Aquat. Microb. Ecol., 28, 175–211, 2002.
Smith, D. C. and Azam, F.: A simple, economical method for mea-suring bacterial protein synthesis rates in sea water using3H -Leucine, Mar. Microb. Food Webs., 6, 107–114, 1992.
Taguchi, S. and Nakajima, K.: Plankton and seston in the sea sur-face of three inlets of Japan, Bull. Plankton Soc., Japan, 18, 20– 36, 1971.
Van Heukelem, L. and Thomas, C. S.: Computer-assisted high-performance liquid chromatography method development with applications to the isolation and analysis of phytoplankton pig-ments, J. Chromatography A., 901, 31–49, 2001.
Van Wambeke, F., Christaki, U., Giannakourou, A., Moutin, T., and Souvemerzoglou, K.: Longitudinal and vertical trends of bacte-rial limitation by phosphorus and carbon in the Mediterranean Sea, Microb. Ecol., 43, 119–133, 2002.
Williams, P. M., Carlucci, A. F., Henrichs, S. M., Vleet, E. S. V., Horrigan, S. G., Reid, F. M. H., and Robertson, K. J.: Chemical and microbiological studies of sea-surface films in the southern gulf of California and off the west coast of Baja California, Mar. Chem., 19, 17–98, 1986.
Zaitsev, Y.: Neuston of seas and oceans, 371–382, in: The sea sur-face and global change, edited by: Liss, P. S. and Duce, R. A., Cambridge University Press, 1997.
Zemmelink, H. J., Houghton, L., Sievert, S. M., Frew, N. M., and Dacey, J. W. H.: Gradients in dimethylsulfide, dimethylsulfonio-propionate, dimethylsulfoxide, and bacteria near the sea surface, Mar. Ecol. Prog. Ser., 295, 33–42, 2005.
Zubkov, M. V., Fuchs, B. M., Burkhill, P. H., and Amann, R.: Com-parison of cellular and biomass specific activities of dominant bacterioplankton groups in stratified waters of the Celtic Sea, Appl. Environ. Microbiol., 67, 5210–5218, 2001.