HAL Id: hal-00317200
https://hal.archives-ouvertes.fr/hal-00317200
Submitted on 1 Jan 2003
HAL is a multi-disciplinary open access
archive for the deposit and dissemination of
sci-entific research documents, whether they are
pub-lished or not. The documents may come from
teaching and research institutions in France or
abroad, or from public or private research centers.
L’archive ouverte pluridisciplinaire HAL, est
destinée au dépôt et à la diffusion de documents
scientifiques de niveau recherche, publiés ou non,
émanant des établissements d’enseignement et de
recherche français ou étrangers, des laboratoires
publics ou privés.
Equatorial F-region plasma depletion drifts: latitudinal
and seasonal variations
A. A. Pimenta, P. R. Fagundes, Y. Sahai, J. A. Bittencourt, J. R. Abalde
To cite this version:
A. A. Pimenta, P. R. Fagundes, Y. Sahai, J. A. Bittencourt, J. R. Abalde. Equatorial F-region plasma
depletion drifts: latitudinal and seasonal variations. Annales Geophysicae, European Geosciences
Union, 2003, 21 (12), pp.2315-2322. �hal-00317200�
Geophysicae
Equatorial F-region plasma depletion drifts: latitudinal and
seasonal variations
A. A. Pimenta1, P. R. Fagundes2, Y. Sahai2, J. A. Bittencourt1, and J. R. Abalde2
1Instituto Nacional de Pesquisas Espaciais – INPE – C.P. 515, 12201-970, S˜ao Jos´e dos campos, SP, Brazil 2Universidade do Vale do Paraba – UNIVAP, Av. Shishima Hifumi 2911, S˜ao Jos´e dos Campos, SP, Brazil
Received: 10 December 2002 – Revised: 8 April 2003 – Accepted: 17 April 2003
Abstract. The equatorial ionospheric irregularities have been observed in the past few years by different techniques (e.g. ground-based radar, digisonde, GPS, optical instru-ments, in situ satellite and rocket instrumentation), and its time evolution and propagation characteristics can be used to study important aspects of ionospheric dynamics and thermosphere-ionosphere coupling. At present, one of the most powerful optical techniques to study the large-scale ionospheric irregularities is the all-sky imaging pho-tometer system, which normally measures the strong F-region nightglow 630 nm emission from atomic oxygen. The monochromatic OI 630 nm emission images usually show quasi-north-south magnetic field-aligned intensity depletion bands, which are the bottomside optical signatures of large-scale F-region plasma irregularities (also called plasma bub-bles). The zonal drift velocities of the plasma bubbles can be inferred from the space-time displacement of the dark struc-tures (low intensity regions) seen on the images. In this study, images obtained with an all-sky imaging photometer, using the OI 630 nm nightglow emission, from Cachoeira Paulista (22.7◦S, 45◦W, 15.8◦S dip latitude), Brazil, have been used to determine the nocturnal monthly and latitudinal variation characteristics of the zonal plasma bubble drift velocities in the low latitude (16.7◦S to 28.7◦S) region. The east and west walls of the plasma bubble show a different evolution with time. The method used here is based on the western wall of the bubble, which presents a more stable behavior. Also, the observed zonal plasma bubble drift velocities are compared with the thermospheric zonal neutral wind veloc-ities obtained from the HWM-90 model (Hedin et al., 1991) to investigate the thermosphere-ionosphere coupling. Salient features from this study are presented and discussed.
Key words. Ionosphere (ionosphere-atmosphere
interac-tions; ionospheric irregularities; instruments and tech-niques)
Correspondence to: A. A. Pimenta (pimenta@laser.inpe.br)
1 Introduction
During recent years, all-sky imaging photometers have pro-vided several key pieces of information related to the space-time evolution of gravity waves and large-scale ionospheric irregularities at mesospheric and thermospheric/ionospheric heights, respectively. The nightglow emissions that come from F-region heights (e.g. OI 777.4 nm, OI 630 nm and OI 557.7 nm) are used in connection with studies of trav-eling ionospheric disturbances, dynamics of the equatorial ionospheric anomaly, dynamics related to the thermospheric midnight temperature maximum, thermosphere/ionosphere coupling and equatorial F-region ionospheric irregularities (Biondi et al., 1999; Bittencourt et al., 1997; Colerico et al., 1996; Moore et al., 1981; Pimenta et al., 2001a; Rohrbaugh et al., 1989; Sahai et al., 1981; Tinsley et al., 1982, 1997). The OI 630 nm emission is produced at the bottomside of the ionospheric F-region, at about 250 to 300 km altitude, by the dissociative recombination process:
O+2 +e →O + O∗(1D), O∗(1D) → O + hv(λ = 630nm) and is commonly used to investigate the thermo-spheric/ionospheric processes at F-region heights.
Equatorial F-region irregularity studies using a monochro-matic (OI 630 nm emission) all-sky imaging photometer sys-tem were first conducted by Weber et al. (1978). Their ob-servations, in the equatorial region, showed the presence of quasi-north-south magnetic field-aligned airglow depletions, with east-west scale sizes ranging from 40 to 450 km, usu-ally drifting eastward, and the plasma bubble drift velocities were fairly close to the zonal ambient plasma drift veloci-ties (Woodman, 1972; Zalesak et al., 1982). The OI 630 nm emission intensity depletions, or dropouts, are the bottom-side optical signatures of equatorial F-region plasma bubbles, and the plasma drift velocities constitute an important param-eter for thermosphere-ionosphere coupling studies.
The earlier attempts to calculate the eastward plasma bub-ble drift velocities, using an all-sky imaging photometer sys-tem, were carried out by superposing an appropriate grid on
2316 A. A. Pimenta et al.: Equatorial F-region plasma depletion drifts
12
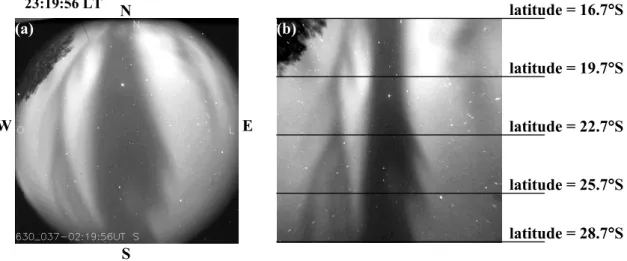
Figure 1. (a) Ionospheric irregularity (plasma bubble) structures observed by means of the OI 630
nm airglow emission. Data were recorded from Cachoeira Paulista, Brazil, on November 2, 1999 at
23:19:56 LT. (b) Linearized image (original shown in (a)) corresponding to a mapped area of the
processed image of 1320 km x 1320 km of the OI 630 nm airglow emission layer, assuming a peak
emission altitude of 250 km.
N
W
E
S
(a)
latitude = 19.7
°°°°
S
latitude = 25.7
°°°°
S
latitude = 22.7
°°°°
S
latitude = 28.7
°°°°
S
23:19:56 LT(b)
latitude = 16.7
°°°°
S
Fig. 1. (a) Ionospheric irregularity (plasma bubble) structures observed by means of the OI 630 nm airglow emission. Data were recorded from Cachoeira Paulista, Brazil, on 2 November 1999 at 23:19:56 LT. (b) Linearized image (original shown in (a)) corresponding to a mapped area of the processed image of 1320 km × 1320 km of the OI 630 nm airglow emission layer, assuming a peak emission altitude of 250 km.
the recorded OI 630 nm emission images (Weber et al., 1978; Mendillo and Baumgardner, 1982; Fagundes et al., 1997). Afterwards, using digitalized images of the OI 630 nm emis-sion, Mendillo et al. (1997a) and Taylor et al. (1997) pre-sented a technique, which improved the calculations of the plasma bubble drift velocities. In their technique, initially the bi-dimensional images are scanned in the east-west direction (through the zenith), in order to obtain a slice of each im-age and to provide one-dimensional east-west intensity vari-ations. Then, using successive images, the intensity scans through the zenith are subjected to a cross-correlation anal-ysis, to obtain the eastward plasma bubble drift velocities. More recently, Pimenta et al. (2001b) first linearized the OI 630 nm emission images using an appropriate geographic co-ordinate system and, after that, compared the east-west inten-sity variations in consecutive image slices to obtain the east-ward plasma bubble drift velocities. They observed that the space-time dynamics of the plasma bubbles led to changes in their shapes and dimensions, which may induce errors in the calculated plasma drift velocities. Pimenta et al. (2001b) dis-cussed the different dynamic behavior observed between the eastern and western walls of the intensity depletions, as seen in the OI 630 nm emission linearized images. In this paper, we present and discuss the latitudinal and seasonal variations of the eastward plasma bubble drift velocities inferred using the technique described in detail by Pimenta et al. (2001b).
2 Instrumentation and data analysis
All-sky monochromatic/multi-spectral wide-angle imaging systems have been used for aurora and airglow studies dur-ing recent decades, with great success. There has been con-siderable improvement in their capabilities to observe very faint and low contrast nightglow emissions, due to recent ad-vances in CCD detectors (Mendillo et al., 1997b; Garcia et
al., 1997; Taylor et al., 1997; Abalde et al., 2001; Pimenta et al., 2001b; Santana et al., 2001). The images recorded with the all-sky imaging system (from the Utah State Uni-versity, Taylor et al., 1997) which carried out regular ob-servations at Cachoeira Paulista (22.7◦S, 45.0◦W; 15.8◦S dip latitude), Brazil, since 1998, provided time evolution and spatial variations of selected atomic or molecular emissions over a wide sky area. Since the emission layers are origi-nated at quasi-fixed heights, with a range of altitude varying from 10 to 50 km, it is possible to study the dynamics and spatial-temporal variations of irregularities that occur in this particular height region.
The imaging system used to record the space-time night-glow variations, in the present study, has a large CCD area (6.45 cm2), with high resolution and a 1024 × 1024 back-illuminated array having a pixel depth of 14 bits. The images have been binned on-chip down to a 512 × 512 resolution, to enhance the signal-to-noise ratio and are recorded at intervals of 7 min, with a 90-s exposure time rate.
Figure 1a shows an example of the OI 630 nm emission image recorded at Cachoeira Paulista. The quasi-north-south magnetic field-aligned airglow depletions (dark structures) seen in the image are the optical signatures of the plasma bubbles. It is noted that the image appears curved and com-pressed at low elevation angles (image edge), and the image is inflated at high elevation angles (around zenith). Thus, the raw image is distorted with respect to the radius. In order to calculate the east-west drift velocities of the plasma bubbles, as a function of local time, we first transform the raw im-age into a geographic grid imim-age (Cartesian coordinate sys-tem), using the linearization method described by Garcia et al. (1997). Figure 1b shows an example of the transformed image, after being linearized. Notice that the processed im-age area is 1320 km × 1320 km, assuming that the OI 630 nm peak emission layer is at 250 km. In this figure, it is possible to see the quasi-north-south magnetic field-aligned plasma
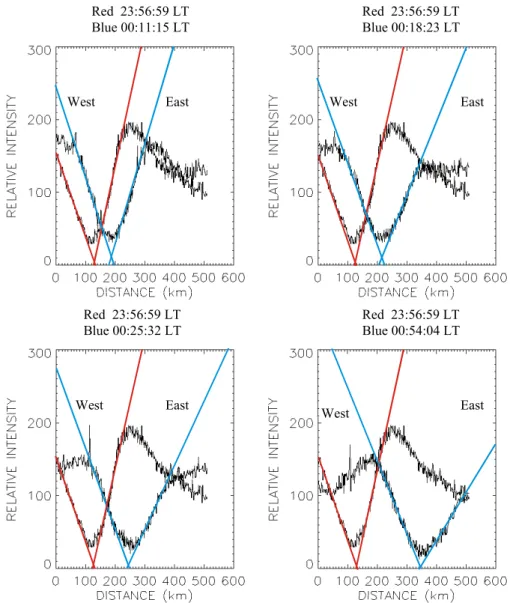
Figure 2. East-west intensity scans, through zenith, of five consecutive images (lineralized images corresponding to a mapped area of the processed image of 600 km x 600 km of the OI 630 nm airglow emission layer, assuming an emission altitude of 250 km) observed on January 01-02, 2000, illustrating the different dynamic behavior observed between the east (right side) and west (left side) walls of the intensity depletions. The red lines are east-west scan obtained at 23:56:59 LT and repeated in all the panels. The blue lines are the east-west scans obtained at different times indicated in the panels. Red 23:56:59 LT Blue 00:11:15 LT Red 23:56:59 LT Blue 00:18:23 LT Red 23:56:59 LT Blue 00:25:32 LT Red 23:56:59 LT Blue 00:54:04 LT West West West West East East East East
Fig. 2. East-west intensity scans, through zenith, of five consecutive images (lineralized images corresponding to a mapped area of the processed image of 600 km × 600 km of the OI 630 nm airglow emission layer, assuming an emission altitude of 250 km) observed on 1–2 January 2000, illustrating the different dynamic behavior observed between the east (right side) and west (left side) walls of the intensity depletions. The red lines are east-west scan obtained at 23:56:59 LT and repeated in all the panels. The blue lines are the east-west scans obtained at different times indicated in the panels.
bubble characteristic in a more pronounced way, and it per-mits more precise calculations of the plasma bubble drift ve-locities. Also, this image allows for the calculation of the plasma bubble drift velocities at several latitudes, by taking intensity scans in the east-west direction. From the analysis of consecutive processed images (in the Cartesian grid), it is possible to determine the time variations of the zonal plasma drift velocities at several latitudes, as shown in Figs. 1b and 2.
The irregularities characterized by large-scale F-region plasma depletions (plasma bubbles) extend several thousands of kilometers across the magnetic equator, with east-west di-mensions ranging from a few tens of kilometers to a few hundred kilometers, with fine structures in the range of a few kilometers. It should be mentioned that the OI 630 nm
imaging observations provide a two-dimensional bottomside view (dark structures in Fig. 1) of the ionospheric bubbles that extend into the topside ionosphere and across the entire equatorial region (Weber et al., 1980). From the spatial dis-placements of the dark structures, during successive images, we can infer the irregularity zonal drift velocities, which are closely related to the ionospheric zonal plasma drift veloci-ties. Also, the nighttime ionospheric plasma drift velocities in the equatorial region are approximately equal to the ther-mospheric zonal winds (Rishbeth, 1971; Biondi et al., 1988). The plasma bubbles, which generally drift toward the east, have their own internal space-time dynamics, lead-ing to changes in their shapes, dimensions and wall struc-ture/gradient. These structural variations with time may lead to errors in the calculated zonal drift velocities. Using radar
2318
14
A. A. Pimenta et al.: Equatorial F-region plasma depletion drifts 20 21 22 23 24 40 60 80 100 120 140 160 180ZONAL DRIFT (+) EASTWARDLATITUDE = 22.7
0S
NOVEMBER 02, 1999 MEASUREMENT ON WESTERN WALL MEASUREMENT ON DEPLETION MEASUREMENT ON EASTERN WALL
PLASMA B U B B LE ZONA L DR IFT (m /s ) LOCAL TIME
Figure 3. Zonal plasma drifty velocities calculated using either the displacement of the center of the
depletion, or the eastern wall, or the western wall of the plasma bubble.
100 102 104 106 108 110 112 114 116 118 120 250 260 270 280 290 300 OI 630.0 nm LATITUDE = 22.70S 21.9 LT JANUARY 19,1999 E M IS SION LAYER PEAK HEIGHT (km )
PLASMA BUBBLE ZONAL DRIFT (m/s)
Figure 4. Calculated zonal plasma bubble drift velocities using the same set of linearized images,
but assuming the OI 630 nm emission peak height at different altitudes.
Fig. 3. Zonal plasma drifty velocities calculated using either the displacement of the center of the depletion, or the eastern wall, or the western wall of the plasma bubble.
backscatter observations, Tsunoda (1983) has reported struc-tures of the west walls (upwelling) of plasma bubbles by the wind-driven gradient drift instability. Mendillo and Baum-gardner (1982) have presented results of the OI 630 nm all-sky imaging observations of the plasma bubbles and reported that the intensities, within depletions (dark structures), were typically 40–50% of the background levels. They also re-ported that the western walls of the depletions usually had a steeper gradient than the corresponding eastern walls.
Figure 2 presents a sequence of four east-west intensity scans, through zenith, of the linearized image slices for about 1 h, between 23:57 to 00:54 LT on 1–2 January 2000. The red lines are the east-west scans obtained at 23:56:59 LT (e.g. see Fig. 1b for latitude 22.7◦S). The blue lines are the east-west scans obtained at consecutive times, as indicated in Fig. 2. From a perusal of the four panels (Fig. 2), it is clearly no-ticed that the inclination (density gradient) of the western wall does not change with time (it has a relatively stable structure), whereas the inclination, or density gradient, of the eastern wall changes with time, indicating that the bottom-side of the plasma bubble, as seen by the OI 630 nm emis-sion, becomes broader and broader on the eastern side. The observed plasma bubble wall structures are similar to those reported by Mendillo and Baumgarder (1982), with the west-ern wall of the depletion having a steeper gradient than the corresponding eastern wall. The changes in shape of the east-ern wall could be associated with the strong thermosphere-ionosphere coupling which takes place in the bottomside of the F-region. Therefore, an approach to obtain the time varia-tion of the plasma drift velocities, based on the western wall, reduces the effects due to the internal space-time dynamics of the plasma bubble, since the OI 630 nm emission intensity gradient, at the western wall, is more stable than the corre-sponding gradient at the eastern wall.
14
20 21 22 23 24 40 60 80 100 120 140 160 180ZONAL DRIFT (+) EASTWARDLATITUDE = 22.7
0S
NOVEMBER 02, 1999 MEASUREMENT ON WESTERN WALL MEASUREMENT ON DEPLETION MEASUREMENT ON EASTERN WALL
PLASMA B U B B LE ZONA L DR IFT (m /s ) LOCAL TIME
Figure 3. Zonal plasma drifty velocities calculated using either the displacement of the center of the
depletion, or the eastern wall, or the western wall of the plasma bubble.
100 102 104 106 108 110 112 114 116 118 120 250 260 270 280 290 300 OI 630.0 nm LATITUDE = 22.70S 21.9 LT JANUARY 19,1999 E M IS SION LAYER PEAK HEIGHT (km )
PLASMA BUBBLE ZONAL DRIFT (m/s)
Figure 4. Calculated zonal plasma bubble drift velocities using the same set of linearized images,
but assuming the OI 630 nm emission peak height at different altitudes.
Fig. 4. Calculated zonal plasma bubble drift velocities using the same set of linearized images, but assuming the OI 630 nm emission peak height at different altitudes.
In the present study we have used the time-displacements of the western walls of the plasma bubbles to estimate the plasma drift velocities. Figure 3 shows a comparison of the local time variations of the zonal plasma drift veloci-ties inferred from the plasma bubbles on the night of 2–3 November 1999, using either the time-displacements of the western walls, or the minimum level of the intensity deple-tions, or the eastern walls. The methodology is based on Pimenta et al. (2001b). It is observed, from Fig. 3, that the local time variations of the plasma drift velocities, using the three different approaches, are fairly similar, but the veloci-ties inferred differ significantly (the drift velociveloci-ties obtained from the minimum depletion intensities are about 10%–20% higher than those obtained from the western walls, whereas the difference increases to about 40% between those inferred from the western walls and from the eastern walls).
Also, we have considered that the OI 630 nm emission peak height is located at 250 km. However, during the course of a night the OI 630 nm peak emission height undergoes changes around 250 km, due to the F-layer peak height vari-ations. In Fig. 4 we present the changes in the plasma drift velocities for different OI 630 nm emission peak heights. It is observed that, if the OI 630 nm emission peak height is considered as 300 km, instead of 250 km, the plasma drift velocities increase by about 20%.
3 Results and discussion
3.1 Zonal plasma drift
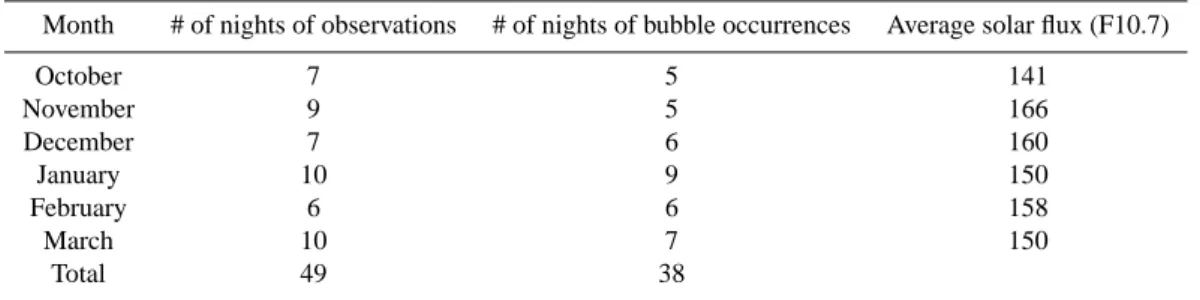
The occurrence of plasma bubbles, in the period May– August (winter-time in the Southern Hemisphere), is a very rare phenomenon over the Brazilian sector (Sahai et al., 2000; Pimenta et al., 2001a). Thus, average monthly
lati-Table 1. Observations around equinox and summer during moderate-to-high solar activity (October–March, between the years 1998–2000)
Month # of nights of observations # of nights of bubble occurrences Average solar flux (F10.7)
October 7 5 141 November 9 5 166 December 7 6 160 January 10 9 150 February 6 6 158 March 10 7 150 Total 49 38
tudinal and nighttime variations of the plasma drift veloci-ties can only be studied during the period from October to March. The period and conditions of the observations stud-ied in the present investigation correspond to geomagnetic quiet conditions and moderate-to-high solar activity. Table 1 shows the details of the observations during the months stud-ied, when strong plasma bubble occurrences are normally present, as mentioned earlier (periods October–March, be-tween the years 1998 to 2000).
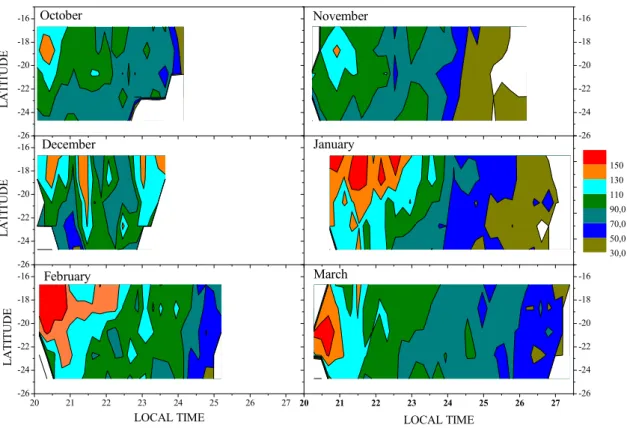
The observed average latitudinal and nighttime monthly zonal plasma drift velocities, from October to March, are shown as contour maps in Fig. 5. The nocturnal variation pat-terns, for all months, show high eastward drift velocities in the evening hours (20:00 to 22:00 LT), with the velocities de-creasing gradually after 22:00 LT. However, the zonal plasma drift velocities and their latitudinal distributions are different for each month, characterizing monthly changes. The maxi-mum zonal drifts velocities are observed during the evening hours, having higher values (>150 m/s) during the months of January, February and March, and, in general, such large velocities are in the northward sector of the observation site. As we move from October to February, the maximum veloc-ity locations move to southward and higher velocities have longer durations. During the month of March, the velocity variations are again similar to the October conditions.
Figure 6 shows contour maps of the zonal neutral wind velocities obtained from the HWM-90 model (Hedin et al., 1991), for the same latitude region and months for which data are presented in Fig. 5, in order to compare their mag-nitudes and shapes with the observed zonal drift velocities. It is noted that both the monthly and nocturnal variations are very similar.
Sahai et al. (1992) have reported observations of zonal neutral wind velocities at Cachoeira Paulista, for the pe-riod March, 1988–December, 1989. The winds are eastward throughout the night, for all the seasons, and are stronger during the early part of the night. The nocturnal variations show a monotonic decrease after midnight. The average so-lar activity for the present plasma bubble drift velocity ob-servations is very similar to that of the zonal neutral wind velocity observations presented by Sahai et al. (1992). A comparison of the zonal neutral wind velocities inferred at C. Paulista (Sahai et al., 1992) and the plasma bubble zonal drift velocities, inferred in the present work, for equinox and
summer periods, shows that both the nocturnal variations and the magnitudes are fairly similar.
Figures 5 and 6 give clear indications that the observed zonal plasma bubble drift velocities and the zonal neutral wind velocities (HWM-90 model) have similar latitudinal and nighttime variations and this confirms the suggestion, from theoretical considerations, that the nighttime zonal plasma drift velocities, near the equator, are approximately equal to the F-region neutral zonal winds (Biondi et al., 1988). The zonal F-region wind dynamo drives the Peder-sen currents and creates a vertical polarization electric field, which forces the plasma to drift at nearly the same velocity as the neutral wind velocity (Rishbeth et al., 1971). On the other hand, the results reported in Fig. 5 supplement the Biondi et al. (1999) by extending the measurements into the sum-mer season. The results of this work suggest that the strong coupling between the thermosphere and the ionosphere takes place not only in equatorial region, as proposed earlier, but it also extends to low latitude regions, including the equatorial ionospheric anomaly region.
3.2 Plasma bubble wall dynamics
As mentioned before, plasma bubbles are F-region large-scale irregularities that are quasi-north-south magnetic field-aligned (see Fig. 1). The electron density in a plasma bubble is substantially lower than the ambient ionospheric electron density. The plasma bubble walls, considered here, are the regions where there are strong plasma density gradients (see Fig. 2), separating the inside and the outside of the plasma bubble structures. In an effort to find the best way to cor-rectly infer the plasma bubble drift velocities, using the OI 630 nm emission, we have investigated the differences in the time evolution of the plasma bubble walls, as seen through the 630 nm emission.
The lifetime of the atomic oxygen excited state O(1D), from which the OI 630 nm emission originates, is approxi-mately 110 seconds, which is relatively large. Therefore, the OI 630 nm emission images will show blurring effects, due to O(1D) diffusion, and spatial structures of the order of 30 km or less will not be perceptible. However, it is expected that the blurring effects will be equally experienced by both the western and eastern walls of the plasma bubble and, there-fore, the above mentioned progressive variation of the
incli-2320 A. A. Pimenta et al.: Equatorial F-region plasma depletion drifts -26 -24 -22 -20 -18 -16 30,0 50,0 70,0 90,0 110 130 150 LA T ITU D E November -26 -24 -22 -20 -18 -16 December LA TI TUD E January 20 21 22 23 24 25 26 27 -26 -24 -22 -20 -18 -16 February October LA TI TUD E LOCAL TIME 20 21 22 23 24 25 26 27 March LOCAL TIME -26 -24 -22 -20 -18 -16 -26 -24 -22 -20 -18 -16
Figure 5
Fig. 5. Contour maps showing latitudinal monthly zonal plasma drift velocity variations, as a function of local time, during geomagnetically quiet conditions for moderate-to-high solar activity.
16
Figure 6- HWM-90 output model maps showing latitudinal and nighttime neutral zonal wind
velocity variations, for October to March, during high solar activity conditions.
-26 -24 -22 -20 -18 -16 30.0 50.0 70.0 90.0 110 130 150 L A TI TU D E -26 -24 -22 -20 -18 -16 L A TITU D E 20 21 22 23 24 25 26 -26 -24 -22 -20 -18 -16 February March January December November October L A TITU D E
LOCAL TIME 20 21 LOCAL TIME22 23 24 25 26
-26 -24 -22 -20 -18 -16 L A TI TU D E -26 -24 -22 -20 -18 -16 L A TI TU D E
Fig. 6. HWM-90 output model maps showing latitudinal and nighttime neutral zonal wind velocity variations, for October to March, during high solar activity conditions.
nation (density gradient) of the eastern wall is not related to the relatively large lifetime of the O(1D) atoms.
It should be pointed out that, at nighttime, both the ther-mospheric zonal neutral winds and the F-region plasma usu-ally blow eastward, with nearly similar velocities. However, reduced plasma density inside the bubble decreases the ion-neutral interaction, which may result in slightly higher neu-tral wind velocities inside the bubble. Therefore, it is possi-ble that the leading edge of the plasma bubpossi-ble (eastern wall) undergoes a more strong interaction with the flowing neutral atmosphere. The extra momentum transfer from the wind to the plasma, at the eastern wall, may contribute to the widen-ing of the plasma bubble on the eastern side, which is re-flected as the progressive variation in the eastern wall incli-nation. Also, this strong interaction at the eastern wall possi-bly contributes in the decay phase of a plasma bubble and its lifetime.
It is felt that simultaneous all-sky imaging observations of the region emissions OI 777.4 nm (which peaks at the F-region peak height) and OI 630 nm (about one scale-height below the F-region peak), as well as measurements of ther-mospheric neutral winds (both zonal and meridional), will be important for a better understanding of the plasma bubble onset, evolution, dynamics and decay.
4 Conclusions
Using a methodology proposed by Pimenta et al. (2001b), zonal plasma bubble drift velocities were inferred using OI 630 nm emission images. The plasma bubble drift velocities are about the same as the velocity of the ambient plasma. The methodology used improves the precision of the zonal drift velocities inferred, by taking into account the plasma bubble shape and its dimension variations. Also, it has been shown that the west wall of the plasma bubble is the best seg-ment to be used as a reference to calculate the plasma bubble displacements. The observations reported here were carried out at low latitudes in Brazil, during moderate-to-high so-lar activity and quiet geomagnetic conditions. These results show that the latitudinal range covered by the all-sky imag-ing system is very useful for zonal plasma drift latitudinal variation studies. Further analysis of the database considered is being continued, to yield valuable information related to thermosphere/ionosphere structure and dynamics. The prin-cipal features of the present investigation are summarized be-low. The east and west walls of the plasma bubbles present a different evolution with time. The time evolution of the west wall shows only small changes in its inclination (den-sity gradient), whereas the time evolution of the east wall shows large changes in its inclination.
1. The zonal plasma bubble drift velocities are eastward throughout the night, during all the months studied. 2. The latitudinal and nocturnal variations, for all the
months, show high eastward plasma bubble drift veloc-ities in the evening hours (20:00–22:00 LT). The
maxi-mum eastward drift velocity is about 170 m/s and occurs at 20:40 LT in summer at about 18◦S. After midnight,
the eastward plasma bubble drift velocities decrease for both seasons (equinox and summer), but during equinox they reach lower velocities than in summer.
3. The observed zonal plasma bubble drift velocities and the zonal neutral wind velocities, obtained from the HWM-90 model, show similar patterns, indicating a strong thermosphere/ionosphere coupling at low lati-tudes, including the equatorial ionospheric anomaly re-gion.
Acknowledgements. The authors acknowledge the Fundac¸˜ao de
Amparo `a Pesquisa do Estado de S˜ao Paulo (FAPESP) for the support received through processes 97/13069-4, 95/09207-1 and 98/09892-0, and the Conselho Nacional de Desenvolvimento Cient-fico e Tecnol´ogico (CNPq) through process 300955/93-6. US Na-tion Science FoundaNa-tion Grant ATM-9525815 supported part of the all-sky imager and nightglow measurements reported here. We thank Dr. H. Takahashi for the all-sky imaging data.
Topical Editor M. Lester thanks a referee for his help in evalu-ating this paper.
References
Abalde, J. R., Fagundes, P. R., Bittencourt, J. A., and Sahai, Y.: Observations of equatorial F-region plasma bubbles using simul-taneous OI 777.4 nm and OI 630.0 nm imaging: New results, J. Geophys. Res., 30 331–30 336, 2001.
Biondi, M. A., Meriwether, J. W., Fejer, B., Woodman, R.: Mea-surements of The Dynamics and Coupling of the Equatorial Thermosphere and the F-Region Ionosphere in Peru, J. At-mos.Terr. Phy., 50, 937–942, 1988.
Biondi, M. A., Sazykin, S. Y., Feger, B. G., and Fesen, C. G.: Equa-torial and low latitude thermospheric winds: Measured quiet time variations with season and solar flux from 1980 to 1990, J. Geo-phys. Res., 104, 17 091–17 106, 1999.
Bittencourt, J. A., Sahai, Y., Fagundes, P. R., and Takahashi, H.: Simultaneous observations of equatorial F-region plasma deple-tions and thermospheric winds, J. Atmos. Terr. Phys., 59, 1049– 1059, 1997.
Colerico, M., Mendillo, M., Nottingham, D., Baumgardner, J., Meriwether, J., Mirick, J., Reinisch, B. W., Scali, J. L., Fesen, C. G., and Biondi, M. A.: Coordinated measurements of F re-gion dynamics related to the thermospheric midnight tempera-ture maximum, J. Geophys. Res., 101, 26 783–26 794, 1996. Fagundes, P. R., Sahai. Y., Batista, I. S., Bittencourt, J. A., and
Abdu, M. A.: Vertical and zonal equatorial F-region plasma bub-ble velocities determined from OI 630 nm nightglow imaging, Adv. Space Res., 6, 1297–1300, 1997.
Garcia, J. F., Taylor, J. M., and Kelley, M. C.: Two-dimensional spectral analysis of mesospheric airglow image data, Applied Optics, 36, 29, 7374–7385, 1997.
Hedin, A. E., Biondi, M. A., Burnside, R. G., Hernandez G., John-son, R. M., Killeen, T. L., Mazaudier, C., Meriwether, J. W., Salah, J. E., Sica, R. J., Smith, R. W., Spencer, N. W., Wickwar, V. B., and Virdi, T. S.: Revised Global-Model Of Thermosphere Winds Using Satellite And Ground-Based Observations, J. Geo-phys. Res., 96, 7657–7688, 1991.
2322 A. A. Pimenta et al.: Equatorial F-region plasma depletion drifts Mendillo, M. and Baumgardner, J.: Airglow characteristics of
equa-torial plasma depletions, J. Geophys. Res., 87, 7641–7652, 1982. Mendillo, M., Baumgardner, J., Colerico, M., and Nottingham, D.: Imaging science contributions to equatorial aeronomy: initial re-sults from the MISETA program, J. Atmos. Solar-Terr. Phys. 59, 1587–1599, 1997a.
Mendillo, M., Baumgardner, J., Nottingham, D., Aarons, J.,
Reinisch, B., Scali, J., and Kelley, M.: Investigations of
thermospheric-ionospheric dynamics with 630 nm images from the Arecibo observatory, J. Geophys. Res., 102, 7331–7344, 1997b.
Moore, J. G. and Weber, E. J.: OI 6300 and 7774P airglow
mea-surements of equatorial plasma depletions, J. Atmos. Terr. Phy., 43(8), 851–858, 1981.
Pimenta, A. A., Fagundes, P. R., Bittencourt, J. A., and Sahai, Y.: Relevant aspects of equatorial plasma bubbles under different so-lar activity conditions, Adv. Space Res., 27, 1213–1218, 2001a. Pimenta, A. A., Fagundes, P. R., Bittencourt, J. A., Sahai, Y., Gobbi,
D., Taylor, M. J., and Takahashi, H.: Ionospheric plasma bub-ble zonal drift: A methodology using OI 630 nm all-sky imaging systems, Adv. Space Res., 27, 1219–1224, 2001b.
Rishbeth, H.: Polarization Fields Produced by Winds in Equatorial F-Region, Planet. Space Sci., 19, 357, 1971.
Rohrbaugh, R. P., Hanson, W. B., Tinsley, B. A., Cragin, B. L., Mc-Clure, J. P., and Broadfoot, A. L.: Images of transequatorial bub-bles based on field-aligned airglow observations from Haleakata in 1984–1986, J. Geophys. Res., 94(A6), 6763–6770, 1989. Sahai, Y., Bittencourt, J. A., Teixeira, N. R., and Takahashi, H.:
Plasma irregularities in the tropical F-region detected by OI 7774 nm and 6300 nm nightglow measurements, J. Geophys. Res., 86(A5), 3496–3500, 1981.
Sahai, Y., Takahashi, H., Fagundes, P. R., Clemesha, B. R., Teixeira, N. R., and Bittencourt, J. A. A.: Observations of thermospheric
Neutral Wind at 23◦S, Planet. Space Sci., 40, 767–773, 1992.
Sahai, Y., Fagundes, P. R., and Bittencourt, J. A.: Transequatorial
F-region ionospheric plasma bubbles: solar cycle effects, J. At-mos. Terr. Phys., 62, 1377–1383, 2000.
Santana, D. C., Sobral, J. H. A., Takahashi, H., and Taylor, M. J.: Optical studies of the ionospheric irregularities over the Brazil-ian region by nocturnal images of the OI 630 nm emission, Adv. Space Res., 27 (6/7), 1207–1212, 2001.
Taylor, M. J., Eccles, J. V., LaBelle, J., and Sobral, J. H. A.: High resolution OI (630 nm) image measurements of F-region deple-tion drifts during the Guara campaign, Geophys. Res. Lett., 24 1699–1702, 1997.
Tinsley, B. A.: Field aligned observations of transequatorial bub-bles in the tropical F-region, J. Atmos. Terr. Phys., 44, 547–557, 1982.
Tinsley, B. A., Rohrbaugh, R. P., Hanson, W. B., and Broadfoot, A. L.: Images of transequatorial F-region bubbles in 630- and 777-nm emissions compared with satellite measurements, J. Geo-phys. Res., 102(A2), 2057–2077, 1997.
Tsunoda, R. T.: On the Generation and Growth of Equatorial Backscatter Plumes, 2. Structuring Of The West Walls of Up-wellings, J. Geophys. Res. 88, 4869–4874, 1983.
Valladares, C. E., Meriwether, J. W., Sheehan, R., and Biondi, M. A.: Correlative study of neutral winds and scintillation drifts measured near the magnetic equator, J. Geophys. Res., doi: 10.1029/2001JA000042, 2002.
Weber, E. J., Buchau, J., Eatther, R. H., and Mende, S. B.: North-south aligned equatorial airglow depletions, J. Geophys. Res., 83, 712–716, 1978.
Weber, E. J., Buchau J., and Moore, J. G.: Airborne Studies Of Equatorial F-Layer Ionospheric Irregularities, J. Geophys. Res., 85, 4631–4641, 1980.
Woodman, R. F.: East-west ionospheric drifts at the magnetic equa-tor, Space Res., 12, 968–974, 1972.
Zalesak, S. T., Ossakow, S. L., and Chaturvedi, P. K.: Nonlinear equatorial Spread F: The effect of neutral winds and background Pedersen conductivity, J. Geophys Res. 87, 151–166, 1982.