Developing Osteoarthritis Treatments through Cartilage Tissue Engineering and Molecular Imaging
ARCHIVES
by (MASSACHUSETTS INSTITUTE
OF 'TEC(H'NO0LOGrY Nicole Casasnovas Ortega
JUL I021
B. S. Chemical EngineeringUniversity of Puerto Rico at Mayaguez _
LBARJES
Submitted to the Department of Biological Engineering in Partial Fulfillment of the Requirements for the Degree of
Master of Science in Biological Engineering
at the
Massachusetts Institute of Technology
June 2012
© 2012 Massachusetts Institute of Technology. All rights reserved.
Signature of Author _______ _____
Department of Bioltigical Engineering [February 15, 2012]
7
/7
/ z2
Certified by
Profsso o BioogialAlan J. Grodzinsky
Professor og ctrical,and Mechanical Engineering Thesis Supervisor
Accepted by
1
Forest M. White Associate Professor of Biological Engineering Chair, Biological Engineering Graduate Program Committee
Developing Osteoarthritis Treatments through Cartilage Tissue Engineering and Molecular Imaging
by
Nicole Casasnovas Ortega
Submitted to the Department of Biological Engineering on February 15, 2012 in Partial Fulfillment of the Requirements for the Degree of Master of Science in
Biological Engineering
Abstract
Tissue engineering can be applied to develop therapeutic techniques for osteoarthritis, a degenerative disease caused by the progressive deterioration of cartilage in joints. An inherent goal in developing cartilage-replacement treatments is ensuring that tissue-engineered constructs possess the same properties as native cartilage tissue. Biochemical assays and imaging techniques can be used to study some of the main components of cartilage and assess the value of potential therapies.
Agarose and self-assembling peptides have been used to make hydrogels for in vitro culture of bovine bone marrow stromal cells (BMSCs) which can differentiate into chondrocytes, undergo chondrogenesis, and produce cartilage tissue. So far, differences in cell morphology that characterize chondrogenesis had been observed in peptide hydrogels like KLD and RAD but not in the 2.0% agarose hydrogels typically used for culture. A tissue engineering study was conducted to determine if a suitable environment for cell proliferation and differentiation could be obtained using different agarose compositions. BMSCs were cultured in 0.5%, 1.0%, and 2.0% agarose hydrogels for 21 days following
TGF-p1 supplementation. Results indicate that the 0.5% agarose hydrogels are clearly
inferior scaffolds when compared to the 1.0% and 2.0% agarose hydrogels, which are generally comparable. Since agarose gels appear to be suboptimal in promoting chondrogenesis, self-assembling peptides should be used in future studies.
In addition to the biochemical assays traditionally used in cartilage tissue engineering studies, atomic force microscopy (AFM) can be used to image aggrecan, one of the main components of cartilage. Imaging studies were carried out using fetal bovine epiphyseal aggrecan to optimize previous extraction and sample preparation procedures, as well as an AFM imaging protocol, for samples containing aggrecan. Experiments were conducted with
10, 25, and 50 ptg/mL aggrecan solutions to find the minimum concentration needed to
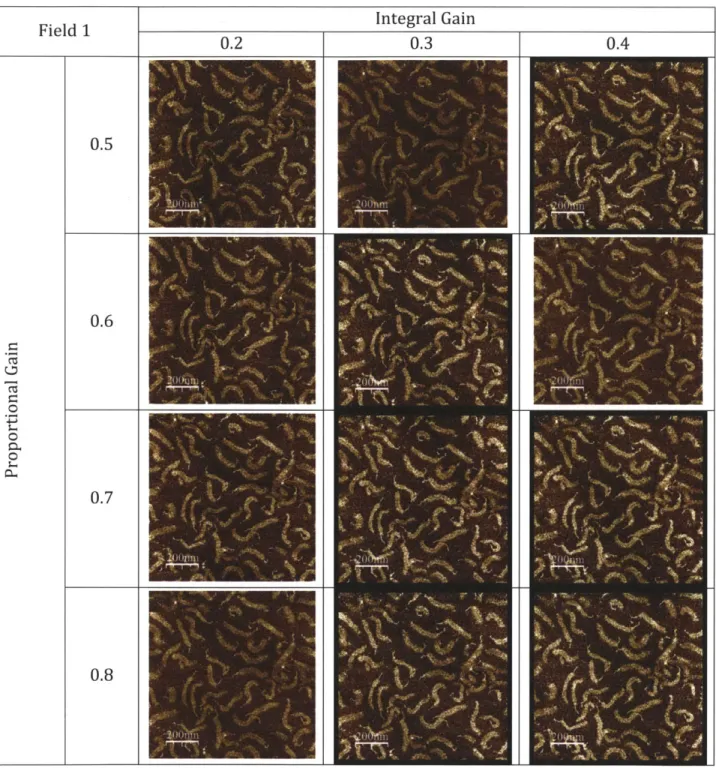
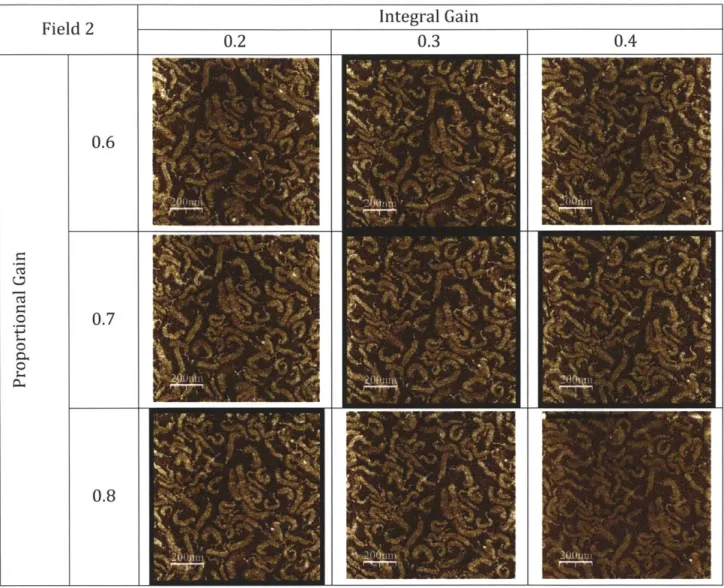
ptg/mL). AFM instrument and software parameters were optimized to find the working range of the integral and proportional gains (0.2 - 0.4 and 0.6 - 0.8, respectively) and to
increase the resolution, showing fields at the 800 nm level. Finally, an image processing protocol relevant to these molecules was established.
Thesis Supervisor: Alan J. Grodzinsky
Acknowledgements
My time at MIT has been filled with a variety of experiences which have led to both
professional development and personal growth. Taking part in my graduate program and contributing to an exciting area of biomedical research has helped me become a more skilled scientist and engineer. I have also had the opportunity to develop my capacity for analytical, strategic, and organizational thinking, particularly through leadership and volunteer positions within the MIT community. Furthermore, my graduate school experience has been an enriching and fulfilling one where I have become more aware of my interests, values, and ideals.
That being said, I would like to thank the people who have supported me over the past couple of years and who have helped make my experience at MIT a positive one.
First of all, I would like to thank Alan Grodzinsky for being a wonderful professor and my advisor. I have learned a lot through his example as a scientist and his enthusiasm towards both his work and his personal life. Al has been very encouraging and understanding as I have been conducting my thesis work. He has also supported me when I've taken time to pursue opportunities related to my professional interests. I will always be thankful for the role he has played in shaping my career.
I would also like to thank my fellow Grodzinsky lab members for maintaining a friendly
work environment and for helping me out when I had to learn new lab techniques. A special thanks to Paul Kopesky, Rachel Miller, and Emily Florine for their help with cell culture techniques and biochemical assays. Hsu-Yi Lee and Lin Han were also helpful when working on aggrecan extraction and AFM imaging methods. Last, but not least, I would like to extend a very special thanks to Han-Hwa Hung for her help in performing a variety of lab
protocols, as well as her welcoming, jovial, and supportive attitude.
Other key players in my graduate education were the MIT Department of Biological Engineering (BE) and the MIT-NIGMS Biotechnology Training Program (BTP). In addition to providing high-quality education and research funding, the BE department and BTP coordinators strive to maintain a community where students, staff, and faculty can exchange ideas and collaborate with one another. I have many good friends within these circles and always look forward to seeing them in special retreats, seminars, and discussion sessions. Specifically, I would like to thank Doug Lauffenburger, Forest White, K. Dane Wittrup, Dalia Fares, Darlene Ray, Daniel Darling, and Alan Parillo for their part in providing a positive graduate experience for me. My deepest appreciation goes out to Blanche Staton, the Senior Associate Dean for Graduate Students, and other members of the MIT administration who dedicate themselves to maintaining and improving the quality of life of students at MIT.
Another important part of my life at MIT has been my experience living at Ashdown House, a graduate residence with an active and diverse community of MIT graduate students. Many of my friends at MIT are fellow residents and we have shared fun activities in social settings both within MIT and the greater Boston area. I would like to thank Ann and Terry Orlando, the housemasters at Ashdown House, as well as fellow volunteer officers with whom I have worked with on different community projects for being a part of my life at MIT. Similarly, I am grateful of my time working with other multidisciplinary student groups like the MIT Science Policy Initiative and the MIT Graduate Student Council (GSC). Finally, I would like to thank my family for their unconditional love and support. My mom, dad, and brother have always inspired and encouraged me to reach for the stars and trust my heart while making decisions. It is truly a privilege to have such a wonderful, kind, and loving family. I hope they are as proud of me as I am of them.
Table of Contents
List of Figures ... 9
Chapter 1: Introduction ... 11
1.1 O steoarthritis and Current Treatm ents... 11
1.2 Cartilage and A ggrecan ... 11
1.3 Cartilage T issue Engineering ... 13
1.4 A tom ic Force M icroscopy Im aging ... 14
1.5 T hesis O verview ... 14
1.6 Figures ... 17
1.7 R eferences... 21
Chapter 2: Culture of Bone Marrow Stromal Cells in Agarose Hydrogels ... 25
2.1 Introduction ... 25
2.2 M aterials and M ethods... 26
2.3 R esults and D iscussion ... 30
2.4 Conclusions... 31
2.5 Figures ... 33
2.7 R eferences... 4 1 Chapter 3: Atomic Force Microscopy Imaging Assay for Cartilage Tissue Engineering... 43
3.1 Introduction ... 43
3.2 M aterials and M ethods... 44
3.3 R esults and D iscussion ... 45
3.4 Conclusions... 47
3.5 Figures ... 49
3.6 R eferences... 59
Chapter 4: Sum m ary and Conclusions ... 61
A ppendix ... 63
A .1 Isolation and Expansion of B M SC's ... 63
A .2 Thaw and Expansion of Cryopreserved B M SC's ... 67
A .3 Encapsulation of BM SC's in H ydrogels ... 71
A .6 Lyophilization and Proteinase K D igestion... 8 1
A .7 GA G A ssay ... 83
A .8 D N A A ssay ... 85
A .9 R adiolabel Incorporation A ssay ... 89
A .10 A ggrecan Extraction ... 95
List of Figures
Chapter 1: Introduction
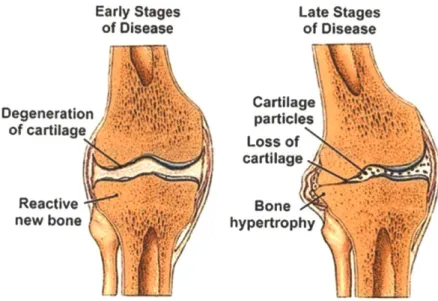
Figure 1.1 Progression of Osteoarthritis in the Knee... 17
Figu re 1.2 A ggrecan M olecu le ... 17
Figure 1.3 Cartilage Tissue Engineering System... 19
Chapter 2: Culture of Bone Marrow Stromal Cells in Agarose Hydrogels Figure 2.1 Morphology Images for Bovine BMSCs Encapsulated in Self-Assembling Peptide H y d ro g e l S ca ffo ld s ... 3 3 Figure 2.2 Cell Encapsulation in Hydrogels within Agarose Rings... 33
Figure 2.3 Cell Viability and Morphology for BMSC's Seeded in Agarose Hydrogels ... 35
F ig u re 2 .4 G A G A ssay ... 3 5 F ig u re 2 .5 D N A A ssay ... 3 7 Figure 2.6 BMSC-Seeded Gel Weights ... 37
Figure 2.7 Radiolabel Incorporation Assay... 39
Chapter 3: Atomic Force Microscopy Imaging Assay for Cartilage Tissue Engineering Figure 3.1 Aggrecan Imaging Using AFM Tapping Mode... 49
Figure 3.2 NanoScope Ila Multimode AFM ... 49
Figure 3.3 Image Processing Heuristic ... 51
Figure 3.4 Test of Established Conditions for Sample Preparation... 51
Figure 3.5 Minimization of Aggrecan Concentration Needed During Sample Preparation...51
Figure 3.6 Integral and Proportional Gains During AFM Imaging ... 53
Figure 3.7 Integral and Proportional Gains During AFM Imaging ... 55
Chapter 1: Introduction
1.1 Osteoarthritis and Current Treatments
Osteoarthritis (OA), sometimes called degenerative joint disease, is the most common form of arthritis. It affects over 27 million people in the United States, particularly women over the age of 40 and the elderly [1.1]. People who are overweight, have suffered from joint injury, exhibit muscle weakness, or have bone deformities present an increased risk of developing this disease [1.2].
The main cause of osteoarthritis is the progressive deterioration of the cartilage that cushions bones in joints, specifically joints in the hands, hips, knees, and spine. As seen in Figure 1.1, the smooth surface of the cartilage becomes rough and, eventually, the cartilage may wear down completely, causing the bones at the affected joint to rub against each other [1.3]. As one would expect, this results in pain, stiffness, or loss of flexibility in the joints. Other characteristic symptoms of CA include swelling of the joints, a grating sensation when using the affected joint, and the presence of bone spurs or hard lumps that involve physical deformation [1.2, 1.3].
Osteoarthritis symptoms often develop slowly and worsen over time. Joint pain and stiffness may become severe enough to make getting through the day difficult, if not impossible. A French study found that more than 80% of clinical CA patients reported limitations in their daily lives, including basic tasks, work, and leisure activities [1.4]. As a result, people with CA can often feel desperate or frustrated when coping with their new limitations, which may lead to depression or other mental disorders [1.5].
Treatments depend on the severity of the disease. For mild to moderate OA, treatments include rest, exercise, physical therapy, losing weight, pain relievers, and drugs like acetaminophen or ibuprofen. Patients with severe OA may need to resort to stronger painkillers, cortisone shots, or even surgery such as joint replacement, realigning bones, and cleaning up the area around the joint. Unfortunately, there is no cure for osteoarthritis and the treatments available only alleviate symptoms temporarily [1.2, 1.6].
1.2 Cartilage and Aggrecan
Cartilage is an elastic and flexible connective tissue found in many areas of the body including intervertebral discs, the ear, the nose, and joints between bones. As such, some of the main functions of cartilage are providing structural support for body tissues, improving movement by reducing friction between bones, and preventing joint damage by acting as a shock absorber [1.7, 1.8].
Some of the main types of this tissue are fibrous, elastic, and articular cartilage. Fibrous cartilage may be found in areas like the intervertebral discs of the spinal cord, while elastic cartilage is located in places such as the outer ear, nose, and larynx. Articular cartilage, or hyaline cartilage, can be found in the joints between bones, notably in areas like the knees and the hips [1.7]. As observed in patients with osteoarthritis, articular cartilage does not regenerate in adults. Although superficial damage can heal in the very young, for all practical purposes injuries to hyaline cartilage heal with fibrous cartilage which has inferior weight-bearing properties [1.8, 1.9].
Hyaline cartilage functions as a low-friction, wear-resistant tissue designed to bear and distribute loads. This tissue is composed of specialized cells called chondrocytes that produce an extracellular matrix (ECM) rich in collagen fibers, proteoglycans, and other proteins and biomolecules, giving articular cartilage its characteristic mechanical properties [1.10]. Although cells make up only about 5% of the wet weight, chondrocyte metabolism is responsible for the maintenance of a stable and abundant ECM. The balance between anabolism and catabolism of the matrix is crucial for articular cartilage homeostasis and providing hyaline cartilage with viscoelastic and mechanical properties for efficient load distribution. [1.8]
Collagens are involved in defining structural integrity and some physiological functions of neighboring cells within cartilage tissue. Additionally, collagen degradation and disturbed metabolism are important in the course of OA [1.10]. There are many types of collagen, each with different properties. Type II collagen is the characteristic and predominant component of cartilage. It has the ability to assemble into highly oriented fibril aggregates that help mediate the interaction with proteoglycans. Fibrous cartilage contains type III collagen and is less durable than articular cartilage [1.7, 1.11].
Aggregating proteoglycans and other hyaluronan-binding proteins enmeshed in the collagen matrix provide the complex mechanism that allows cartilage tissue to resist deformation. These molecules contribute to the material and biological properties of the matrix and regulate cell and tissue function [1.11, 1.12]. The proteoglycan superfamily contains more than 30 full-time molecules that fulfill a variety of biological functions. For instance, proteoglycans act as tissue organizers, influence cell growth and the maturation of specialized tissues, play a role as biological filters, regulate collagen fibrillogenesis and skin tensile strength, and influence corneal transparency. The presence of aggregating proteoglycans in the ECM confers a high fixed negative charge density due to the numerous chondroitin sulfate chains, and can have important effects on the material properties and permeability of the matrix [1.12].
One of the prevalent molecules in the cartilage ECM is aggrecan, depicted in Figure 1.2
sulfates and has covalently attached glycosaminoglycan (GAG) side chains, as well as a small number of keratan sulfate chains. There may be about 100 chondroitin sulfates per aggrecan molecule. Aggrecan has a tridomain structure: an N-terminal domain that binds hyaluronan, a somewhat central domain that carries the glycosaminoglycan side chains, and a C-terminal region that binds lectins [1.12].
GA is characterized by the damage or destruction of the aforementioned components of
cartilage. Molecules originating from articular cartilage, including aggrecan and type II collagen fragments, are usually released as degradation products as a result of catabolic processes. Therefore, these molecules serve as biomarkers that reflect quantitative and dynamic changes in the degradation products of cartilage, providing a means of identifying patients at risk for rapid joint damage and also for early monitoring of the efficacy of
disease-modifying therapies [1.8, 1.10].
Aggrecan can also be used as a biomarker to test the potential of tissue-engineered constructs as cartilage substitutes. Thus, the ability to image aggrecan and assess its structural properties on a molecular scale is an asset to the field of cartilage tissue engineering. Atomic force microscopy (AFM) can be used to obtain such images and assist in our understanding of OA and, ultimately, in developing tissue-engineered cartilage replacement therapy [1.13].
1.3 Cartilage Tissue Engineering
Tissue engineering principles can be applied to develop therapeutic techniques to combat the progression of OA and even to produce cartilage substitutes to replace damaged tissue [1.14, 1.15]. Even though tissue engineering techniques have been used to produce cartilage-like tissues, it is important to ensure that these constructs maintain the same functional properties as native cartilage tissue.
A common cell source used in cartilage tissue engineering is bone marrow stromal cells
(BMSCs), which can easily be cultured and expanded in vitro. These cells include mesenchymal progenitors capable of differentiating into cartilage tissue [1.16]. Cultured cells must be able to produce cartilage through a process called chondrogenesis. In culture, desired cellular differentiation and stimulation of chondrogenesis is achieved by using transforming growth factor
p
(TGFjp) [1.17].One approach to tissue engineering involves inducing previously isolated cells to produce a tissue analog with composition, structure, and function approaching that of native cartilage tissue. Cells are usually encapsulated in three-dimensional matrices such hydrogels that serve as support structures and have been shown to help the cells maintain a chondrocytic phenotype during long-term culture [1.18].
Self-assembling peptide hydrogels, a new class of biomaterials, have shown to have many applications in biotechnology. These materials allow for study and manipulation of cells and may be used as novel scaffolds for tissue engineering and potential drug delivery vehicles [1.19]. Self-assembling peptide hydrogels have been applied in cartilage repair strategies and have been shown to stimulate the production of a mechanically functional
ECM and cell division in constructs using chondrocytes [1.20]. Figure 1.3 shows a cartilage
tissue engineering system where chondrocytes have been cultured in self-assembling peptide hydrogel disks. These successful constructs suggest the potential of peptide hydrogels in culturing BMSCs.
1.4 Atomic Force Microscopy Imaging
As previously mentioned, aggrecan is an important biomarker in cartilage tissue engineering, especially when assessing the viability of constructs as functionally equivalent substitutes for native cartilage tissue [1.22]. Atomic force microscopy (AFM) can be used to obtain nm-scale resolution images of numerous biological macromolecules, including notable ECM constituents, in fluid and ambient conditions [1.23, 1.24].
Direct visualization of aggrecan molecules through AFM imaging has been achieved while noting detailed intramolecular structures and probing mechanical properties [1.13]. Figure 1.2B shows the AFM height image of an individual aggrecan molecule isolated from fetal bovine epiphyseal cartilage where individual GAG chains can be observed and distinct resolution of the N-termianl globular domains from the CS/KS-substituted brush region has been achieved [1.13].
AFM imaging makes determination of the number, spacing, dimensions, and conformation of GAG chains and full-length molecules possible [1.25]. Consequently, the use of AFM imaging techniques to study aggrecan is advantageous both for improving our understanding of GA and for furthering the field of cartilage tissue engineering.
1.5 Thesis Overview
The objective of this thesis is to further the areas of cartilage tissue engineering and the molecular imaging of aggrecan through discovery and optimization studies.
This chapter has provided ample background on osteoarthritis and developing treatments for this degenerative joint disease using tissue engineering. Cartilage, the key molecules in this tissue, and the study of said molecules via AFM imaging have also been discussed. Chapter 2 describes a cartilage tissue engineering experiment using bone marrow stromal cells aimed at finding the optimal agarose hydrogel composition for culturing these cells.
Chapter 3 expands on an atomic force microscopy assay for the study of native cartilage and tissue engineered constructs, including different measures that were taken to find the optimal sample preparation conditions and imaging settings.
Finally, Chapter 4 includes a summary of the main findings and suggestions for further work motivated by this thesis.
1.6 Figures
Early Stages of Disease Degeneration of cartilage Reactive new bone Late Stages of Disease Cartilage particles Loss of cartilage Bone hypertrophyFigure 1.1 Progression of Osteoarthritis in the Knee. The early and late stages of osteoarthritis
are depicted in a knee joint where we can see how articular cartilage is degenerated over time, affecting the adjoining bones in this joint. With generally asymmetric cartilage degradation, the joint becomes malaligned, which in turn causes abnormal joint wear and even reactive bone formations or osteophytes [1.21].
B.
KS CS
C
cp GAG
Figure 1.2 Aggrecan Molecule. (A) Diagram of a single aggrecan molecule indicating the G1, G2,
and G3 domains, keratan sulfate chains (KS), chondroitin sulfate chains (CS), the interglobular domain (IGD), the core protein (cp), glycosaminoglycan chains (GAG), and the N- and C-terminus. (B) AFM height image of an individual aggrecan molecule isolated from fetal bovine epiphyseal cartilage [1.13].
Figure 1.3 Cartilage Tissue Engineering System. Peptide hydrogels were used as scaffolds to
culture chondrocytes. The left panel shows a light microscope image of chondrocytes encapsulated in peptide hydrogel. A chondrocyte-seeded, peptide hydrogel disk, along with its dimensions, can be seen in the panel on the right [1.20].
1.6mm
1.7 References
[1.1] Lawrence RC, Felson DT, Helmick CG, Arnold LM, Choi H, Deyo RA, Gabriel S, Hirsch R, Hochberg MC, Hunder GC, Jordan JM, Katz JN, Kremers HM, Wolfe F, National Arthritis Data Wrokgroup. (2008) Estimates of the prevalence of arthritis and other rheumatic conditions in the United States. Part II. Arthritis & Rheumatism 58(1): 26-35.
[1.2] Felson DT, Lawrence RC, Dieppe PA, Hirsch R, Helmick CG, Jordan JM, Kington RS, Lane NE, Nevitt MC, Zhang Y, Sowers M, McAlindon T, Spector TD, Poole AR, Yanovski SZ, Ateshian G, Sharma L, Buckwalter JA, Brandt KD, Fries JF. (2000) Osteoarthritis: New
Insights; Part 1: The Disease and Its Risk Factors. Annals of Internal Medicine 133: 635-646.
[1.3] Hunter DJ. (2007) In the clinic. Osteoarthritis. Annals of Internal Medicine 147(3):
ITC8-1-ITC8-16.
[1.4] Fautrel B, Hilliquin P, Rozenberg S, Allaert FA, Coste P, Leclerc A, Rossignol M
(2005) Impact of osteoarthritis: results of a nationwide survey of 10,000 patients consulting for OA. Joint Bone Spine 72: 235-240.
[1.5] Berenbaum F. (2008) New horizons and perspectives in the treatment of osteoarthritis. Arthritis Research & Therapy 10(S2): S1.
[1.6] Madry H, Grun UW, Knutsen G. (2011) Cartilage Repair and Joint Preservation: Medical and Surgical Treatment Options. Deutsches Arzteblatt International 108(40):
669-677.
[1.7] Dandy DJ and Edwards DJ. (2009) Esssential Orthopaedics and Trauma. Churchill Livingstone Elsevier. 5: 33-37.
[1.8] Pearle AD, Warren RF, Rodeo SA. (2005) Basic Science of Articular Cartilage and Osteoarthritis. Clin Sports Med 24: 1-12.
[1.9] Strehl R, Tallheden T, Sjugren-Jansson E, Minuth WW, Lindahl A. (2005) Long-term maintenance of human articular cartilage in culture for biomaterial testing. Biomaterials
26: 4540-4549.
[1.10] Goldring MB and Marcu KB. (2009) Cartilage homeostasis in health and rheumatic
diseases. Arthritis Research & Therapy 11(3): 224.
[1.11] Gelse K, Poschl E, Aigner T. (2003) Collagens -structure, function, and biosynthesis.
[1.12] lozzo, RV. (1998) MATRIX PROTEOGLYCANS: From Molecular Design to Cellular Function. Annu Rev Biochem 67: 609-652.
[1.13] Ng L, Grodzinsky AJ, Patwari P, Sandy
J,
Plaas A, Ortiz C. (2003) Individual cartilage aggrecan macromolecules and their constituent glycosaminoglycans visualized via atomic force microscopy. Journal of Structural Biology 143: 242-2 57.[1.14] Danisovic L, Varga I, Zamborsky R, Bohmer D. (2011) The tissue engineering of articular cartilage: cells, scaffolds and stimulating factors. Experimental Biology and Medicine 1-8.
[1.15] Hardingham T, Tew S, Murdoch A. (2002) Tissue engineering: chondrocytes and
cartilage. Arthritis Res 4(3): S63-S68.
[1.16] Pittenger MF, Mackay AM, Beck SC, Jaiswal RK, Douglas R, Mosca JD, Moorman MA,
Simonetti DW, Craig S, Marshak DR. (1999) Multilineage potential of adult human mesenchymal stem cells. Science 284(5411): 143-147.
[1.17] Johnstone B, Hering TM, Caplan Al, Goldberg VM, Yoo JU. (1998) In Vitro Chondrogenesis of Bone Marrow-Derived Mesenchymal Progenitor Cells. Experimental Cell
Research 238: 265-272.
[1.18] DiMicco MA, Kisiday JD, Gong H, Grodzinsky AJ. (2007) Structure of pericellular
matrix around agarose-embedded chondrocytes. Osteoarthritis and Cartilage 15:
1207-1216.
[1.19] Zhang S, Marini DM, Hwang W, Santoso S. (2002) Design of nanostructured biological materials through self-assembly of peptides and proteins. Curr Opin Chem Biol
6(6): 865-871.
[1.20] Kisiday J, Jin M, Kurz B, Hung H, Semino C, Zhang S, Grodzinsky AJ. (2002) Self-assembling peptide hydrogel fosters chondrocyte extracellular matrix production and cell division: Implications for cartilage tissue repair. PNAS 99(15): 9996-10001.
[1.21] American College of Rehumatology. (2009) Osteoarthritis: Progression, Knee.
Rheumatology Image Bank. <http://images.rheumatology.org>
[1.22] Chung C and Burdick JA. (2008) Engineering cartilage tissue. Advanced Drug
Delivery Reviews 60: 243-262.
[1.23] Raspanti M, Congiu T, Guizzardi S. (2001) Tapping-mode atomic force microscopy
[1.24] Sheiko SS. (2000) Imaging of Polymers Using Scanning Force Microscopy: From Superstructures to Individual Molecules. Advances in Polymer Science 151: 61-174.
[1.25] Shao Z, Mou
1,
Czajkowsky DM, YangJ, Yuan JY. (1996) Biological atomic force
microscopy: what is achieved and what is needed. Advances in Physics 45(1): 1-86.Chapter 2: Culture of Bone Marrow Stromal Cells in Agarose
Hydrogels
2.1 Introduction
Tissue engineering principles can be used to develop treatments for osteoarthritis and even to produce replacements for damaged cartilage tissue. The ultimate goal of tissue engineering approaches is to induce previously isolated cells to produce a tissue analog with composition, structure, and function approaching that of native cartilage tissue, which can later be implanted into a joint [2.1, 2.2].
Some of the main factors that must be established when designing a tissue-engineered construct are the type of cells that will be cultured, the type of scaffolds that will serve as their support structures, and the growth factors that will be used to obtain the desired tissue. A common cell source used in cartilage tissue engineering is bone marrow stromal cells (BMSCs), which can easily be cultured and expanded in vitro. These cells include mesenchymal progenitors capable of differentiating into cartilage tissue [2.3, 2.4].
BMSCs can be induced to undergo the desired cellular differentiation using transforming growth factor
P
(TGFp), which serves to stimulate cartilage production throughchondrogenesis [2.5]. Members of the TGF3 superfamily have been found to play roles in chondrocyte growth, differentiation, proliferation, migration, and extracellular matrix synthesis in different cell types, including chondrocytes and chondrogenic progenitor cells
[2.6, 2.7].
Hydrogels composed of biomaterials like alginate, agarose, and self-assembling peptides are commonly used as scaffolds for tissue engineering [2.8, 2.9]. Investigators have found that agarose gels used to culture chondrocytes isolated from bovine, rabbit, and human sources help maintain cell phenotype and promote synthesis of a mechanically functional
ECM with nominal levels of type II collagen and cartilage-specific aggrecan [2.10].
Similarly, self-assembling peptide hydrogels such as KLD and RAD have been applied in cartilage repair strategies and have been shown to stimulate ECM production and cell division in constructs using chondrocytes. This suggests their potential as peptide hydrogels for culturing BMSCs [2.11].
It is known that changes in cell morphology indicate proliferation and the start of chondrogenesis. As seen in Figure 2.1, morphology images of bovine BMSCs encapsulated in hydrogel scaffolds indicate that changes in cell morphology occurred in self-assembling peptide hydrogels (i.e., KLD and RAD) during the first four days of TGFs supplementation but not in 2% agarose hydrogels [2.12].
Given that so far the differences in cell morphology that characterize chondrogenesis have been observed only in peptide hydrogels, it is important to verify if this favorable trend can be achieved using other materials. Agarose is a well studied gel that is more convenient to work with when compared to peptide gels. Studies typically include 2.0% agarose gels but this concentration may not provide the adequate mechanical properties for the optimal culture environment [2.10, 2.12]. What's more, studies using agarose gels in the past have indicated that 1% gels can cause chondrocytes to dedifferentiate while 2% gels are optimal for culture [2.13].
The main objective for this experiment is to verify if the differences in cell morphology that are typical of chondrogenesis and have been observed in peptide hydrogels can be achieved using agarose hydrogels. We also seek to gain a better understanding of the process of chondrogenesis, particularly in its initial stages. As a result, BMSCs will be cultured in agarose hydrogels of different concentrations to identify which scaffold best promotes chondrogenesis.
2.2 Materials and Methods
For this study, BMSCs were isolated from bovine calves and then encapsulated in 0.5%,
1.0%, and 2.0% agarose hydrogels assembled as disks such as those in Figure 1.3. The
BMSC-seeded hydrogels were cultured for 21 days following TGF3 supplementation and several assays were performed to measure key properties and biochemical markers relevant in cartilage tissue engineering.
Isolation and Expansion of BMSCs
BMSCs were isolated from the femoral and tibial diaphyses of a bovine calf. After removing all connective tissue and muscle around each bone, sterilized hand-saw blades were used to bisect the bones at the mid-diaphysis. The exposed bone marrow was extracted from the medullary cavity with forceps and stored in PBS containing 1% PSA (100 U/mL penicillin, 100 pg/mL streptomycin, and 250 ng/mL amphotericin). The bone marrow was mechanically disrupted and the fat content was removed via centrifugation at 1000 g for 15 minutes. The pellet was resuspended in PBS and further homogenized by subsequently passing the material through 16- and 18-gauge needles and a 70 Im cell strainer.
The nucleated cell count was then obtained by diluting a portion of the cell suspension in Ammonium Chloride-Tris Base using the Trypan Blue. After centrifugation at 200 g for 15 minutes, the cell pellet was resuspended in a culture medium that consists BMSC Expansion Medium (low glucose DMEM with 10% ES-FBS, 1% HEPES, and 1% PSA) supplemented with lng/mL bFGF. Approximately 75 x 106 cells were pre-plated and incubated for 30 minutes to allow rapidly-adhering cells to attach. The media and
non-adherent cells were transferred to another T-flask and additional BMSC Expansion Medium
was added for approximately 1x 10⁶ cells/cm2 in 15 mL of media.
After two days in culture, the media was exchanged for fresh BMSC Expansion Medium after and flasks were cultured until cells were nearly 75-80% confluent (Passage 0, PO). The cells that adhered to the T-flask wall were removed with 0.05% trypsin-EDTA, centrifuged at 200 g for 15 minutes, resuspended in PBS, and the nucleated cell count was obtained again via the Trypan Blue exclusion method. Finally, the cells were cryopreserved and frozen in aliquots of 5 million cells/vial using liquid nitrogen.
See Appendix A.1 for more details on this protocol.
Thaw and Expansion of Cryopreserved BMSCs
Cryopreserved cells were rapidly thawed at 37'C and resuspended in high glucose DMEM. Following centrifugation at 200 g for 8 minutes, the cell pellet was resuspended in BMSC Expansion Medium (low glucose DMEM with 10% ES-FBS, 1% HEPES, and 1% PSA) and the cells were counted via the Trypan Blue exclusion method in order to calculate the parameters for seeding the BMSCs into flasks for culture. Cells were cultured in T-flasks at
6000 cells/cm2 in BMSC Expansion Medium with 5 ng/mL FGF at 37'C for three days.
BMSCs were detached from the culture-treated walls of the T-flasks by incubating the flasks with trypsin at 37'C for 4 minutes after having removed the media and washed with PBS. FBS Medium was added to each T-flask to inactivate the trypsin and all flasks were combined after subsequent washing with the new media. The cells were counted via the Trypan Blue exclusion method in order to calculate the parameters for the next passage. BMSCs were cultured in T-flasks at 6000 cells/cm2 in FBS Medium with 5 ng/mL FGF at
37'C for three days in preparation for encapsulation in hydrogels.
See Appendix A.2 for more details on this protocol.
Encapsulation of BMSCs in Agarose Hydrogels for Culture
Custom three-piece casting molds were used to make 2% agarose rings whose hollow centers can be filled with hydrogels as seen in Figure 2.2. Once the acellular agarose rings solidified, the molds were removed and the rings were equilibrated in Casting Medium (high glucose DMEM with 25mM HEPES, 1% ITS+1, 1% NEAA, 1% Na Pyr, 1% PSA, and 0.4% Proline) at 37'C. The 0.5%, 1.0%, and 2.0% agarose solutions for cell encapsulation were prepared by dissolving the stock agarose solution to the desired concentration in sterile 10% sucrose.
Cells were treated with trypsin and inactivated with FBS Medium (low glucose DMEM with 10mM HEPES, 10% ES-FBS, and 1% PSA) for subsequent centrifugation and resuspension
in FBS Medium. Aliquots with 15 x 106 cells in 2 mL sterile tubes were centrifuged at 100 g
for 5 minutes. Meanwhile, the agarose rings were prepared for casting by aspirating the media, leaving the wells completely dry.
The casting portion of this procedure is a two-person job given that it requires optimal timing and speedy work. The team must aspirate the media from the 2 mL tubes and resuspend the cell pellets in 300 ptL of sterile 10% sucrose with 2.5mM HEPES. They must then inject the cell suspension into the desired hydrogel solutions and use a repeater pipette to dispense 50 ptL of the cell-seeded hydrogel suspension into the center of each agarose ring. Finally, each well is covered with Casting Medium, which is then substituted
by Culture Medium supplemented with 1Ong/mL of TGFp. Cells were incubated at 37'C
with media changes every 2-3 days [2.14].
See Appendix A.3 for more details on this protocol. Appendix A.4 contains details for subsequent cell culture media changes and sampling.
Cell Viability and Morphology Assay
The Live/Dead assay was used to obtain a qualitative picture of cell viability and evaluate cell morphology. Sterilized tools were used to remove the exterior agarose rings from desired BSMC-seeded hydrogels and place them in microscope slide wells with PBS 1X. Samples were then dyed with 12.5 ptg/mL of fluorescein diacetate for viewing live cells and
350 ng/mL of ethidium bromide for viewing dead cells. A Nikon Eclipse Fluorescent
Microscope was used to image samples and identify live cells, which appear green in color, and dead cells, which appear red in color.
See Appendix A.5 for more details on this protocol.
Lyophilization and Proteinase K Digestion
Samples were freeze-dried and their final lyophilized weights were obtained. Hydrogel samples were then digested using 0.25 mg/mL Proteinase K so that specific biomolecules can be detected through the GAG Assay, DNA Assay, and Radiolabel Incorporation Assay. See Appendix A.6 for more details on this protocol.
GAG Assay
This assay was used to determine the sulfated glycosaminoglycan (GAG) content in the tissue-engineered constructs. Samples were stained with dymethylmethylene blue (DMMB) dye, which indicates the presence of chondroitin sulfate and keratan sulfate found within GAG chains. A standard concentration curve was prepared using chondroitin-6-sulfate solutions in Tris Buffer. Samples and standards (20 ptL) were distributed along a clear 96-well plate, stained with 200 piL DMMB dye, and readings were obtained at a 520
nm wavelength in the Maxy machine for data processing in terms of GAG concentration (ptg/mL).
See Appendix A.7 for more details on this protocol.
DNA Assay
The DNA Assay uses bisbenzimidazole fluorescent dye Hoechst 33258 to stain DNA present in experimental samples. The interaction of Hoechst 33258 with DNA requires at least four consecutive A-T base pairs, as well as dissociation of DNA from proteins of the nucleoprotein complex. The former is satisfied by random chance, while the latter was accomplished by Proteinase K digestion.
A standard concentration curve was prepared using a 10 pg/mL DNA stock in Tris Buffer.
Samples and standards (20 [tL) were distributed along a black 96-well plate, stained with 200 iiL 0.1 ptg/mL Hoechst 33258 DNA Dye Solution, and readings were obtained in the Victor machine for data processing in terms of DNA concentration ([tg/mL).
See Appendix A.8 for more details on this protocol.
Radiolabel Incorporation Assay
The objective of this assay is to examine cell proliferation and proteoglycan synthesis by radiolabeling samples with 3H-Thymidine and 3 5S-Sulfate, respectively. In order to label the samples, the ITS Medium was supplemented with calculated amounts of the desired isotopes (i.e., 5 pCi/mL 35S and 10 ptCi/mL 3H) while preparing the 35S and 35s3H standards
needed for scintillation counts later on. Each cell-seeded hydrogel sample was cultured with 750 iiL of the radiolabeled media at 37'C for 24 hours to ensure isotope incorporation. Once at the 24-hour point, the radiolabeled media was removed from each well and samples were submitted to four consecutive washes to remove unincorporated isotopes. For each wash, 1mL of Rx Wash was added to all radiolabeled hydrogels within the 24-well plate, which was incubated for 30 minutes in a refrigerator to slow cell metabolism and maintain viability. Washed samples were then transferred to pre-weighed vials after removing the 2% agarose rings surrounding the plugs and the wet weight of each hydrogel was obtained.
A scintillation counter was then used to measure the levels of radioactivity given off by
samples which have been tagged with 3H and
35S. Finally, the levels of protein synthesis
(3H) and proteoglycan synthesis (35S) were calculated from the readings for the
corresponding isotopes, converted to concentrations (nmol), and normalized by DNA content and gel weight (nmol/pg/mL/mg).
2.3 Results and Discussion
Various assays were performed on the tissue-engineered constructs throughout the 21-day culture to measure several properties of interest such as cell viability and morphology, GAG content, DNA levels, gel contraction, cell proliferation, and proteoglycan synthesis.
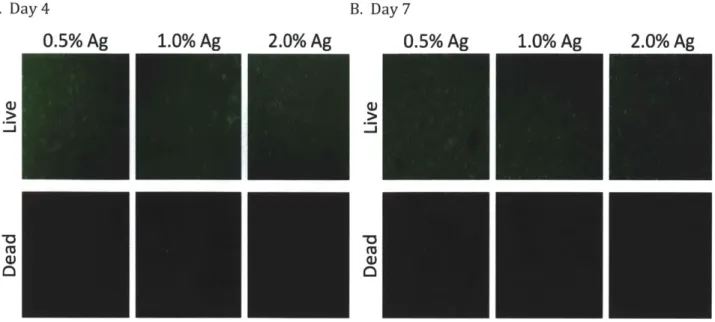
Cell Viability and Morphology Assay
The Live/Dead Assay was used to assess the viability and get an idea on the morphology of cultured cells. A visual comparison of the live and dead cells, illustrated in Figure 2.3, indicates that viability was excellent and therefore not a cause for concern in proceeding with experiments and analyzing results. More importantly, it is evident that the BMSCs retained a spherical morphology in all agarose hydrogels both at Day 4 and Day 7 of culture. The fact that the cells did not exhibit changes in morphology like those observed in Figure 2.1 suggests that though agarose hydrogels with concentrations below 2.0% might provide a microenvironment more mechanically similar to in vivo surroundings, they are not suitable for promoting chondrogenesis. This conclusion points to the use of self-assembling peptide hydrogels as a superior scaffold for cartilage tissue engineering.
GAG Assay
Figure 2.4 shows how this assay was used in determining the GAG content in the cultured chondrocytes at Days 0, 4, 7, and 21. For the most part, GAG concentrations gradually increased over time. However, the 0.5% agarose hydrogels are significantly lower. The overall levels of GAG concentration are low compared to the usual 50-100 ptg/mL for agarose observed in similar samples at our lab. They are not very high when compared to Day 0 levels either. Importantly, the BMSCs cultured in 0.5% agarose hydrogels don't seem to produce GAG. This suggests that scaffolds made with 0.5% or less agarose are not fit for the development of chondrocytes or differentiated BMSCs. A lingering question is whether
GAG is being lost to the media and if this effect could be due in part to the observed gel
contraction. Though the media was saved during the course of this experiment, analyses could not be performed due to logistical difficulties in sample storage. The saved media samples are no longer available.
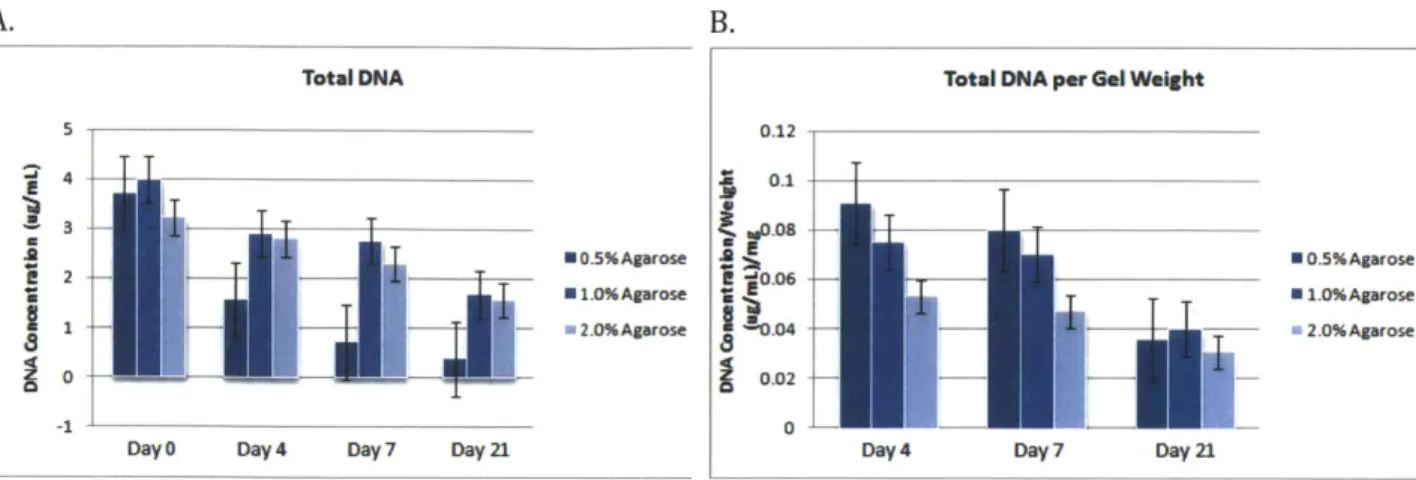
DNA Assay and Gel Contraction
Figure 2.5 shows the DNA concentration for the cell-seeded hydrogel samples at key time points throughout the experiment. It is apparent that DNA levels decreased by Day 21, which is expected as the culture period progresses. Levels are comparable to those obtained in previous experiments at our lab where samples contained 2-4 ptg/mL DNA. As seen in Figure 2.5B, normalizing by DNA content shows higher amounts in the 0.5% and
Figure 2.6 depicts the weights of the gels and how they change over time. Gel weights and experimental observations show that 0.5% agarose gels contracted significantly more than
1.0% and 2.0% gels.
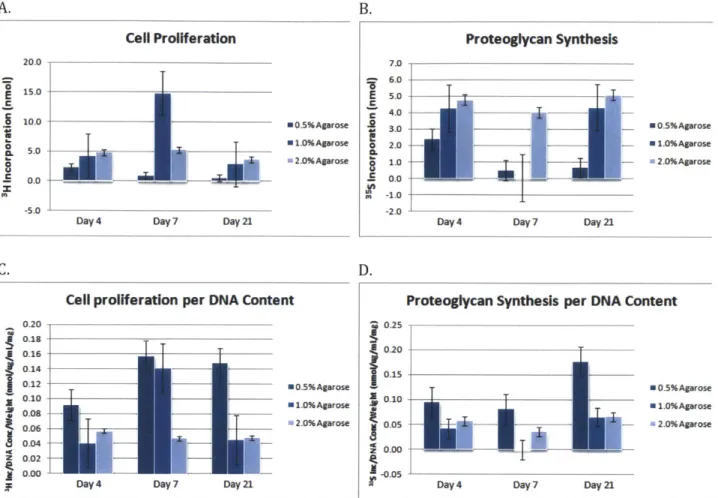
Radiolabel Incorporation Assay
In this assay, 3H-Thymidine was used as an indicator for cell proliferation while 35S-Sulfate was used to evaluate proteoglycan synthesis. As seen in Figure 2.7A and Figure 2.7C, cell proliferation seems to remain stable with the exception of 1.0% agarose gels at Day 7. This is still within the margin of error indicated by the error bars in the figure. It is clear that cells exhibit lower proliferation in 0.5% agarose gels.
Figure 2.7B and Figure 2.7D show proteoglycan synthesis through 35S incorporation. It is
apparent that proteoglycan synthesis is much lower for 0.5% agarose gels and slightly lower for 1.0% gels. Overall synthesis remains fairly stable. However, the 1.0% agarose gel at Day 7 seems to exhibit low or no proteoglycan synthesis. Since there is no reason to expect these results, it may be possible that this is due to an unforeseen experimental
error.
2.4 Conclusions
The goal of this study was to determine if agarose hydrogel scaffolds could be used to
promote chondrogenesis in TGFI-supplemented BMSCs to the same extent as peptide hydrogel scaffolds have done so in the past. The latter have been used in experiments where the differences in cell morphology that are typical in chondrogenesis were observed and cells were able to maintain nominal levels of biochemical markers relevant in cartilage tissue engineering.
For our experiment, BMSCs were isolated from bovine calves, encapsulated in 0.5%, 1.0%, and 2.0% agarose hydrogel disks, and cultured for 21 days after TGFp supplementation. It was evident that cells in all agarose hydrogel scaffolds did not undergo changes in morphology like those observed in peptide hydrogel scaffolds. What's more, all the agarose gels contracted over time, particularly the low-concentration 0.5% gels.
As for assays examining biochemical markers, overall results indicate that the 0.5% agarose hydrogels are clearly inferior when compared to the 1.0% and 2.0% agarose hydrogels, which are generally comparable. It was clear that though GAG concentrations gradually increased over time, cells in 0.5% agarose hydrogels had significantly lower GAG levels and did not even seem to produce GAG. DNA levels decreased as time progressed
during the 21-day culture period. For the most part, cell proliferation and proteoglycan
notably lower. As a result, this experiment proves that scaffolds made with 0.5% or less agarose are not fit for the development of chondrocytes or differentiated BMSCs.
In order to gain a better understanding of the initial stages of chondrogenesis, future assays should include morphology imaging targeting actin networks and cell nuclei. This would be helpful in seeing the changes that BMSCs undergo on a deeper level. Western Blots and RT-PCR could also be used to verify the expression of genes characteristic of chondrocytes (e.g., collagen II). Performing the GAG Assay for media samples to examine GAG lost to the media would provide further insight into the BMSC culture process.
The overarching conclusion from this study is that agarose hydrogels, even those with concentrations below the customary 2.0% and thus more mechanically similar to in vivo cell surroundings, are not suitable for promoting chondrogenesis and cell proliferation. This suggests that self-assembling peptide hydrogels are indeed a superior scaffold for cartilage tissue engineering and should be used in future studies.
Agarose RAD16-1 KLD12
Scale Bar = 50pm, Red = F-actin, Blue = DAPI (nuclei)
Figure 2.1 Morphology Images for Bovine BMSCs Encapsulated in Self-Assembling Peptide Hydrogel Scaffolds. Cells in different hydrogel scaffolds (i.e., agarose, RAD16-I, KLD12) were stained such that F-actin can be seen in red and the nuclei can be observed in blue. (A) Cells retain spherical morphology in all hydrogels at Day 0 after TGF@ supplementation. (B) Changes in cell morphology, which indicate proliferation and the start of chondrogenesis, occurred in self-assembling peptide hydrogels during the first four days of culture after TGFs supplementation but not in 2% agarose [2.12].
Cell-seeded
Hydrogel
(50pL)
Acellular
Agarose Mold
Figure 2.2 Cell Encapsulation in Hydrogels within Agarose Rings. Schematic of the agarose ring
molds surrounding cell-seeded hydrogel disks, including the dimensions of each component. [2.12]
1.6m
2.5 FiguresA. Day4 0.5% Ag CU 1.0% Ag 2.0% Ag B. Day7 0.5% Ag -J -0
Figure 2.3 Cell Viability and Morphology for BMSC's Seeded in Agarose Hydrogels. Cells in 0.5%, 1.0%, and 2.0% agarose hydrogels were stained such that live cells appear green and dead cells
appear red. Cells are viable both at Day 4 (A) and Day 7 (B) of culture. Their morphology remains spherical and changes such as those observed in self-asembling peptide hydrogels are not apparent.
Figure 2.4 GAG Assay. The total GAG concentration ([tg/mL) in the BMSC-seeded agarose hydrogels
of different concentrations can be seen over the 21-day culture period. Though GAG concentrations generally increase over time, it is evident that the 0.5% agarose gels have significantly lower GAG.
2.0% Ag Total GAG 14 12 E 10T 8 - M0.5%Agarose 6 - - 1.i%Agarose 4 --- --- - a2.0%Agarose S2 0
A. B.
Total DNA Total DNA per Ge1 Weight
5 0.12 4 0.1 3 - .08 2 *0.5%Agarose 0 -0.5%Agarose E 2 P -'0.06h-* 1.0%Agarose Z 1.0%Agarose 1 - 2.0%Agarose
104
2.0%Agarose 0 -- O--- 0.02 -1 0 - -- ---Day 0 Day 4 Day 7 Day 2 Day 4 Day 7 Day 21
Figure 2.5 DNA Assay. (A) The total DNA concentration (ptg/mL) in the BMSC-seeded agarose hydrogels of different concentrations can be seen over the 21-day culture period. (B) The DNA
concentrations have been normalized by gel weight.
BMSC-Seeded Gel Weights
60.00 ' 50.00 40.00 -30.00 ---- -- 0 %Agarose 0 1.0% Agarose 2 0.00 _ 2 E 2.0%Agarose 4 10.00 0.00
Day 4 Day 7 Day 2
Figure 2.6 BMSC-Seeded Gel Weights. The average weight of the BMSC-seeded agarose gels can be seen over the 21-day culture period. Though 1.0% and 2.0% agarose gels remained fairly constant in weight, it is evident that 0.5% agarose gels contracted over time.
A. Cell Proliferation 20.0 15.0 5 10.0 - 0.5%Agarose 5 T N 1.0%Agarose CL 5.0 2.0%Agarose 0.0 _---_ -- ---5.0
Day 4 Day 7 Day 21
C.
Cell proliferation per DNA Content
0.20 0.18 0.16 0.14 0.12 0.5%Agarose 0.10 E 1.0%Agarose 0.08 0 .0 8 - - 2 .0% A garo se
A
004-0.02 0.00
--ZDay 4 Day 7 Day 21
B. Proteoglycan Synthesis E .2 7.0 6.0 5.0 4.0 3.0 2.0 1.0 0.0 -1.0 -2.0 U 0.5%Agarose m 1.0%Agarose a 2.0%Agarose
Day 4 Day 7 Day 21
D.
Proteoglycan Synthesis per DNA Content ' 0.25 ( 0.20 010 0.15 -00.5%Agarose 0.10 0 1.0%Agarose 0.05 - 2.0%Agarose Z 0.00 - ----D-0.05
;rDay 4 Day 7 Day 21
Figure 2.7 Radiolabel Incorporation Assay. (A) Cell proliferation is indicated by the level of 3H
incorporation. (B) Proteoglycan synthesis is indicated by the level of 35
S incorporation. (C) Cell
proliferation normalized by DNA content and gel weight. (D) Proteoglycan synthesis normalized by
2.7 References
[2.1] DiMicco MA, Kisiday JD, Gong H, Grodzinsky AJ. (2007) Structure of pericellular matrix around agarose-embedded chondrocytes. Osteoarthritis and Cartilage 15:
1207-1216.
[2.2] Hardingham T, Tew S, Murdoch A. (2002) Tissue engineering: chondrocytes and
cartilage. Arthritis Res 4(3): S63-S68.
[2.3] Knippenberg M, Helder MN, Zandieh Doulabi B, Wuisman PI, Klein-Nulend
J.
(2006)Osteogenesis versus chondrogenesis by BMP-2 and BMP-7 in adipose stem cells. Biochem
Biophys Res Commun 342(3): 902-908.
[2.4] Mackay AM, Beck SC, Murphy JM, Barry FP, Chichester CO, Pittenger MF. (1998) Chondrogenic differentiation of cultured human mesenchymal stem cells from marrow.
Tissue Engineering 4(4): 415- 428.
[2.5] Roelen BA, Dijke P. (2003) Controlling mesenchymal stem cell differentiation by TGFBeta family members.
J
Orthop Sci 8: 740 -748.[2.6] Frenkel SR, Saadeh PB, Mehrara BJ, Chin GS, Steinbrech DS, Brent B, Gittes GK, Longaker MT. (2000) Transforming growth factor beta superfamily members: Role in cartilage modeling. Plast Reconstr Surg 105: 980 -990.
[2.7] Grimaud E, Heymann D, Redini F. (2002) Recent advances in TGF-beta effects on chondrocyte metabolism: Potential therapeutic roles of TGF-beta in cartilage disorders.
Cytokine Growth Factor Rev 13: 241-257.
[2.8] Hsuselmann HJ, Aydelotte MB, Schumacher BL, Kuettner KE, Gitelis SH, Thonar EJ.
(1992) Synthesis and turnover of proteoglycans by human and bovine adult articular
chondrocytes cultured in alginate beads. Matrix 12(2): 116-129.
[2.9] Zhang S, Marini DM, Hwang W, Santoso S. (2002) Design of nanostructured biological materials through self-assembly of peptides and proteins. Curr Opin Chem Biol
6(6): 865-871.
[2.10] Buschmann MD, Gluzband YA, Grodzinsky AJ, Kimura JH, Hunziker EB. (1992) Chondrocytes in Agarose Culture Synthesize a Mechanically Functional Extracellular
Matrix. J Orthop Res 10: 745-758.
[2.11] Kisiday JD, Jin M, Kurz B, Hung H, Semino C, Zhang S, Grodzinsky AJ. (2002) Self-assembling peptide hydrogel fosters chondrocyte extracellular matrix production and cell division: Implications for cartilage tissue repair. PNAS 99(15): 9996-10001.
[2.12] Kopesky PW, Vanderploeg EJ, Sandy JS, Kurz B, Grodzinsky AJ. (2009) Self-Assembling Peptide Hydrogels Modulate In Vitro Chondrogenesis of Bovine Bone Marrow Stromal Cells. Tissue Engineering Part A 16(2): 465-477.
[2.13] Benya PD, Shaffer JD. (1982) Dedifferentiated Chondrocytes Reexpress the Differentiated Collagen Phenotype when Cultured in Agarose Gels. Cell 30: 215-224.
[2.14] Mouw JK, Connelly JT, Wilson CG, Michael KE, Levenston ME. (2007) Dynamic Compression Regulates the Expression and Synthesis of Chondrocyte-Specific Matrix Molecules in Bone Marrow Stromal Cells. Stem Cells 25: 655-663.
Chapter 3: Atomic Force Microscopy Imaging Assay for Cartilage
Tissue Engineering
3.1 Introduction
Tissue engineering principles can be applied to develop treatments for OA and even to produce replacements for damaged cartilage tissue. Even though tissue engineering techniques have been used to produce cartilage-like tissues, the challenge of creating constructs with biochemical, structural, and biomechanical properties that maintain the same function as in vivo cartilage still remains [3.1, 3.2].
As one of the prevalent macromolecules in the cartilage ECM [3.3], aggrecan is an important indicator when testing the potential of tissue-engineered constructs as cartilage substitutes [3.4]. Its expression, synthesis, organization, and turnover are often used as biomarkers of the chondrogenic potential of BMSCs [3.5, 3.6].
The overall composition of aggrecan can be assessed through biochemical [3.7], chromatographic [3.8], and electrophoretic techniques [3.9], while biophysical methods such as electron microscopy (EM) imaging can be used to observe details such as the thick CS-brush region in aggrecan molecules. Still, images obtained through these methods do not allow for a look at the fine details of molecular heterogeneity, conformation, and structure at the level of individual aggrecan molecules [3.10, 3.11, 3.12].
The recent development of high-resolution atomic force microscopy (AFM) imaging techniques allows for a direct visualization of detailed intramolecular structures and probing of nanoscale mechanical properties of various ECM constituents, particularly aggrecan [3.13, 3.14]. AFM imaging provides a better understanding of the molecule-to-molecule variability of aggrecan, making determination of the number, spacing, dimensions, and conformation of GAG chains and full-length molecules possible [3.15]. Thus, the ability to image aggrecan and assess its structural properties on a molecular scale is an asset to the field of cartilage tissue engineering.
Atomic force microscopy (AFM) can be used to gain further insights into key components of the ECM and assist in our understanding of OA and, ultimately, in developing tissue-engineered cartilage replacement therapy [3.13, 3.15]. As seen in Figure 3.1A, aggrecan molecules are immobilized on the APTES-mica substrate and imaged by a sharp silicon probe tip. Figure 3.1B shows an example of resulting images, in this case of newborn human aggrecan, where AFM allows for the distinct resolution of the G1 domain and the individual GAG chains.
The main objective for this experiment is to learn about the theoretical and practical aspects of atomic force microscopy while imaging aggrecan molecules. The sample
preparation conditions needed to immobilize aggrecan on the mica surface for subsequent imaging will be optimized. In addition, the range of instrument and software parameters relevant to tapping mode AFM for imaging aggrecan molecules will be explored. This will help in establishing a protocol for AFM imaging and image processing relevant to the selected molecules.
3.2 Materials and Methods
For this study, fetal bovine epiphyseal aggrecan samples were used to optimize sample preparation and imaging parameters with the goal of establishing a more thorough AFM imaging protocol.
Sample Acquisition
Purified samples of aggrecan molecules isolated from the epiphyseal region of fetal bovine femora, tibiae, and fibulae were acquired for this study. Fetal bovine cartilage was obtained from the epiphyseal growth plate region, processed, and stored as described previously [3.11, 3.16]. Purified aggrecan fractions (AlAlD1D1) were dialyzed consecutively against 500 volumes of 1M NaCl and deionized water to remove excess salts
[3.13]. The GAG Assay was used to determine the concentration of aggrecan in purified
samples as described in the preceding chapter and detailed in Appendix A.7.
Sample Preparation
Aggrecan molecules must be immobilized on the mica surface for subsequent AFM imaging. In order to achieve this, the surface was coated 0.01% v/v 3-aminopropyltriethoxysilane
(APTES) for an incubation time of 30 minutes at room temperature. APTES is an
immobilizing agent with a net positive charge to bind the aggrecan molecules [3.13].
The prepared APTES-mica surface was then incubated with the desired aggrecan solution at concentrations ranging from 50-to-500 pg/mL for an incubation time of 20 to 60 minutes. The excess aggrecan solution was rinsed off with 200 p.L of purified water and the APTES-mica surface was dried overnight, resulting in an aggrecan monolayer.
See Appendix A.11 for more details on this protocol [3.13, 3.15].
AFM Imaging
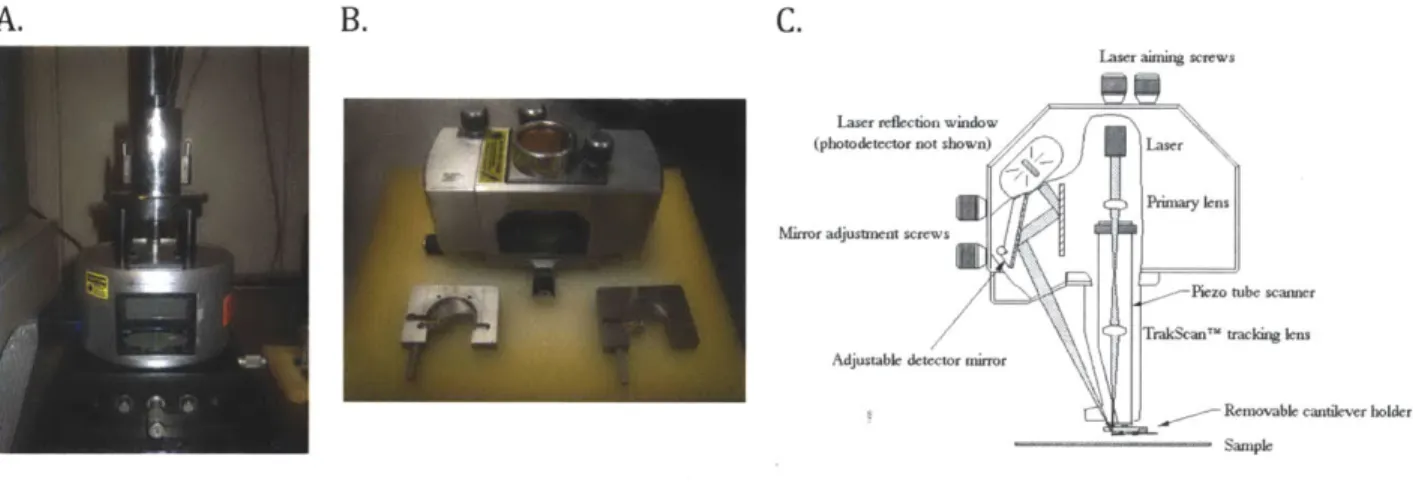
The APTES-mica surfaces with aggrecan monolayer samples were then taken for AFM imaging using a NanoScope IlIa Multimode AFM. Sample surfaces were glued to the magnet with custom adhesive tabs while using tweezers to handle the samples and avoid contamination. Each containing a specific APTES-mica surface with an aggrecan monolayer sample, the magnets were placed on top of the microscope's piezo tube for imaging. The
key components of said microscope, as well as the manufacturer's schematic of the inner workings of the microscope head and cantilever holder, can be observed in Figure 3.2.
A Super Sharp Silicon AFM tip with 4 [im thickness was used to probe the sample surface
through tapping mode AFM. Great care was taken to align the laser for optimum signal and select the parameters for the software's feedback loop. These include the integral and proportional gains, which are values ranging from 0 to 1 used to maintain constant amplitude for tapping mode. Once the laser is manually aligned and initial parameters are set up for imaging, the NanoScope Ila Multimode AFM is placed in a platform and suspended in midair using a tripod and elastic cables in order to reduce ambient vibrations and therefore minimize noise during image capture.
See Appendix A.11 for more details on this protocol [3.13, 3.15].
Image Processing
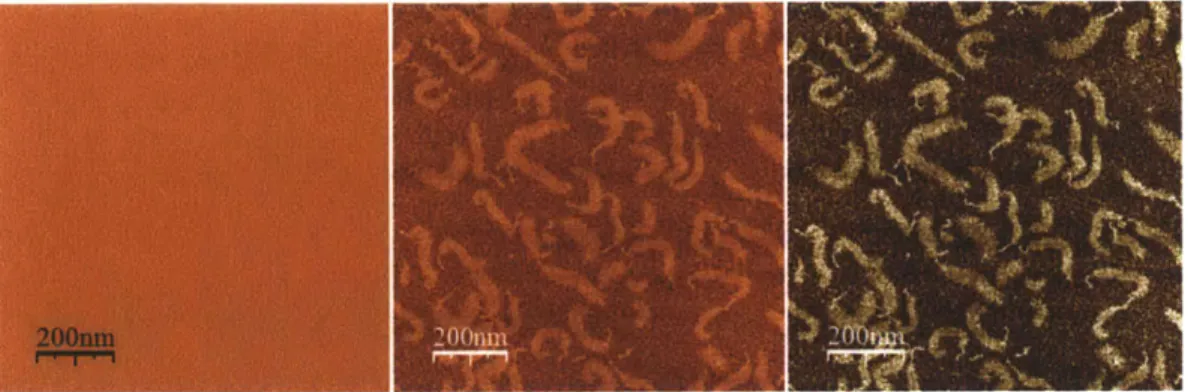
The established heuristic for image processing requires the NanoScope 5.31r1 and the WSxM 4.0 Develop 10.1 software packages. The former was used to select the scan area, resolution, and flatten the image for a more accurate depiction of the aggrecan molecule height. The latter was used to adjust the color palette and equalize the image, allowing for better contour definition of the image molecules. Figure 3.3 shows three consecutive stages of image processing for a sample of fetal bovine epiphyseal aggrecan at a concentration of 50 pg/mL can be seen in three consecutive stages of image processing. See Appendix A.11 for more details on this protocol.
3.3 Results and Discussion
A number of tests were conducted using fetal bovine epiphyseal aggrecan samples to
optimize the sample preparation process for use with minimal sample volumes. The AFM imaging technique was optimized in terms of the integral and proportional gains, as well as the image resolution.
Sample Preparation: Test of Established Conditions
The recommended sample preparation conditions for aggrecan AFM imaging are 250 ptg/mL of aggrecan incubated for 40 minutes. Given the need to minimize the aggrecan concentration needed to obtain quality images, the goal of this test was to test the range of the established sample preparation conditions using fetal bovine epiphyseal aggrecan. Samples were prepared with 200 and 250 ptg/mL aggrecan and incubated for both 20 and 40 min. As seen in Figure 3.4, aggrecan molecules can be successfully visualized at both 200 and 250 pg/mL concentrations. Incubating the sample solutions for longer periods of time allows for more aggrecan molecules to attach to the APTES-mica surface, which is