HAL Id: halshs-00325019
https://halshs.archives-ouvertes.fr/halshs-00325019
Submitted on 25 Sep 2008HAL is a multi-disciplinary open access
archive for the deposit and dissemination of sci-entific research documents, whether they are pub-lished or not. The documents may come from teaching and research institutions in France or abroad, or from public or private research centers.
L’archive ouverte pluridisciplinaire HAL, est destinée au dépôt et à la diffusion de documents scientifiques de niveau recherche, publiés ou non, émanant des établissements d’enseignement et de recherche français ou étrangers, des laboratoires publics ou privés.
Liberalization and globalization: Trojan Horse for the
cotton traders’ domination in Francophone Africa
Michel Fok
To cite this version:
Michel Fok. Liberalization and globalization: Trojan Horse for the cotton traders’ domination in Francophone Africa. International Association of Agricultural Economists Conference, Aug 2006, Gold Coast, Australia. �halshs-00325019�
Liberalization and globalization:
Trojan Horse for the cotton traders' domination in Francophone Africa
1. Introduction
In September 2003, at the WTO Ministerial Meeting in Cancùn, four of the Francophone African Countries (FACs) attracted the international attention by demanding the end of the cotton subsidies. For the first time, the FACs exposed very officially how cotton production was socially and economically important in countries which jointly rank second at the exportation of cotton lint.
The "July Package" lets little hope that the FACs' claim for total subsidy abolition will be met. The African initiative is also debatable in its exclusive focus on national support policies since it is missing the effect of market structure on price formation. The exacerbated phenomenon of concentration and integration, in the areas of trade and processing of agricultural commodities remains overlooked as well as the price capture by the resulting oligopolies (Heffernan, 1999, Murphy, 2002, Scoppola, 1995, Wise, 2004).
In this communication, we contend that the FACs are now submitted to the cotton trading oligopoly as the result of the liberalization process advocated to further adapt to globalization. The first part emphasizes the phenomenon of concentration/integration and its effects on price formation. How it is materialized in the cotton case will be discussed. The second part informs on how cotton transactions run and how the FACs were sheltered from the Cotton Trade Muntinational Companies (MNCs). The third part deals with the relationship between the liberalization process and the current MNCs' domination.
2. Exacerbated phenomenon of concentration/integration in the commodity trade
For all agricultural commodities, no increase of commodity prices resulted after the Uruguay Round. In the cotton case, price declining trend is clear, as well as the accentuated volatility during the last three decades ( Figure 1). For a few analysts, the influence of the market structure is clear (Murphy, 1999).
Figure 1. Volatility and recent downward trend of the world cotton price (current US cents/lb) 0,00 20,00 40,00 60,00 80,00 100,00 120,00 17901796180 2 18081814182 0 18261832183 8 1844185018561862186 8 18741880188 6 18921898190 4 1910191619221928193 4 19401946195 2 19581964197 0 19761982198819942000 2001 1985 1994 1980 1919 1942 1951 1863 1931
2.1. General trend of exacerbated market concentration
The reality of oligopoly control of the commodity trade was yet observed during the negotiation process of the Uruguay Round. In Europe, the trade of coarse grains at international level was controlled by three main firms (Scoppola, 1995). These firms are MNCs: e.g. Cargill operates in 70 countries. In the USA, in 2002, three firms (Cargill, ADM and Zen-Noh) controlled respectively 82% and 65% of the US corn and soy exportations. These figures far exceed the threshold of CR4 > 40% (concentration ratio obtained by the four first firms) at which market competition is doubtful (Heffernan and Hendrickson, 2002, Trade and Development Board, 1999).
The concentration process takes place along with integration, commodity diversification and international expansion (Murphy, 2002). Integration is both upstream and downstream since commodity trading MNCs provide production inputs and they process commodities into semi-final or semi-final foods. In the USA, in addition to grain trade, Cargill belongs to the top four firms producing animal feed, processing meat and dealing with handling and storage operations needed at exportation. Diversification leads the trading companies to deal with
commodities beyond the ones they traditionally addressed. Cargill became for instance a big cotton trade player within one decade. Concentration and diversification go along with international expansion. The leading companies in the soy trade or processing are more or less the same in USA, Brazil and Argentina.
2.2. Market concentration and price capture
The farm to wholesale price spread is an indication of the price capture: it is observed that, in the USA, the more concentration is, the higher is the price spread (Murphy, 2002). The declining price paid to cocoa and coffee producers is explained by the governance power of the downstream players (Kaplinsky, 2004). The process of "Inversed auctions" operated by Nestlé (Boris, 2005) points out the processor's power in imposing price upon traders who in return pass lower price to coffee producers.
The power on price formation expresses itself through various ways. In the coffee case, physical transactions only account for 10% of total transactions (Kaplinsky, 2004)). Hence, speculation to which traders are deeply involved should account far more in price formation. Price capture could be suspected as responsible of the partial conversion of support money into farmers' income (Murphy, 2002): support payments are used as an excuse not to pay more to farmers (Murphy, 1999). The relationship between national support policies and trading MNCs is furthermore ambiguous when one considers that the trading MNCs were promoted by support measures like export programs, export guarantees and export credit (Scoppola, 1995). The Step 2 of the US support program has been typically profitable to cotton traders. Trading MNCs have now become so much powerful that phasing out support measures would not mitigate their market power
2.3. Cotton trade concentration and its effect on price
By updating the number of companies involved in the cotton trade worldwide, the International Cotton Advisory Committee (ICAC) inclines to believe that market competition prevails with around eighty companies it records (ICAC, 2005). This position is debatable since there are only a dozen of companies really involved in international trading business
( Table 1). These firms are MNCs which are mainly US or Europe-based MNCs. Table 1. International cotton trading oligopoly
Origin 1994 2004
Allenberg cotton co. Allenberg cotton co. Conticotton
Dunavant Enterprises Inc. Dunavant Enterprises Inc. Hohenberg Bros. Cny
ECOM USA Inc. Cargill Cotton
Weil Brothers & Rountree
L. Dreyfus Cotton international (B) L. Dreyfus Cotton international (B)
Copaco (Fr) Copaco (Fr)
Paul Reinhard AG (Sz) Paul Reinhard AG (Sz) Stahel Hardmeyer AG (Sz)
Ralli Brothers & Coney (UK)
Aiglon Dublin Ltd (Sz) Plexus
Toyo Cotton (Jp)
Queensland cotton Corp. (Aus) USA
Europe
Asia & Pacific
Source : From ICAC data in 1994 & 2004
This oligopolistic situation impacts on the connection of prices quoted at various cotton markets or stock exchanges (Baffes and Ajwad, 2001). The influence of the trading MNCs on the world price is further clearer through the analysis of this price reference: the A Index set up and published daily by Cotlook, a private firm based in Liverpool. This index has achieved an international status: it is the reference in the negotiation of transaction contracts, in the price setting in countries where price remains centrally administered and in cotton policy implementation like in the USA.
A index is calculated from a basket of a limited number of cotton origins (or cotton "growths") with a specific appearance grade ("Middling") and a lint length (1inch 3/32). The basket today is composed of 19 cotton growths. The A index is the mean value of the quotations of the five cotton "growths" which are least priced. For more than fifteen years, the cotton growth coming from the FACs (denominated "West African cotton") has been regularly retained in the A Index calculation.
A Index construction is not based on real transactions but declarations of intentions provided through telephone calls or faxes. In reality, only traders declare selling intentions. Even
nominal quotations are taken into account. It comes out that A Index is totally a virtual one, managed with not any transparency by a British private firm, and more importantly, which is sensitive to manipulations1.
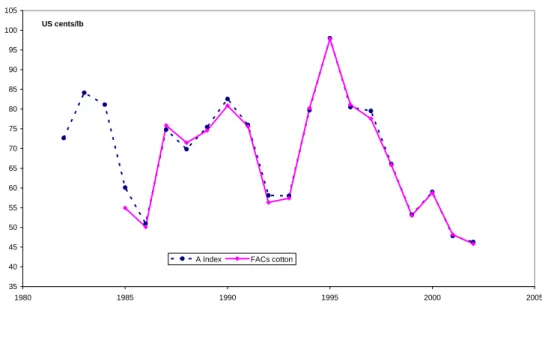
Additional observation confirms that A Index should suffer some manipulation, in particular at the expense of the FACs. The quality of the cotton of these countries is generally acknowledged to be good. This is why quality-demanding countries (EU, Japan, Taiwan) account for 25-40% of the outlets of the FACs' cotton these recent years (Fok and Bachelier, 2004). The FACs produce a great share of lint length longer that the one required for the A Index cotton ( Table 2). There is not so much of the West African cotton which might correspond to the A Index type. Nevertheless, the West African cotton comes out to be the cotton growth the most regularly quoted, every of the quotation days in Liverpool, to the extent that A Index curve is totally confused with the one for the West African cotton ( Figure 2). This is a paradox which sustains that A Index should be polluted by false declarations. Figure 2. Confusion of A Index and price for the FACs' cotton
No market premium for the FACs cotton
35 40 45 50 55 60 65 70 75 80 85 90 95 100 105 1980 1985 1990 1995 2000 2005
A Index FACs cotton
US cents/lb
1
An African commercial director observed that A Index had several times plunged severely without reason, just before a big trader proposed him a contract for a great amount of cotton.
Table 2. Quality distribution of the cotton lint production in West Africa countries
5 countries The best one 5 countries The best one
1995 38% 21% 1996 37% 22% 1997 44% 30% 63% 49% 1998 31% 44% 56% 36% 1999 26% 53% 62% 39% 2000 24% 42% 76% 67% 2001 19% 57% 70% 59% 2002 23% 45% 75% 70%
Share of lint length > 1"3/32 Grade > Middling
Source : Fok & Bachelier, 2004
3. FACs' isolation from the cotton trade oligopoly prior to liberalization
3.1. Private regulations of cotton trade
All cotton transactions refer to specific sets of rules and bylaws defended by cotton professional associations. These rules are the basis for dealing with any conflict in the contract implementation and can be called Private Regulation Systems (PRSs). Various PRSs wear the names of the towns where they originated (Liverpool, Le Havre, New York, Memphis, Bremen…) in the second half of 19th century. The rules of Liverpool Cotton Association (LCA, which became International Cotton Association or ICA in 2004) serve for at least 60% of the international cotton transactions. The FACs refer exclusively to the Réglements Généraux du Havre (RHG).
The PRSs are basically sets of general conditions of cotton transaction contract. They specify quality criteria that can be contracted and the penalties that must apply in case the quality supplied is below the level agreed upon. The real agreement signed by contracting parties corresponds to specific conditions (i.e. quantities, quality criteria, price, date of delivery…) which are mentioned in less than two pages. The concepts of transaction costs and game theory can help understand why PRSs' rules are efficient (Bernstein, 2001, Fok, 2004).
It is worth emphasizing that PRSs rules deal explicitly with contradictory control modalities at delivery (in terms of quantities and quality). They acknowledge the natural feature of cotton, with some degree of heterogeneity, through the notions of franchise and tolerance threshold which mean that some part of the contracted amount can be provided below the agreed quality (AFCOT, 1994).
3.2. Organization of the cotton sales prior to liberalization
In all FACs, state control applied to cotton production and commercialization prior to the liberalization process in the first half of 1990s. From mid-1970s, a joint-venture company enjoyed national monopoly right in managing cotton production, i.e. supplying inputs and technical assistance to farmers, buying farmers' productions, ginning seedcotton. Except in Benin, the capital of the cotton company is shared between the African State and a French company with a minority share (Développement des Agro-Industries du Sud or DAGRIS, formerly Compagnie Française de Développement des Textiles or CFDT). Till mid-1980s, in most of the FACs, the exportation of all agricultural commodities (including cotton) was managed by a public organism distinct from the cotton company. After the first world cotton crisis in 1985, all cotton companies in the FACs got the responsibility of exporting its own cotton.
Cotton was sold through a selling commissioner, COPACO, the same for all FACs. COPACO is totally owned by DAGRIS since the end of 1980s, but its dates back to 1863. In the opposite of a trader, a commissioner never takes possession of the cotton. He only plays an intermediation role and gets a commission based on the contract value. Intermediation also encompasses representing the mandatory in case of conflicts with buyers. A commissioner is basically accountable to his mandatory in terms of selling all cotton available, at acceptable price, and of guarantying the final payment. In the context of the 1960s to 1970s, the completion of these tasks did matter. Through this commissioning scheme, all clients were final users of cotton lint, namely spinners, located in various countries in the world. All sales were at CIF position, with high organization requirements for proper shipping.
Clearly, till the beginning of 1990s, most of the FACs had no relation with international traders. The option of selling through commissioner sheltered these countries from the cotton trading MNCs. Of course, since COPACO and CFDT are both French companies and which eventually became connected, risk of collusion may be questioned and actually might have been questioned. For the purpose of this paper, it suffices to note that there was no
downstream integration since COPACO intermediated and did not take ownership of the African cotton.
4. Questionable globalization-assisted expansion of the cotton trading MNCs in the FACs
The implementation of the liberalization process of the FACs' cotton sectors enables the MNCs to enter a sheltered market and to become dominant within less than one decade.
4.1. Trade liberalization: a concession gesture within a harsh debate
The liberalization of the cotton sectors started in Anglophone Africa by mid-1980 and raised no debate (Fok, 2001). The situation was quite different in the FACs because production kept on growing when the liberalization was put on the agenda at the aftermath of the second world cotton crisis in 1991. It was argued that liberalization would enable cotton sectors to better adapt to world market fluctuations to the benefit of farmers (Banque mondiale, 1998, Varangis, et al., 1995). Intervention of MNCs in the liberalization was regarded positively (Pursell and Diop, 1998).
Harsh and passionate debate resulted (Véron, 1998) conducted by CFDT (CFDT, 1998, Fichet, 1996). Some observers saw an opposition between the World Bank and French interest (Gilguy, 1998, Zolty, 1996) while the general advocacy of liberalization of agricultural sectors provoked skeptical and critical analyses from various horizons (Bayliss, 2001, Hibou, 1998, Stiglitz, 1999, Traoré, 1999).
The reform of the cotton sectors eventually was launched, at different rhythm and following various modalities. Privatization surely took place but not really liberalization of the whole cotton sectors (Bourdet, 2004, Fok and Tazi, 2003, Goreux and Macrae, 2002).
Amazingly, change of the cotton lint commercialization scheme gave rise to no or very discreet discussion. Only one public document discusses the selling through commissioner and the COPACO's performance (Macrae, 1995) preceding the decision to start selling cotton lint to traders. It seems that the acceptance to diversify the cotton selling scheme was a concession gesture from CFDT, if not from the French government, as a sign of good will to reform cotton sectors. Questionable outcomes we observe now likely were not anticipated.
4.2. Dominant position of cotton trading MNCs within one decade
In spite of the difficulty to have access to data related to the cotton transaction contracts, we succeeded for one country (we call country X for not disclosing its name). The data for the 1991-2002 period provide some information on how the ITCO achieves a dominant position in the FACs.
Today, it is acknowledged that in every FAC, cotton is mainly exported by selling it to traders, all MNCs. This is the result of a gradual process. In country X, we observed that it was from 2000 that traders caught up COPACO in getting the cotton of this country ( Table 3), informally, we know that the COPACO's share has plunged to around 15-20% at the last season. The conversion to exclusive sales on FOB position came abruptly, in 2002.
The data cannot help to appraise who are the traders involved (except COPACO) and how many they are. However, we know informally that, till 2000, there were only 5 to 6 cotton trading companies in most FACs. The cotton company in Mali claims dealing with fourteen traders at the last season, after it suffered great payment delay by a well known trader for a large amount of cotton.
Table 3. Distribution of cotton exportation in country X
COPACO Traders others CIF FOB
1991 93,8% 0,7% 5,4% 71,7% 28,3% 1992 95,7% 3,2% 1,1% 70,0% 30,0% 1993 93,6% 2,7% 3,7% 89,6% 10,4% 1994 86,9% 12,7% 0,4% 80,1% 19,9% 1995 91,5% 8,5% 0,0% 79,5% 20,5% 1996 98,0% 1,8% 0,2% 95,8% 4,2% 1997 95,5% 4,0% 0,5% 95,2% 4,8% 1998 90,5% 9,1% 0,4% 93,4% 6,6% 1999 83,5% 16,4% 0,1% 83,3% 16,7% 2000 73,2% 26,8% 0,0% 89,9% 10,1% 2001 60,6% 39,4% 0,0% 95,2% 4,8% 2002 50,6% 49,4% 0,0% 2,7% 97,3%
Sales via or to Sales position
COPACO, on theory, kept the right to continue commissioning for the FACs' cotton companies but it is actually no longer commissioning and is involved now like a conventional trader. In a nutshell, cotton of the FACs is nowadays exclusively sold to traders after an exclusive selling through commissioner. This shift implies also a dramatic change in the selling position. All sales are on FOB position. This change means disruption of the selling
cotton companies with their final clients but also modification of the transaction rules (cf. infra).
The liberalization of the cotton selling enabled the cotton trading MNCs to conquer the FACs' cotton market. The privatization of the cotton companies which followed enabled them to consolidate their position through an upstream integration process. Cotton trading companies like Reinhard, Dreyfus, Aiglon, are running cotton companies in Côte d'Ivoire, Burkina Faso, Benin. Dunavant tried too. DAGRIS itself is committing himself in this upstream integration process (Senegal, Madagascar, Mozambique, Burkina Faso). In short, a substantial share of the transactions of the whole FACs' cotton is actually intra-firm exchanges generally less profitable for the subsidiaries.
4.3. Negative price effect
In the opposite of the objective sought, Figure 2 shows that there is no change in the price of the FACs' cotton relatively to A Index after the liberalization of cotton commercialization. As we pointed out above, the quality of the FACs' cotton is good. To some extent, this quality got improved both in terms of lint length and appearance grade during the recent years ( Table 2). Unchanged price status for a quality which globally got improved is then indication of depressed performance.
This is confirmed by the real prices obtained by country X. It is delicate to compare mean prices when exportation occurs during the whole season with fluctuating prices which are also influenced by quality differentials. Under this reservation, we observe that , at the beginning, traders did propose better prices than COPACO either for sales at CIF or FOB positions, but with quantities which were far lower ( Table 4). When traders start dealing with bigger quantities, up to reach the same level than COPACO, traders no longer showed any price advantage. This result may reveal a penetration strategy from traders which was put aside once the penetration objective is reached.
Table 4. Evolution of the traders' price advantage in country X
COPACO Traders COPACO Traders COPACO Traders COPACO Traders
1991 24 931 300 8 526 9 550 78 620 500 9 254 10 360 1992 29 960 3 727 7 806 6 412 80 573 7 286 1993 7 890 1 273 6 156 6 498 119 640 2 400 6 443 6 721 1994 7 900 11 866 8 327 9 291 79 460 950 7 525 10 226 1995 16 300 10 105 8 024 10 317 101 692 850 9 291 10 218 1996 3 740 3 000 8 700 9 022 161 897 9 311 1997 900 7 500 8 474 9 147 181 345 150 8 792 9 480 1998 1 867 11 945 8 228 8 182 199 486 8 300 9 327 9 762 1999 600 35 830 7 490 7 233 182 294 7 838 2000 2 060 17 725 6 514 5 623 141 697 35 010 6 962 7 813 2001 5 053 5 462 63 253 36 040 8 319 8 137 2002 115 145 112 980 6 421 6 220 3 590 2 750 8 368 8 445
Sales at FOB position Sales at CIF position
Amounts, tons Average price, FF/ton Amounts, tons Average price, FF/ton
When quality criteria are considered, the assumed price advantage of traders is furthermore debatable. For cotton lint of appearance grade higher than the one corresponding to A Index cotton, traders show price disadvantage for a high volume of cotton they buy. In the opposite, when cotton of lower quality criteria is considered, traders do not show any price competitiveness in any case ( Table 5). Lower is the quality, i.e. when lower appearance grade is combined with shorter lint, lower is the traders' price as compared to COPACO.
Table 5. Assessment of price disadvantage with integration of quality criteria
COPACO Traders COPACO Traders COPACO Traders COPACO Traders COPACO Traders COPACO Traders
1991 1 372 7 824 1992 4 100 7 833 671 5 074 1993 1 093 500 6 068 6 250 1 975 273 6 606 6 400 493 5 894 1994 5 600 9 816 8 804 9 299 1995 300 1 000 9 350 9 200 15 300 9 605 7 948 10 323 300 1 000 9 350 9 200 1996 3 740 3 000 8 700 9 022 1997 900 7 500 8 474 9 147 1998 2 000 7 950 1 867 11 945 8 228 8 182 2 000 7 950 1999 25 405 7 363 24 390 7 245 15 405 7 475 2000 400 10 560 7 960 5 687 560 13 375 5 848 5 616 7 560 5 861 2001 417 6 701 200 7 250 200 7 250 2002 48 015 49 760 6 641 6 245 6 200 5 980 6 246 6 919 3 260 7 043
COPACO Traders COPACO Traders COPACO Traders COPACO Traders COPACO Traders COPACO Traders 1991 24 931 300 8 526 9 550 23 559 300 8 567 9 550 1992 25 860 3 727 7 802 6 412 29 289 3 727 7 869 6 412 4 100 7 833 1993 6 797 773 6 170 6 659 5 915 1 000 6 005 6 525 600 500 6 210 6 250 1994 7 900 11 866 8 327 9 291 2 300 2 050 7 163 9 255 950 9 374 1995 16 000 9 105 7 999 10 439 1 000 500 9 185 10 200 1996 3 740 3 000 8 700 9 022 1997 900 7 500 8 474 9 147 1998 1 867 9 945 8 228 8 228 1999 600 10 425 7 490 6 916 600 11 440 7 490 7 206 11 440 7 206 2000 1 660 7 165 6 166 5 529 1 500 4 350 6 763 5 643 400 3 900 7 960 5 550 2001 4 635 5 351 4 853 5 389 217 6 197 2002 67 130 63 220 6 264 6 201 108 945 107 000 6 431 6 181 48 015 46 500 6 641 6 189 Cotton of lower appearance grade Cotton of shorter length Lower grade and shorter length Amounts, tons Price, FF/ton Amounts, tons Price, FF/ton Amounts, tons Price, FF/ton
Price, FF/ton Price, FF/ton
Higher grade and longer length Amounts, tons Price, FF/ton Amounts, tons
Cotton of Higher appearance grade Cotton of longer length Amounts, tons
Definitely, owing to the data of country X, the FACs suffered from traders' price capture. These countries suffer also from detrimental changes in transaction rules.
4.4. Unilateral and unfair readjustment of transactions rules by traders
After the liberalization of the cotton lint commercialization, transaction contract still refer to RGH rules which nevertheless are unilaterally re-interpreted.
Many signs indicate that traders get themselves organized in implementing control before shipment. One trader has set up its own cotton quality laboratory in Benin to control all the cotton it buys from the FACs. Internationally renowned services of quality and shipment controls are now installed in several FACs and are charged of controlling cotton quality on behalf of various traders. This control enables traders to reject cotton bales they are not satisfied with, for reasons they not necessarily specify. The real fact is that the principle of contradictory control -implemented in the face of representatives of selling and buying parties- is over.
The unilateral revocation of a sacrosanct principle attracts no attention while financial implications for the FACs could be enormous. This revocation goes along with the abolition of the notions of franchise and tolerance threshold mentioned above. No tolerance is now applied, and for sure this is at the expense of the selling parties.
All PRSs rules are very clear in the respect of the delay in removing or delivering contracted cotton bales. In case of non respect, penalties apply. Several cotton companies complained that traders may delay a lot the removal the cotton they bought, causing cotton deterioration. This behavior leads the cotton companies to lose three times without compensation through arbitration: storage cost, deterioration-linked penalty and discredit on the image of their cotton.
5. Conclusion
The FACs exclusively fight for the abolition of subsidies applied by a few big cotton producing countries. Although legitimate, it is doubtful that the outcome could be so much satisfactory because subsidizing countries have room in re-arranging measures of their support policies (Fok, 2005).
Hendrickson, 2002, Murphy, 2002). This market power is getting stronger and stronger, it concerns also cotton and there are signs that an international price index serves as an expression of this power.
The FACs were protected from MNCs in the cotton trade. Within less than one decade, and thanks to the implementation of the liberalization process, these companies has become totally dominant. Similar phenomenon is observed with cocoa in Africa (Kaplinsky, 2004, Losch, 2002). Liberalization then served as Trojan Horse for the MNCs penetration.
Negative price impact resulted. Unilateral and unfair change of cotton transaction rules took place. Historical private regulation system are being pushed down to the sole benefit of traders and at the expense of cotton producers.
What can the FACs do? It will be hard to refill the Trojan Horse and push it out. Setting up a follow-up system could help prevent traders from abusing too much their dominant position. In this regard, the FACs should join, if not take the lead of, the movement demanding that MNCs be addressed by the WTO regulation system (Murphy, 1999). So far, these MNCs can enjoy total lack of control and transparency in doing business at the expense of producers. It sounds wise to submit them to fulfill specific questionnaire to inform about their business and the prices they apply, just like what has been requested to State Trading Enterprises at the completion of the Uruguay Round (Article XVII of the GATT 1994, questionnaire set up on 1998).
Finally, it is worth noting the paradox of exacerbated concentration of the commodity trade at the international level while developing countries were forced to go into a fragmentation movement by abolishing marketing boards or public monopoly companies which provided some price protection to farmers. This fragmentation movement made easier the domination of trading MNCs in developing countries. Is it just coincidence?
References
AFCOT, 1994. Le coton brut. Association Française Cotonnière, Le Havre, France.
Baffes, J. and Ajwad, M. I., 2001.Identifying price linkages: a review of the literature and an application to the world market of cotton Applied Economics 33, 1927-1941.
Banque mondiale, 1998. Politiques cotonnières en Afrique francophone, problématiques (version préliminaire). World Bank, Washington.
Bayliss, K., 2001. The World Bank and privatisation: a flawed development tool. Public Services International Research Unit. University of Greenwich, London.
Bernstein, L., 2001.Private commercial law in the cotton industry: creating cooperation through rules, norms and institutions Michigan Law Review 99, 1724-1790.
Boris, J.-P., 2005. Commerce inéquitable. Le roman noir des matières premières, Hachette Littérature, Paris. 188 pp.
Bourdet, Y., 2004. A Tale of three countries - Structure, Reform ad Performance of the Cotton Sector in Mali, Burkina Faso and Benin. Swedish International Development Authority, Stockholm.
CFDT, 1998. Contresens et contre-vérités sur les filières cotonnières africaines : éléments de réponse à un document provisoire abondamment diffusé. Coton et Développement, 2-13.
Fichet, M., 1996. L'impact de la privatisation dans les pays africains de la zone Franc. Coton et Développement, Décembre 1996, 8-18.
Fok, A. C. M., 2001. Privatization of cotton sectors in Sub-Saharan Africa : impacts are still short and worrisome. in Impact of privatisation of the public sector on developing countries. Benefits and problems, ed. CIRAD, Montpellier. 43-64
Fok, A. C. M., 2004. Les facteurs d'efficacité des Systèmes de règlements privés comme institutions de régulation des transactions marchandes. Communication presented to 'Premier Colloque de l'Association Française de Sociologie', 24-27 Février, 2004Villetaneuse, France, 19.
Fok, A. C. M., 2005. Coton africain et marché mondial : une distorsion peut en cacher une autre plus importante. Communication presented to 'Colloque Agence Universitaire de la Francophonie "Filières d'exportation de produits agricoles du sud : réformes institutionnelles, négociations internationales et impacts socio-économiques"', Bamako (Mali), 22.
Fok, A. C. M. and Bachelier, B., 2004. Identification d'un plan d'action d'amélioration de la qualité et de la valorisation de la qualité du coton dans les pays de l'UEMOA. CIRAD, Montpellier.
Fok, A. C. M. and Tazi, S., 2003. Unsettled institutional frameworks: a threat for the future of the Francophone African Cotton. Communication presented to 'Cotton Beltwide Conferences 2003', Nashville, Tennessee, USA, 348-356.
Gilguy, C., 1998. Réforme des filières cotonnières en zone franc : La France, la Banque mondiale et les gouvernements veulent un consensus. Marchés Tropicaux, 26 Juin 1998, 1359.
Goreux, L. and Macrae, J., 2002. Liberalizing the cotton sector in SSA. Louis Goreux Consultant, Washington, DC.
Heffernan, W. D., 1999. Report to the National Farmers Union: Consolidation in the food and agriculture system. National Farmers Union
Heffernan, W. D. and Hendrickson, M., 2002. Multi-national concentrated food processing and marketing systems and the Fram crisis. Communication presented to Conference 'The Farm crisis: how the heck did we get here', Boston, MA, USA, 21.
Hibou, B., 1998.Economie politique du discours de la Banque mondiale en Afrique sub-saharienne. Du catéchisme économique au fait (et méfait) missionnaire Les études du CERI 39, 1-44.
ICAC, 2005. The structure of World Trade. ICAC, Washington, DC.
Kaplinsky, R., 2004. Competitions policy and the global coffee and cocoa value chains. UNCTAD, Geneva.
Losch, B., 2002.Global restructuring and liberalization: Côte d'Ivoire and the End of the International Cocoa Market Journal of Agrarian Change 2, 2, 206-227.
Macrae, J., 1995. La compétitivité du coton dans le monde Pays hors zone franc, Ministère de la Coopération, Paris. 321 pp.
Murphy, S., 1999. Market power in agricultural markets: some issues for developing countries. Institute for Agriculture and Trade Policy, Minneapolis.
Murphy, S., 2002. Managing the invisible hand. Markets, farmers and international trade. An executive summary. Institute for Agriculture and Trade Policy, Minneapolis, USA.
Pursell, G. and Diop, M., 1998. Cotton policies in Francophone Africa. Why and how the "filières" should be liberalized. World Bank, Washington.
Scoppola, M., 1995.Multinationals and agricultural policy in the EC and USA Food Policy 20, 1, 11-25.
Stiglitz, J. E., 1999. Quis custodiet Ipsos Custodes? (Who is to guard the guards themselves?). Corporate Governance failures in the transition. Communication presented to 'Annual Bank
Conference on Development economics - Europe Governance, equity and global market', Paris, June 21-23, 1999, 44.
Trade and Development Board, 1999. Report of the expert meeting on the impact of changing supply-and-demand market strcutures on commodity prices and exports of major interest to developing countries. UNCTAD, Geneva, Switzerland.
Traoré, A. D., 1999. L'étau : L'Afrique dans un monde sans frontières, Actes Sud, Paris. 185 pp. Varangis, P.,Larson, D. and Thigpen, E., 1995. What does experiences in other cotton producing countries suggest for policy reforms in Francophone Africa. The World Bank, Commodity Policy and Analysis Unit, Washington.
Véron, J.-B., 1998.Le coton, "diva" des savanes africaines Afrique contemporaine, 185, 53-62. Wise, T. A., 2004. The paradox of agricultural subsidies: measurement issues, agricultural dumping, and policy reform. Global Development and Environment Institute. Tufts University, USA, Mefford. Zolty, A., 1996. La filière cotonnière dans les turbulences de la libéralisation. Afrique Agriculture, Paris, N° 238, Juin 1996, 58-59.