HAL Id: tel-02884895
https://tel.archives-ouvertes.fr/tel-02884895
Submitted on 30 Jun 2020HAL is a multi-disciplinary open access archive for the deposit and dissemination of sci-entific research documents, whether they are pub-lished or not. The documents may come from teaching and research institutions in France or abroad, or from public or private research centers.
L’archive ouverte pluridisciplinaire HAL, est destinée au dépôt et à la diffusion de documents scientifiques de niveau recherche, publiés ou non, émanant des établissements d’enseignement et de recherche français ou étrangers, des laboratoires publics ou privés.
Olivier Saulnier
To cite this version:
Olivier Saulnier. Deciphering the splicing landscape of Ewing sarcoma. Human health and pathology. Université Sorbonne Paris Cité, 2018. English. �NNT : 2018USPCC268�. �tel-02884895�
École doctorale : « Hématologie, Oncogenèse et Biothérapies » - ED n°561 Institut Curie – INSERM U830
DOCTORAT
Discipline : Médecine Spécialité : Oncogenèse
Thèse présentée et soutenue publiquement par
Olivier SAULNIER
Le 26 novembre 2018
Deciphering the splicing landscape of Ewing sarcoma
Thèse co-dirigée par le Dr. Olivier DELATTRE et le Dr. Martin DUTERTRE
JURY
Pr. Jean SOULIER - UMR 944/7212, Paris Président
Dr. Reini FERNANDEZ de LUCO - UPR 1142, Montpellier Rapporteur Pr. Heinrich KOVAR - Children’s Cancer Research Institute, Vienna Rapporteur
Dr. Françoise REDINI - UMR 1238, Nantes Examinateur
Dr. Eric LETOUZE - UMR 1162, Paris Examinateur
Pr. Franck DEQUIEDT - Laboratory of Gene Expression in Cancer, Liège Examinateur
Dr. Olivier DELATTRE - U830, Paris Co-directeur de Thèse
Cancer can be characterized by abnormal fusion transcription factors. These transcription factors may have gain of function, neomorphic DNA binding properties or aberrant transcriptional activity. This is the case for Ewing sarcoma, which is characterized by a chromosomal translocation EWSR1-ETS. Ewing sarcoma fusion oncoproteins have been mostly studied as aberrant transcription factors due to their ability to specifically bind GGAA repeat sequences and to activate de novo enhancers. In addition, its ability to recruit chromatin-remodeling proteins, to induce chromatin opening and to drive an aberrant transcriptional program is a neomorphic property of the EWSR1 moiety that depends on its low complexity domain. EWSR1-ETS fusions have recently been implicated in alternative splicing regulation but to date this function is mainly attributed to the EWSR1 part. However, ERG protein, a member of the ETS transcription factor family, has been lately shown to control post-transcriptional processes such as mRNA stability. Considering these observations, we decided to challenge this view by studying ERG as a bona fide splicing regulator.
This work highlights a new function of ERG subfamily proteins (ERG, FLI1 and FEV) in alternative splicing regulation. We have shown that ERG proteins interact with the master splicing regulator RBFOX2 to similarly regulate a common splicing program. We demonstrated that this new function is mediated via protein-protein interaction through the C-terminal domain of ERG. Because this domain remains in EWSR1-ETS fusions, we demonstrated that EWSR1-FLI1 protein is still able to bind RBFOX2 as expected. In addition, EWSR1-FLI1 induces massive changes of the splicing landscape of Ewing sarcoma and regulates an RBFOX2-dependent splicing program. However, in contrast to the collaborative effect observed for ERG, we found that EWSR1-FLI1 antagonizes RBFOX2-splicing function by repressing RBFOX2 binding to its pre-mRNAs targets. Importantly, we have found that mis-splicing of ADD3 by EWS-FLI1 leads to the repression of the mesenchymal phenotype of Ewing sarcoma cells. Our study provides direct evidence to understand how splicing dysregulation by an oncogenic transcription factor impacts on Ewing sarcoma biology.
Certains cancers peuvent être caractérisés par un facteur de transcription aberrant. C’est le cas du sarcome d’Ewing qui est caractérisé par une translocation chromosomique générant une protéine de fusion appelée EWSR1-ETS. Ces protéines de fusion ont principalement été étudiées en tant que facteur de transcription car elles ont la capacité de se fixer sur des séquences de type répétition de GGAA dans le génome et d’activer la transcription de nombreux gènes. Les fusions EWSR1-ETS ont aussi la capacité de recruter les protéines du complexe du remodelage de la chromatine afin d’augmenter l’accessibilité aux régions riches en répétition de GGAA et donc promouvoir un programme transcriptionnel aberrant. Cette propriété dépend majoritairement de la partie EWSR1 et de son domaine de faible complexité qui lui permet, notamment, d’interagir avec de nombreuses protéines. Les fusions EWSR1-ETS ont aussi été impliquées dans la régulation de l’épissage alternatif ; mais à ce jour cette fonction reste peu décrite et est principalement attribuée à la partie EWSR1. Cependant, il a récemment été montré que la protéine ERG (qui est très homologue à FLI1) contrôle la stabilité des ARN messagers. Ces observations nous ont mené à tester le rôle potentiel de ERG (et par conséquent de FLI1) dans l’épissage alternatif afin de mieux décrire les mécanismes impliqués dans la régulation de l’épissage alternatif induite par les protéines de fusion EWSR1-ETS dans le sarcome d’Ewing.
Ce travail a permis d’identifier une nouvelle fonction des protéines de la sous-famille ERG (ERG, FLI1 et FEV) dans la régulation de l’épissage alternatif. Nous avons montré que les protéines ERG interagissent avec RBFOX2, un régulateur de l’épissage et que ERG et RBFOX2 induisent une régulation de l’épissage similaire suggérant, ainsi, un mécanisme de collaboration. Nos résultats démontrent que ERG interagit avec RBFOX2 par son extrémité C-terminale. De manière intéressante, ce domaine est retenu dans les fusions EWSR1-ETS. Nous avons donc confirmé que les fusions EWSR1-ETS étaient aussi capable d’interagir avec RBFOX2 et d’induire un programme d’épissage alternatif commun. Cependant, au contraire de la collaboration observée pour ERG et RBFOX2, nous avons montré que les fusions EWSR1-FLI1 ont un rôle opposé sur le programme d’épissage de RBFOX2. Nous avons également montré que EWS-FLI1 induisait l’épissage alternative du gène ADD3 ce qui a pour conséquence la répression du phénotype mésenchymateux des cellules du sarcome d’Ewing. Notre travail a permis d’identifier de nouveaux mécanismes afin de mieux comprendre comment la dérégulation de l’épissage alternatif par des facteurs de transcriptions oncogéniques influent sur la biologie du sarcome d’Ewing.
Au sein de l’équipe du Dr. Olivier DELATTRE
Génétique et Biologie des tumeurs pédiatriques Unité INSERM U830
Institut Curie – Centre de Recherche 26 rue d’Ulm, 75005 PARIS
First, I would like to thank the members of the jury who accepted to read and evaluate this work. The président of my jury, Professor Jean Soulier, Doctors Reini Fernanzed and Heinrich Kovar, rapporteurs, Doctors Françoise Redini, Eric Letouzé and Franck Dequiedt, examinateurs. Thank you for agreeing to participate as a jury member and for taking the time and effort to read my manuscript. I hope you did not have too many headaches with my English :)
Un immense merci au Docteur Olivier Delattre pour m’avoir accordé sa confiance sur ce projet et pour m’avoir guidé pendant ces trois années. Merci pour nos discussions, ta disponibilité et la liberté que tu m’as accordée tout au long de ma thèse qui m’ont permis de m’épanouir et de développer mon esprit et ma curiosité scientifique.
Je tiens à remercier chalereusement le Docteur Martin Dutertre pour m’avoir apporté tout son soutien et sa connaissance dans le domaine de l’ARN. Je te remercie énormement pour ta disponibilité, ta sympathie et surtout nos échanges, tu m’as tant appris pendant ma thèse.
Je remercie également la team Belge, Katia et Tina et plus particulièrement Franck. Merci de m’avoir fait confiance et d’avoir joué cartes sur table lors de notre rencontre à l’EMBL. Je suis fier du travail que l’on a accompli ensemble et pour cela je t’en suis reconnaissant. Merci pour toutes nos discussions, ta disponibilité et ton honnêteté. Je suis heureux de t’avoir rencontré au cours de ma thèse, je suis certain que la collaboration portera ses fruits et qu’elle continuera longtemps.
Les remerciements risquent d’être longs mais je voudrais remercier l’ensemble des membres de l’équipe du 6ème étage. Je tiens à remercier Karine pour m’avoir aidé sur de nombreux
aspects de biologie ainsi que ta disponibilité à toute épreuve. Merci Nadège pour nos discussions et d’avoir toujours été présent pour moi. Merci à Didier d’avoir été disponible pour moi et mes questions. Merci aux pépous pour votre humour et nos discussions. Je remercie tous les stagiaires et surtout Alice, Camille et Jérômine avec qui j’ai passé des moments mémorables !
et que tu as appris des choses tant sur le plan professionnel que personnel. Un merci à la team NeuNeu, Caroline, Cécile, Ana, Isabelle. Merci pour les moments passés ainsi que nos réflexions qui m’ont beaucoup aidé. Un très grand merci à Carole pour ta bonne humeur et ta disponibilité. Je remercie le Chécaldi lab avec qui j’ai partagé ces derniers mois de thèse, merci pour nos échanges et de m’avoir permis de pratiquer mon anglais au quotidien. J’en avais grand besoin et cela m’a vraiment été bénéfique (il reste du boulot…). Enfin, un merci général à toute l’équipe du 6ème (présents et anciens) ainsi qu’a l’ensemble de l’unité U830,
particulièrement à Yann, Géraldine et Virginie.
Je tiens à remercier Josh Waterfall également pour sa disponibilité, sa gentillesse et son expertise. Thank you a lot Josh, you have always been there when I was knocking at your door asking some random questions. Thank you for your support and talks that we had together, it was so helpful.
Un grand merci au RFLOP et particulièrement à Céline et Angela, pour tous les moments passés ensemble, nos soirées et nos fous rires, ça me manquera... Que de bon souvenirs qui resteront en moi.
Un immense merci à mes deux copains de bureau Sandrine et Mimi. Mes pauvres, ces années ont dues être dures pour vous mais je vous remercie pour tous ces moments passés, vos précieux conseils et votre humour. Sandrine, il va falloir te faire à l’idée qu’il n’y a qu’un seul Olympique, il s’agit de Marseille, la capitale française du foot ! Merci pour ton extrême gentillesse et ton écoute qui sont des qualités si agréables. Mimi, merci pour tout tes conseils et pour ta connaissance. Ta rencontre m’a énormément enrichi, j’ai adoré avoir des discussions avec toi, manger au p’tit caf et pouvoir de parler sur tout et n’importe quoi. Tu es tel un maître Yoda pour moi, j’ai beaucoup appris mais ma maladresse reste flagrante et mes expressions encore bancales. Un énorme merci à vous deux, vraiment.
d’avoir pu trouver une amie comme toi pendant ma thèse et merci pour tous les moments qu’on a pu passé ensemble au labo, en dehors et pour les futurs moments qu’on passera ensemble (hé oui, tu ne te débarrasseras pas de Junior comme ça). Merci d’avoir toujours été là pour moi, en toutes circonstances.
Je remercie Simon, mon binome de galère, mon partenaire d’écriture et mon ami avant tout. Merci d’avoir été là et de m’avoir supporté. Je me souviendrais de tous les moments qu’on a passés ensemble au labo, des étés, des hivers, de l’écriture de la thèse, des vacances, des soirées… Bref merci, sans toi le labo aurait probablement eu une autre saveur.
Je tiens bien évidemment à remercier tout mes amis car il n’y a pas eu que la science et le labo pendant ces trois années, le bar était une seconde maison, dira-t-on. Merci de m’avoir soutenu et permis de tenir le coup. Je remercie donc toute la bande à basile 2.0, pour tout ces moments en soirées, déguisés ou non, des vacances, des fous rires et merci à vous de vous être occupés de moi quand j’étais mourant à 12/10 sur l’échelle de douleur à Auzat, en rando vélo ou dans les Cévennes. C’était 3 ans et demi de folie et j’espère qu’on va en partager beaucoup d’autres ! Un merci particulier à Momo qui a partagé mon quotidien pendant ma thèse, je sais que je n’ai pas été facile mais tu as été un moteur pour me motiver et croire en moi (“Happiness is the only thing that doubles when it’s shared” - Albert Schweitzer). Merci à la team Fratus, que de bon moments partagés ensemble, heureusement que vous etiez là et que rien n’a changé entre nous. Je sais que je peux compter sur vous et que vous me connaissez mieux que quinconque. J’ai hâte de vous faire découvrir mon appart de l’autre côté de l’océan ! Merci à la team Noraj, avec qui, il faut le dire j’ai passé beaucoup (trop !) de temps avec vous. Dire que je suis passé dresseur level 40 à Pokemon Go en quelques mois alors que je faisais une thèse… Je pourrais rajouter une ligne sur mon CV. Merci pour toutes les raclettes, les Pho, les repas du monde etc.., c’était top !
Je tiens à remercier mes mentors sans qui je n’aurais pas eu ce goût pour la recherche et cette curiosité d’esprit, donc merci à Richard Houlston, Marc Sanson et Jean-Yves Delattre. Je remercie aussi trois professeurs emblématiques. On ne le signal pas suffisament mais vous avez eu un rôle majeur dans ma poursuite d’étude. Des professeurs qui aiment leur métier, ça change une vie. Donc merci à Anh Pham, Brunehild Sallen et Daniel Loncle. Bises à toi Romain.
Je remercie aussi ma famille et particulièrement ma mère et mon frère qui ont toujours été là pour me soutenir et pour donner le meilleur de moi-même dans mes études et merci pour la relecture du manuscrit !
To my father and grandfather
The more I learn, the more I realize how much I don’t know
INTRODUCTION ... 17
I.
Ewing sarcoma ... 18
A. Clinical characteristics ... 18
1. Historic context and localization ... 18
2. Histology ... 19
3. Epidemiology ... 20
4. Prognosis factors and treatment ... 20
B. “The origin of cancer: once upon a cell” (ADELIH conference 2018) ... 22
1. Neural-crest stem cells... 22
2. Mesenchymal stem cells ... 23
C. Genetics of Ewing sarcoma ... 24
1. The hallmark of Ewing sarcoma: FET-ETS fusions ... 24
2. The FET RNA-binding protein family ... 25
3. The ETS transcription factor family ... 27
4. Other genetic alterations ... 28
D. Oncogenic neomorphic properties of EWS-FLI1 fusion gene ... 29
1. Transcription factor properties ... 29
2. Inherited germline variant ... 30
3. EWS-FLI1 as a mediator of chromatin remodeling ... 32
4. Ewing sarcoma phenocopy BRCA1-deficient tumors ... 33
5. EMT-like, plasticity and heterogeneity ... 33
II.
Alternative splicing ... 37
A. The basics of splicing and alternative splicing ... 37
1. Historic context ... 37
2. Biological function ... 37
3. Splicing in numbers ... 38
4. Different types of alternative splicing events ... 39
B. Multiple layers of regulation ... 40
1. The core splicing signals ... 40
2. Spliceosomal proteins ... 41
3. Spliceosome assembly ... 42
C. Alternative splicing as a new hallmark of cancer ... 46
1. Cell survival ... 46
2. Epithelial-to-mesenchymal transition ... 47
3. Splicing as an oncogenic driver ... 51
D. Splicing regulation by FET, ETS and FET-ETS proteins ... 53
1. Splicing regulation by FET proteins ... 53
2. ETS transcription factors as splicing modulators ... 53
3. Splicing regulation by EWS-FLI1 fusion protein ... 53
III.
Splicing analysis ... 56
A. Technologies ... 56 1. RT-PCR ... 57 2. Exon-arrays ... 57 3. RNA-seq ... 58 4. Illumina... 60 5. Pacific Biosciences ... 61 B. Bioinformatics ... 62 1. Pipeline ... 62 2. Quality control ... 63 3. Alignement ... 63 4. Quantification ... 64 5. Visualization ... 66
RESULTS ... 68
COMPLEMENTARY RESULTS ... 106
DISCUSSION ... 119
I.
Deciphering the role of ERG and EWS-ETS proteins on splicing ... 120
sarcoma ... 128
IV.
PacBio sequencing as a promising technology for splicing analysis .. 130
V.
Significance and model ... 132
Figure 1: Most frequent primary tumor and metastatic sites in skeletal Ewing sarcoma ... 18
Figure 2: Histological and immunohistochemical features of Ewing sarcoma ... 19
Figure 3: Overall survival in Ewing sarcoma tumors ... 20
Figure 4: Schematic representation of EWSR1, FLI1 and EWS-FLI1 (type I fusion) domains .. 24
Figure 5: Schematic representation of how RBPs with prion-like domain undergo phase separation ... 26
Figure 6: Somatic mutation frequency across human cancers ... 28
Figure 7: Enriched motifs observed in EWS-FLI1 ChIP-seq peaks by the MICSA algorithm .... 29
Figure 8: Schematic representation of how a genetic susceptibility factor, which is frequent in European population, interacts with EWS-FLI1 oncoprotein to drive abberant transcriptional program ... 31
Figure 9: Mechanistic model of EWS-FLI1 binding at GGAA microsatelites and de novo enhancer activation in Ewing sarcoma ... 32
Figure 10: Schematic mechanism of Ewing sarcoma dissemination based on EWS-FLI1 fluctuation ... 35
Figure 11: Alternative splicing modify protein interaction networks ... 38
Figure 12: Five major events of alternative splicing ... 40
Figure 13: Schematic overview of splicing sites composition ... 41
Figure 14: Overview of the spliceosome machinery assembly ... 42
Figure 15: Schematic model of splicing regulation through RBPs ... 43
Figure 16: Putative model of the alternative splicing regulation through modulation of the RNA polymerase II elongation rate ... 45
Figure 17: Bcl-x isoforms have distinct cellular functions ... 47
Figure 18: Schematic overview of epithelial-to-mesenchymal transition ... 49
Figure 19: Mass spectrometry analysis identified spliceosome-associated proteins as EWS-FLI1 binding partner ... 55
Figure 20: Overview of a subset of next generation sequencing applications ... 56
Figure 21: Schematic overview of alternative splicing analysis using RT-PCR method ... 57
Figure 25: Overview of the pipeline to study alternative splicing ... 62
Figure 26: Overview of the two mapping methods ... 64
Figure 27: Quantification of an alternative splicing event using the percent of spliced in (PSI) value ... 65
Figure 28: IGV screenshot of a genomic region in EHBP1 gene ... 66
Figure 29: Sashimi plot of a genomic region in EHBP1 gene ... 67
Figure 30: QKI binding motif is enriched in flanking introns of alternative exons regulated by EWS-FLI1 ... 108
Figure 31: EWS-FLI1 and QKI regulate a common splicing program in an opposite manner 110 Figure 32: ADD3 is a splicing target of EWS-FLI1 ... 111
Figure 33: ADD3 exon 14 transcript is expressed in Ewing tumors and is absent in mesenchymal cells ... 113
Figure 34: Deletion of ADD3 exon 14 using specific siRNAs and CRISPR-Cas9 technology ... 114
Figure 35: ADD3 exon 14 transcript deletion has major impact on cell phenotype ... 116
Figure 36: ADD3 exon 14 rescue expression leads to phenotypical changes ... 118
Figure 38: Distribution of top significant GO molecular function and biological process terms from curated lists of (A) JUN protein interaction and (B) MYOD1 protein interaction ... 121
Figure 39: RBFOX2 RNA-map representation ... 124
Figure 40: False Discovery Proportion (FDP) of motif enrichment analysis on RBFOX2-regulated exons ... 126
Figure 41: Interplay of RNA binding proteins to control splicing outcomes ... 127
Figure 42: IGV screenshot of ADO gene ... 131
Figure 43: IGV screenshot of the red framed region in Figure 42 ... 131
Figure 44: IGV screenshot of EHBP1 gene showing an alternatively spliced exon upon EWS-FLI1 depletion ... 132
Figure 45: Schematic model of alternative splicing regulation by ERG proteins (ERG, FLI1 and FEV) and EWS-FLI1 oncoprotein ... 133
Olivier Delattre’s lab, called “Genetics and biology of childhood cancers” aims to better understand and describe molecular mechanisms at the origin of these tumors. A wide-range of biological questions are under investigation in the lab including chromatin conformation, tumor heterogeneity, mechanisms of dissemination and development of new therapeutic strategies. Ewing sarcoma is a pediatric tumor originating from bones and soft tissues and characterized by a chromosomal translocation EWSR1-ETS. In 85% of cases, the balanced translocation t(11;22)(q24;q12) leads to the chimeric fusion protein EWSR1-FLI1 that acts as an aberrant transcription factor. Neomorphic properties of EWSR1-FLI1 require the low complexity region of EWSR1 and the DNA-binding domain of FLI1 to hijack chromatin machinery, hence governing DNA accessibility and driving aberrant transcriptional programs. In addition to its transcriptional regulatory activty, EWSR1-FLI1 plays a role in alternative splicing regulation via interaction with core components of the spliceosome complex or by modulation of the RNA polymerase II elongation rate. However, the functional consequences and the underlying regulatory mechanisms are poorly understood.
The main project of my PhD was to identify, characterize and study the biological functions of alternative splicing events induced by EWSR1-FLI1 fusion protein. To do so, I have combined bioinformatics approaches as well as wet lab techniques to decipher the role of EWSR1-FLI1 on alternative splicing. I have used several RNA seq dataset from the lab, as well as previously published data from the literature, to identify EWSR1-FLI1-dependent splicing events. Curation of the current literature on splicing analysis tools was necessary to identify robust, reliable and convenient software for our purpose. Combined bioinformatics analysis, in silico prediction and in vitro validation allowed us to better characterize the splicing landscape of Ewing sarcoma. In addition, I have used siRNAs transfections and CRISPR technology to specifically decipher the functional role of a mis-splicing induced by EWSR1-FLI1 on Ewing sarcoma biology.
Moreover, in 2016, I had the opportunity to meet Dr. Franck Dequiedt (head of the “Protein Signaling and Interactions” lab, GIGA institute, Belgium) who is working on the role of ETS transcription factor in post-transcriptional processes. His lab has recently demonstrated that ERG transcription factor is associated to nascent RNA by interacting with RNA-binding proteins
for EWSR1-FLI1 splicing function. Thus, we started a collaboration between both groups to understand mechanisms underlying EWSR1-ETS splicing function and the functional impact of alternative splicing regulation on Ewing sarcoma biology.
17
18
I.
Ewing sarcoma
A. Clinical characteristics
1. Historic context and localization
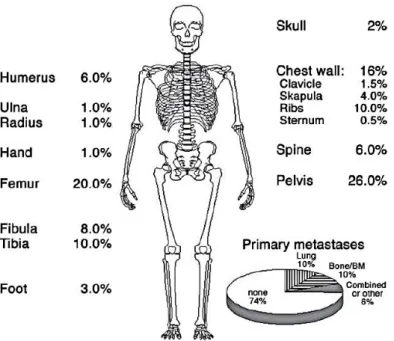
Ewing sarcoma was first described by James Ewing in 1921 as a new bone tumor entity called “diffuse endothelioma of bone” (Ewing, 1921). His first report was about seven young patients from fourteen to nineteen years old with tumors localized in bones and microscopically identical. Ewing sarcoma is the second most common malignant bone tumor in the pediatric population. This tumor mainly occurs in bones, such as pelvis, femur or tibia and in some rare cases, it can also arise from soft tissues (Figure 1).
Figure 1: Most frequent primary tumor and metastatic sites in skeletal Ewing sarcoma. From Bernstein et al., 2006
19 2. Histology
The actual World Health Organization Classification (WHO) classification of soft tissue and bone tumors regroups Ewing sarcoma, primitive neuroectodermal tumor (pNET) and Askin tumors as one uniform tumor entity expressing FET-ETS fusion genes (de Alava et al., 2013; Doyle, 2014). Histological features include undifferentiated small round cells with scanty cytoplasm containing glycogen deposits. Tumor cells highly express the transmembrane glycoprotein CD99, which is used in routine for diagnosis (Figure 2) (Ambros et al., 1991). However, CD99 expression is not fully restricted to Ewing sarcoma and can also be present in other round cell sarcomas or in leukemia (Prakash et al., 2008). Ewing sarcoma are characterized by a chromosomal translocation between FET family of RNA-binding proteins and ETS transcription factor family, thus producing a chimeric transcription factor with neomorphic properties (Delattre et al., 1992). Tumors with uncommon features can be analyzed using fluorescence in situ hybridization (FISH) or reverse transcriptase polymerase chain reaction (RT-PCR) methods for the search of FET-ETS fusions. The search for an Ewing-specific biomarker in clinics is still relevant (Baldauf et al., 2018).
Figure 2: Histological and immunohistochemical features of Ewing sarcoma. (A) Classic Hematoxylin and Eosin staining of an Ewing sarcoma tumor showing small round blue cells with a minimal cytoplasm. (B) Tumor cells show a strong immune-reactivity for membranous CD99 protein. From Nadège Gruel, unpublished data.
20 3. Epidemiology
Ewing sarcoma has an incidence of 1.5 cases per million per year and this number has remained unchanged for decades (Jawad et al., 2009). It mainly affects children and young adults with a median age at diagnosis of 15 years. Men are slightly more affected than women with a sex ratio of 1.5:1 (Jawad et al., 2009). Although some rare familial cases exist (Randall et al., 2010), this disease is not associated with strong hereditary predisposition. To date, no environmental exposures have been linked to Ewing sarcoma oncogenesis. Nevertheless, Ewing sarcoma is much more common in Caucasians and is nearly absent in the African population (Jawad et al., 2009). Genome-wide association studies (GWAS) identified six loci (EGR2, ADO, TARDBP, RRE1, KIZ and NKX2-2) associated with Ewing sarcoma predisposition (Machiela et al., 2018; Postel-Vinay et al., 2012). Furthermore, risk haplotypes in these loci were less prevalent in the African population, which partially explain the geographic bias observed in this tumor type.
4. Prognosis factors and treatment
Ewing sarcoma is an aggressive tumor; around 25% of patients already show metastasis at diagnosis. This factor is the main prognosis factor and is associated with very low survival rate (Figure 3). Therefore, only 20% of patients with metastasis at diagnosis survive after 5 years compared to 70% of overall survival for patients with localized tumors (Gaspar et al., 2015; Paulussen et al., 1998; Spraker et al., 2012).
21 Ewing sarcoma treatment includes neoadjuvant chemotherapy, surgery and/or radiotherapy. Chemotherapy is given before surgery to reduce the global tumor size and to target potential micrometastases. In Europe, standard chemotherapy includes six cycles of combination of four agents: vincristine, ifosfamide, doxorubicine, etoposide (VIDE protocol – Euro-EWING 99) (Juergens et al., 2006; Ladenstein et al., 2010). Surgery consists in the resection of the remaining tumor mass without affecting normal adjacent tissues as far as possible. In some cases, there is no tissue reconstruction necessary or feasible (e.g. tumors in the radius or fibula). Radiotherapy can be applied before or after surgery. Patients treated with both surgery and radiotherapy have a lower risk to develop local recurrence compared to patients treated with surgery only. However, there is no statistical difference observed in overall survival between these two subgroups (Foulon et al., 2016).
Despite development of pharmacological inhibitors for kinase fusion genes such as EML4-ALK in lung cancer (Kwak et al., 2010), targeting FET-ETS fusions in Ewing sarcoma remains complex, in particular due to the lack of enzymatic activity. Nevertheless, several groups focused on downstream FET-ETS targets to induce death of tumor cells. To date, there are few targeted therapies that have been pushed in clinical trials but the success of these studies is moderate. For example, the insulin-like growth factor 1 receptor (IGF1R) has been considered as a potential therapeutic target in Ewing sarcoma since decades. Several studies have shown that IGF1R blockade reduces tumor growth, hence suggesting an important role in Ewing sarcoma initiation (Manara et al., 2007; Scotlandi et al., 1998; Toretsky et al., 1997; Yee et al., 1990). However, clinical studies have demonstrated that only a small subset of patients (from 8% to 15%) benefit from this therapy (O’Neill et al., 2013). It is essential to decipher molecular mechanisms of action of this therapy to predict patients that will most likely respond to this therapy.
In addition, poly(ADP-ribose) polymerase (PARP) inhibitors are known to be efficient for tumors with BRCA1/2 deficiency. A recent report of homologous recombination defects in Ewing sarcoma (Gorthi et al., 2018) gives new insights on the sensitivity of Ewing sarcoma cells to PARP inhibitors and could be a promising therapeutic target to develop (Brenner et al., 2012; Garnett et al., 2012).
22 In the era of immunotherapy, Ewing sarcoma is considered as “cold tumor” or “immune desert” due to a very small fraction of tumors that exhibit immune infiltration (Grünewald et al., 2018). Additionally, Ewing sarcoma tumors do not express the immunosuppressive molecule programmed cell death 1 ligand 1 (PDL1) but can upregulate it under inflammatory stimulation (Machado et al., 2018; Spurny et al., 2018). Although still under evaluation, it is crucial to decipher the mechanisms of immune evasion in Ewing sarcoma to develop effective immune-based therapeutic strategies. Immunotherapy has the potential to improve current Ewing sarcoma management and to decrease toxicity and long-term treatment effects.
B. “The origin of cancer: once upon a cell” (ADELIH conference 2018)
Even though extensive studies on the cellular origin of Ewing sarcoma in the past decades has been done, this question is still under debate and remains unclear, in particular due to the neomorphic function of EWSR1-FLI1. Ewing sarcoma primarily arises from bone; hence, progenitors might come from either neural-crest-derived stem cells or bone marrow-derived mesenchymal cells.
Interestingly, Chan and colleagues reported, very recently, the first isolation of human skeletal stem cells that can differentiate into progenitors of bone, cartilage and stroma but not fat, muscle, fibroblasts or hematopoietic (Chan et al., 2018). This study might reveal new perspectives on the identification of the cell of origin of Ewing sarcoma tumors.
1. Neural-crest stem cells
It has been shown that Ewing sarcoma cells express neural-crest stem cells (NCSCs) markers including CD57, ENO2 and genes of the Notch pathway (Baliko et al., 2007; Franchi et al., 2001; Wahl et al., 2010). In addition, ectopic expression of EWSR1-FLI1 induces a neural crest-like phenotype and abrogates the existing cell differentiation program (Hu-Lieskovan et al., 2005; Teitell et al., 1999).
These experiments were performed in multiple cellular contexts suggesting that the observed phenotype upon EWSR1-FLI1 expression might be attributed to its transcriptional reprogramming function rather than intrinsic properties of the supposed cell of origin.
23 2. Mesenchymal stem cells
In 1970, Friendestein and colleagues identified an adherent cell population that morphologically looks like fibroblasts and is able to form colony units (Friedenstein et al., 1970). Caplan and colleagues introduced the term mesenchymal stem cells (MSCs) in 1991 to a population from the bone marrow that exhibited ability to differentiate into bone and cartilage (Caplan, 1991). MSCs are multipotent cells that have self-renewal capacity and the ability to differentiate into several cell types including osteocytes, chondrocytes, adipocytes, and myocytes (Gang et al., 2004; Pittenger et al., 1999).
Expression of EWSR1-FLI1 in MSCs blocked their differentiation, thus revealing the impact of the fusion protein on the undifferentiated status of Ewing cells (Torchia et al., 2003). In addition, ectopic expression of EWSR1-FLI1 in murine MSCs led to cell transformation and tumor growth with Ewing-like properties such as CD99 expression (Castillero-Trejo et al., 2005; Riggi et al., 2005). Furthermore, comparison of transcriptomic profiles of Ewing sarcoma cells depleted for EWSR1-FLI1 converge towards MSCs and these cells are able to differentiate along the adipogenic and osteogenic lineages (Tirode et al., 2007). Overall, these studies underline the complex role of EWS-FLI1 in a putative mesenchymal cell of origin.
24
C. Genetics of Ewing sarcoma
1. The hallmark of Ewing sarcoma: FET-ETS fusions
The genetic hallmark of Ewing sarcoma is a balanced chromosomal translocation between a member of the RNA-binding protein family FET and a member of the ETS transcription factor family. The first translocation, t(11;22)(q24;q12), has been identified in 1983 (Aurias, 1983; Turc-Carel et al., 1983). In 85% of Ewing sarcoma, translocation results in the formation of a fusion gene between EWSR1 and FLI1, encoding an RNA-binding protein and a transcription factor respectively (Figure 4) (Delattre et al., 1992). This primary oncogenic event leads to a fusion gene containing the 5’ low complexity region of EWSR1 and the 3’ DNA binding domain of the FLI1 gene. EWSR1 gene and EWSR1-FLI1 fusion gene will be referred as EWS and EWS-FLI1, respectively, for the rest of the manuscript. EWS-FLI1 fusion gene is ubiquitously expressed because of the EWS reporter activity. However, FLI1-EWS fusion has rarely been found expressed in Ewing sarcoma because the FLI1 promoter is quiescent. In addition, a recent study suggested that a proportion of Ewing sarcoma translocations are generated from a complex mechanism, called “chromoplexy” (Anderson et al., 2018). This mechanism causes a sudden burst of chromosomal rearrangements in the cell resulting in disruption of the reciprocal fusion FLI1-EWS, which is not observed in chromoplexy-induced translocations.
Figure 4: Schematic representation of EWSR1, FLI1 and EWS-FLI1 (type I fusion) domains. Black arrows indicate genomic breakpoints. Abbreviations: RNA recognition motif (RRM); Arg-Gly-Gly repeats (RGG); Pointed domain (PNT); ETS DNA-binding domain (ETS).
In the remaining 15% of cases that do not harbor the EWS-FLI1 translocation, numerous other fusion genes have been found, mainly implicating EWS with other ETS family genes (Table 1) (Jeon et al., 1995; Kaneko et al., 1996; Ng et al., 2007; Peter et al., 1997; Shing et al., 2003; Zucman et al., 1993).
25 Table 1: Chromosomal translocations observed in Ewing sarcoma.
In addition, more than ten distinct types of the EWS-FLI1 transcripts exist. The two most frequent fusion transcripts are fusions of EWS exon 7 / exon 6 FLI1 (called fusion type I) and EWS exon 7 / exon 5 FLI1 (fusion type II) (Zucman et al., 1993).
2. The FET RNA-binding protein family
The FET protein family is composed of three RNA-binding proteins (RBPs) called fused in sarcoma (FUS), Ewing sarcoma breakpoint region 1 (EWSR1) and TATA-binding protein-associated factor 15 (TAF15). Structurally, FET proteins share a high sequence similarity and share an RNA-binding domain, multiple Arg-Gly-Gly boxes and a low complexity region (Tan and Manley, 2009). The FET members are ubiquitously expressed in almost all tissues and are mainly located in the nucleus. They are implicated in various processes, including transcription, post-transcriptional regulation and DNA repair (Hallier et al., 1998; Hoell et al., 2011; Wang et al., 2013; Yang et al., 1998; Zhang et al., 1998). They serve as transcriptional coregulators interacting with several transcription factors, the RNA polymerase II and the TFIID complex (Tan and Manley, 2009). Through their RNA binding domain, they have regulatory roles in multiple post-transcriptional processes, from splicing to export to translation notably by interacting with RNA-processing proteins (Meissner et al., 2003; Yang et al., 1998). They have been involved in the formation of stress granules, which are cytoplasmic RNA-protein aggregates induced by stresses (Ramaswami et al., 2013).
One important specificity of these proteins is the prion-like domain (PrLD), which is a low-complexity region rich polar, uncharged amino acids such as glutamine (Q), glycine (G), serine (S) and tyrosine (Y). This domain is similar in composition to prion and is conserved through evolution. Prions have been discovered in the 60’s in mammals and are known to cause neurodegenerative disorders in humans such as Kuru or Creutzfeldt-Jacob.
Family Translocation Fusion gene Frequency References EWS-ETS t(11;22)(q24;q12) EWS-FLI1 85% Delattre et al., 1992
t(21;22)(q22;q12) EWS-ERG 10% Zucman et al., 1993 t(2;22)(q33;q12) EWS-FEV <1% Peter et al., 1997 t(7;22)(p22;q12) EWS-ETV1 <1% Jeon et al., 1995 t(17;22)(q12;q12) EWS-ETV4 <1% Kaneko et al., 1996 FUS-ETS t(16;21)(p11:q22) FUS-ERG <1% Shing et al., 2003
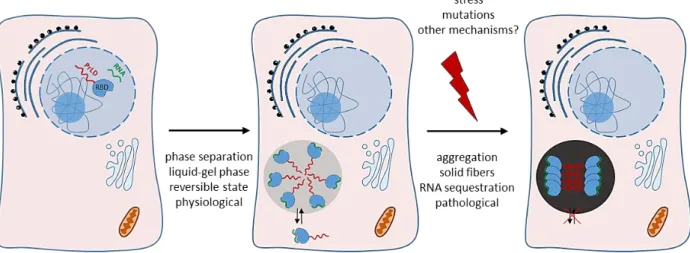
26 Proteins displaying such domain (mainly RBPs) can undergo physiological and reversible phase transition between soluble, hydrogel and fibrous states (Figure 5) (Han et al., 2012; Kato et al., 2012). These amyloid-like fibrils are structurally formed by β-sheet assembly, which are insoluble and resistant to degradation (Rambaran and Serpell, 2008). Moreover, they have the ability to form membrane-free compartments, thus sequestrating substrates such as RNA into these transient organelles. For instance, fused in sarcoma (FUS) gene encodes for an RNA-binding protein composed of a RNA recognition motif (RRM) and a prion-like domain. FUS protein is normaly localized in the nucleus and regulates several processes mainly associated with RNA processing. However, FUS mutant proteins have been shown to mislocalize to the cytoplasm and to form pathological protein aggregates in motor neurons (Kwiatkowski et al., 2009). Mutations in FUS have been linked to several diseases such as Amyotrophic Lateral Sclerosis (ALS) and Frontotemporal dementia (FTD) (Alberti et al., 2009; Couthouis et al., 2011; Da Cruz and Cleveland, 2011; Harrison and Shorter, 2017; Mackenzie et al., 2010; Patel et al., 2015).
In addition, Maharana and colleagues have suggested a mechanism by which RNA concentration in the nucleus governs the ability of RBPs to mislocalize to the cytoplasm and to form pathological solid aggregates, hence sequestering RNA molecules and proteins in the cytoplasm (Maharana et al., 2018).
Figure 5: Schematic representation of how RBPs with prion-like domain undergo phase separation. RNA-binding proteins that arbor prion-like domain are soluble in the nucleus and go through phase separation in the cytoplasm to form membrane-less compartments. Under specific stress, mutation or other mechanisms, RBPs harbor mis-folding and undergo pathological protein aggregates leading to an important cell dysfunction. Abbreviations: prion-like domain (PrLD); RNA-binding domain (RBD). PrLD is represented in red and RNA in green.
27 3. The ETS transcription factor family
The E-twenty-six transformation-specific (ETS) family is one of the largest transcription factor family that includes 27 proteins subdivided in 12 subgroups. All ETS proteins share a conserved ETS DNA-binding domain. ETS transcription factors are implicated in a wide-range of biological processes and influence gene regulation in particular during embryonic development and differentiation (Oikawa and Yamada, 2003; Schober et al., 2005; Sharrocks, 2001). All ETS members bind a core purine-rich motif (GGA[A/T]), however flanking sequences or specific binding partners can affect transcriptional activity (Karim et al., 1990; Nye et al., 1992). The ERG subfamily is composed of three proteins: ETS-related gene (ERG), friend leukemia integration 1 transcription factor (FLI1) and fifth Ewing variant (FEV). This family has been largely implicated in many chromosomal translocations in cancer, such as EWS-FLI1 in Ewing sarcoma (Delattre et al., 1992) or TMPRSS2-ERG in prostate cancer (Tomlins et al., 2005). ETS transcription factors have been widely studied as oncogenic transcription activators (Sizemore et al., 2017), however only a few suggested a role of ETS proteins in post-transcriptional regulation (Guillouf et al., 2006; Rambout et al., 2016), as I will discuss below (See Section II.D).
Several reports have demonstrated that ETS proteins are implicated in post-transcriptional processes such as splicing or mRNA degradation. For instance, Spi-1-/PU.1 is able to bind RNA through its DNA-binding domain and induce alternative splicing (Guillouf et al., 2006; Hallier et al., 1996, 1998). Recently, ERG has been shown to control mRNA degradation through interaction with RBPs (Rambout et al., 2016). Altogether, these observations suggest that ETS proteins are implicated in many cellular processes and should not be considered only as transcription factors.
28 4. Other genetic alterations
Ewing sarcoma, as most pediatric cancers, has a silent genomic profile and presents one of the lowest mutation rate (0.3/Mb) across all cancer types (Figure 6) (Lawrence et al., 2013; Mugneret et al., 1988)
Figure 6: Somatic mutation frequency across human cancers. The lowest mutation rates (left) are found in pediatric cancers, whereas the highest frequencies (right) are found in tumors induced by carcinogens, such as ultraviolet light and tobacco. Adapted from Lawrence et al., 2014.
Recently, several groups have identified the mutational landscape of Ewing sarcoma using whole-genome sequencing (Brohl et al., 2014; Crompton et al., 2014; Tirode et al., 2014). Recurrent mutations were found in the Cohesin subunit SA-2 (STAG2) (20%), Cyclin Dependent Kinase Inhibitor 2A (CDKN2A) (13%) and Tumor Protein P53 (TP53) (6%) genes. Interestingly, these studies showed that prognosis of patients harboring both STAG2 and TP53 mutations is particularly unfavorable, suggesting a potential cooperation between these two mutations to increase tumorigenesis. Altogether, these findings underline the genetic background of Ewing sarcoma and suggest STAG2 as a potential target for therapeutic development. The development of therapies targeting chromatin remodelers and epigenetic regulators could be a promising avenue such as lysine-specific histone demethylase 1A (LSD1) inhibitors (Bennani-Baiti et al., 2012; Sankar et al., 2014).
29
D. Oncogenic neomorphic properties of EWS-FLI1 fusion gene
EWS-FLI1 fusion is a chimeric transcription factor with neomorphic functions that aberrantly modulates expression of thousands of genes. In particular because of its ability to bind GGAA microsatellites, thus activating de novo enhancers (Boulay et al., 2017). EWS-FLI1 protein have oncogenic properties and is critical for cell transformation and proliferation (May et al., 1993). However, very few cells tolerate stable expression of EWS-FLI1 and the cellular context seems to be essential to recapitulate Ewing sarcoma biology.
1. Transcription factor properties
EWS-FLI1 binds DNA through the DNA-binding domain of FLI1, which remains in the fusion. Several studies have identified, using chromatin immunoprecipitation (ChIP) data, the DNA binding motif of EWS-FLI1 (Figure 7) (Boeva et al., 2010; Gangwal et al., 2008; Guillon et al., 2009). Both, FLI1 and EWS-FLI1, bind the same canonical ETS binding motif composed of a GGAA site.
However, EWS-FLI1 can bind GGAA microsatellites likewise with one rule: “the more GGAA there is, the more expressed it is”, with an upper limit around 20 GGAA repeats (Gangwal et al., 2008; Guillon et al., 2009; Johnson et al., 2017). This binding motif is specific of the fusion protein and is not observed for the wild type FLI1 transcription factor (or any ETS family members) highlighting the neomorphic function of EWS-FLI1.
Figure 7: Enriched motifs oserved in EWS-FLI1 ChIP-seq peaks by the MICSA algorithm. (A) Most enriched motif found representing GGAA microsatellites and (B) canonical ETS binding motif. Adapted from Boeva et al., 2010.
30 EWS-FLI1 oncoprotein modulates a wide-range of biological processes such as cell-cycle regulation, telomerase activity, cell migration and chromatin conformation (Cidre-Aranaz and Alonso, 2015). Epigenomic studies have demonstrated that depending on the binding site, which can either be (GGAA)n or ETS motif, EWS-FLI1 fusion can have distinct transcriptional
regulatory activities. Activated genes encodes for proteins mostly involved in cell-cycle process and are associated with GGAA microsatellite binding site. Otherwise, repressed genes are enriched in extracellular matrix (ECM) pathway and are associated with canonical ETS binding site (Riggi et al., 2014; Tomazou et al., 2015).
2. Inherited germline variant
Furthermore, several transcriptional targets of EWS-FLI1 have been extensively described. For instance, Early Growth Response 2 (EGR2) is important for Ewing sarcoma tumorigenicity and is highly expressed in Ewing tumors compared to other tumor types and normal tissues (Grünewald et al., 2015). This gene is located nearby the locus identified by GWAS as genetic variant associated with Ewing sarcoma susceptibility (Machiela et al., 2018; Postel-Vinay et al., 2012). The Single Nucleotide Polymorphism (SNP) rs79965208 is located within a long sequence of 16 GGAA repeats that is bound by EWS-FLI1 (Figure 8). For this SNP, the reference allele is T, whereas A is the alternative allele. Having the T reference allele splits the sequence of GGAA repeats into two sequences of 11 and 4 repeats. The homozygous A/A genotype is associated with an overexpression of EGR2 gene compared to A/T or T/T genotypes. Additionally, the T reference allele is predominant in the African population compared to Caucasians suggesting a role of this SNP on Ewing sarcoma susceptibility and oncogenesis. Altogether, the study deciphers how inherited germline variants cooperate with EWS-FLI1 fusion protein to promote tumorigenesis.
31 Figure 8: Schematic representation of how a genetic susceptibility factor, which is frequent in European population, interacts with EWS-FLI1 oncoprotein to drive abberant transcriptional program. (A) EWS-FLI1 binds a GGAA microsatellite nearby EGR2 locus. Interestingly, a SNP converts a GGAT into a GGAA motif, therefore connecting two GGAA repeats into one long repetition of sixteen GGAA, thus enhancing EGR2 expression. (B) Allele frequency distribution for rs79965208 in dbSNP (https://www.ncbi.nlm.nih.gov/projects/SNP). Abbreviations: The Americas (AMR), Europe (EUR), South Asia (SAS), East Asia (EAS), Africa (AFR).
32 3. EWS-FLI1 as a mediator of chromatin remodeling
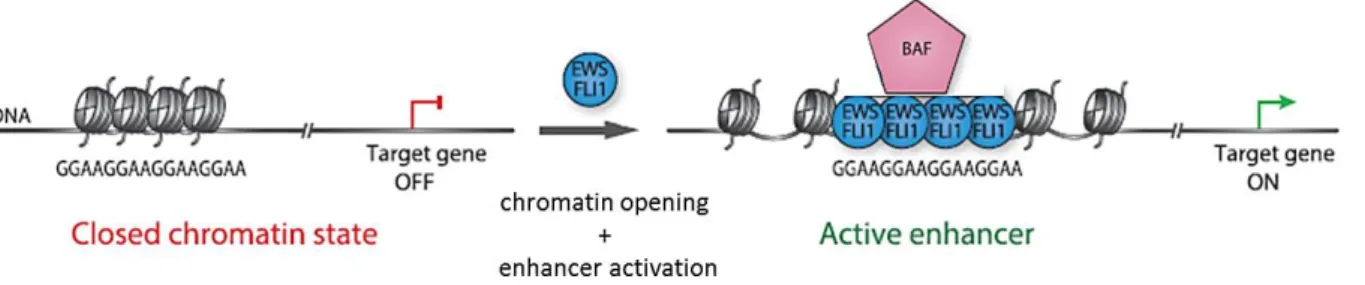
It has been demonstrated that EWS-FLI1 interacts with the BRG1/BRM (BAF) chromatin-remodeling complex via the prion-like domain of EWS (Boulay et al., 2017). BAF complex plays a crucial role on chromatin accessibility at enhancers and promoters regions (Tolstorukov et al., 2013). EWS-FLI1 recruits BAF complex on GGAA microsatellites to promote chromatin opening and de novo enhancer formation (Boulay et al., 2017) (Figure 9). This observation is in agreement with the fact that Ewing sarcoma cell lines are the only known cells that have open chromatin at GGAA repeat regions (Riggi et al., 2014). This study highlighted a fascinating example of how a chromatin remodeling machinery is hijacked by neomorphic properties of a gene fusion to drive aberrant transcriptional programs in cancer.
Figure 9: Mechanistic model of EWS-FLI1 binding at GGAA microsatellites and de novo enhancer activation in Ewing sarcoma. GGAA repeats are often associated to a closed chromatin state. In Ewing sarcoma, EWS-FLI1 recruits BAF chromatin complex to activate chromatin opening at these sites, thereby enhancing gene expression. Adapted Boulay et al., 2017.
Recently, the same group demonstrated how targeting GGAA repeats might be a promising therapeutic strategy for Ewing sarcoma (Boulay et al., 2018). They used CRISPR-dCas9-KRAB technology (Gilbert et al., 2014; Thakore et al., 2015) to induce deposition of the repressive histone mark H3K9me3 on SOX2 GGAA repeats enhancer. Epigenetic silencing of this locus is sufficient to inhibit EWS-FLI1 binding, to abolish SOX2 expression and to impair tumor growth in vivo (Boulay et al., 2018). This study showed a direct link between a unique GGAA microsatellite and EWS-FLI1 oncogenic transcriptional activity. In addition to their impact on transcription and chromatin, a few studies have suggested a role of FET-ETS fusion proteins in splicing regulation as I will discuss below (See Section II.D).
33 4. Ewing sarcoma phenocopy BRCA1-deficient tumors
Recently, it has been shown that aberrant transcriptional regulation induced by EWS-FLI1 fusion leads to R-loops accumulation (Gorthi et al., 2018). R-Loops are three-stranded nucleic acid structures including an RNA-DNA hybrid and a single-stranded DNA. In the human genome, R-loops accounts for 5 to 8% of the genome and influence many cellular processes (Chen et al., 2015; Sanz et al., 2016). Gorthi and colleagues have demonstrated that breast cancer type 1 susceptibility (BRCA1) gene, which is crucial for DNA damage response, seems to be partially inactivated in Ewing sarcoma (Gorthi et al., 2018). Indeed, BRCA1 is sequestrated at R-loops sites with transcription complexes leading to its partial inactivation. This study underlines the mechanism of Ewing sarcoma sensitivity to poly(ADP-ribose) polymerase (PARP) inhibitors (Brenner et al., 2012; Garnett et al., 2012; Gorthi et al., 2018). Overall, the study highlights an aberrant transcriptional activity in Ewing sarcoma leading to R-loops formation and BRCA1 sequestration resulting in impaired homologous recombination and promising therapeutic development.
5. EMT-like, plasticity and heterogeneity
Several research groups have shown that Ewing sarcoma cells can have a certain plasticity between epithelial to a more mesenchymal phenotype (Chaturvedi et al., 2012, 2014; Franzetti et al., 2017; Katschnig et al., 2017; Wiles et al., 2013). Ewing sarcoma is quite complex to classify between mesenchymal-like tumors, because of its origin, (such as osteosarcoma or chondrosarcoma) and epithelial-like tumors, because of its morphological aspect (such as synovial or epithelioid sarcomas). For instance, tight junction-related proteins such as claudin-1 and ZO-claudin-1 are expressed in Ewing sarcoma, whereas epithelial E-cadherin marker (CDHclaudin-1) is not (Schuetz et al., 2005).
34 To decipher this complexity, it has been recently suggested that Ewing sarcoma tumors reside in an intermediate state called “metastable” phenotype which allows tumor cells to acquire either epithelial or mesenchymal features (Sannino et al., 2017). This phenotype is associated with aggressiveness because cells exhibit features from both states and can adapt to tumor environment (Jolly et al., 2015). This plasticity observed in Ewing sarcoma cells is mostly mediated by fluctuations in EWS-FLI1 expression (Franzetti et al., 2017). These fluctuations in the master fusion oncoprotein allow cells to transiently acquire epithelial or mesenchymal features. Drastic transcriptomic and epigenetic reprogramming occur during this process, to allow cells to switch from a highly proliferative undifferentiated cell towards spindle-shaped cell with invasive properties. These observations suggest that there is a cooperation between (i) cells displaying high expression of EWS-FLI1, which are proliferative and contribute to tumor development and (ii) cells that have a low EWS-FLI1 expression, which migrate and potentiate metastatic seeding in vivo (Franzetti et al., 2017) (Figure 10). Nonetheless, EMT is not a binary process and it has been shown that intermediate states and transition fluctuations within this process are common features (Pastushenko et al., 2018). We hypothetized that Ewing sarcoma cells can have a certain plasticity according to the expression of EWS-FLI1. However, stochastic, cell-autonomous or non-cell autonomous mechanisms underlying this plasticity needs to be elucidated. In addition, the tumor microenvironment could play a crucial role in this cell-plasticity and needs to be investigated in this context.
35 Figure 10: Schematic mechanism of Ewing sarcoma dissemination based on EWS-FLI1 fluctuation. EWS-FLI1High cells have an undifferentiated phenotype, high proliferation rate and
strong cell-cell interaction, whereas EWS-FLI1Low cells have a mesenchymal-like phenotype
with increase migratory/invasive capacities and important cell-matrix interactions. From Franzetti et al., 2017.
In addition, Katschnig and colleagues have identified a molecular mechanism implicated in the downregulation of cytoskeleton genes. Genes of the Rho pathway tightly regulate cell cytoarchitecture. They have found that EWS-FLI1 inhibits activation of the Rho pathway genes by interfering with transcription activators MRTFB/TEAD (Katschnig et al., 2017). Authors suggested that this regulation is mediated by the AP-1 transcription factor family, which interacts with both TEAD and EWS-FLI1 (Kim et al., 2006; Liu et al., 2016; Zanconato et al., 2015). This study establishes a novel mechanism of cell morphology modulation by EWS-FLI1. In addition, analysis of these protein complexes could be central to understand the repressive transcriptional activity of EWS-FLI1 and to develop better strategies for metastasis treatment.
36 Moreover, Pedersen and colleagues have identified the Wnt/beta-catenin axis as an important pathway for Ewing sarcoma tumorigenicity (Pedersen et al., 2016). Despite low frequency of Wnt/beta-catenin mutations in Ewing tumors, they have found that Wnt pathway seems to be activated at diverse level and Wnt-activated tumors are more clinically aggressive. This heterogeneity could partially be mediated by LRG5 expression, which is restricted to a subset of Ewing tumors. Furthermore, Wnt activation leads to overexpression of metastasis-associated and pro-migratory genes, which are normally repressed by EWS-FLI1 (Pedersen et al., 2016).
According to this non-genetic heterogeneity, Sheffield and colleagues have recently shown that Ewing sarcoma DNA methylation profiles also exhibit heterogeneity. Indeed, clustering DNA methylation profiles of 140 Ewing tumors highlighted an Ewing-specific hypomethylation signature, which separated Ewing tumors from other cancer types (Sheffield et al., 2017). This is to put in relation with EWS-FLI1’s role on epigenomic reprogramming as we have seen previously. Moreover, Ewing tumors exhibited a high interindividual heterogeneity with a continuous spectrum of DNA methylation profiles. It would be interesting to correlate EWS-FLI1 expression to DNA methylation map to decipher epigenetic heterogeneity in Ewing sarcoma. Despite a silent genetic background, Ewing sarcoma shows a high intertumor epigenetic heterogeneity and is defined as a continuous disease spectrum.
37
II.
Alternative splicing
A. The basics of splicing and alternative splicing
1. Historic context
In the 70’s, Phillip Allen Sharp and Richard John Roberts identified a messenger RNA (mRNA), produced by an adenovirus, originates from four non-contiguous DNA segments (Berget et al., 1977; Chow et al., 1977). One year later, Walter Gilbert suggested to call these expressed sequences “exons”, which are separated by intragenic regions called “introns” (Gilbert, 1978). For this major breakthrough, the Nobel Prize in Physiology or Medicine 1993 was attributed to P. Sharp and R.J. Roberts. In the early 80’s, alternative splicing was revealed with the finding of distinct alternative transcripts of the immunoglobulin heavy locus (IGH) gene emerging from the same DNA region (Early et al., 1980). As detailed below, transcript splicing is a reaction consisting in the removal of introns and the ligation of exons. We now know that most mammalian coding genes, as well as many long non-coding genes have introns, and that alternative splicing occurs in about 95% of genes (Wang et al., 2008).
2. Biological function
Alternative Splicing (AS) is a biological process by which one single DNA sequence can generate structurally and functionally different mRNAs molecules. This process is highly prevalent in higher eukaryotes because it contributes to transcriptome (and proteome) diversity and complexity (Barbosa-Morais et al., 2012; Blencowe, 2006; Chen et al., 2014). Alternative splicing is widely regulated in a tissue-, cell type- and developmental-stage specific manner and plays an important role in various cell differentiation programs (Daguenet et al., 2015; Kalsotra and Cooper, 2011). In addition, alternative splicing tunes important cellular processes such as apoptosis (Schwerk and Schulze-Osthoff, 2005; Wu et al., 2003) and has been involved in all the cellular hallmarks of cancer (David and Manley, 2010; Oltean and Bates, 2014), as I will discuss below. At the molecular level, alternative splicing not only affects the protein encoded itself but can also reshape protein interaction networks (Figure 11) (Buljan et al., 2012).
38 Figure 11: Alternative splicing modify protein interaction networks. Alternative splicing can give rise to different isoforms composition, such as the skipping of an interacting protein segment, hence modiying its binding ability. Adapted from Buljan et al 2012.
3. Splicing in numbers
In the human genome, there are 9 exons per gene on average. Mean exon length is about 170bp compared to 5400bp for introns (more than 5% of introns are greater than 200 kbp!) (Sakharkar et al., 2004). These numbers highlight the challenge to coordinate the spliceosome assembly and to operate the splicing reaction. The number of distinct transcripts produced by human coding genes has been estimated to 200,000 (Harrow et al., 2012; Pertea, 2012). This represent more than six transcripts per gene even if the majority of protein coding genes have only one dominant transcript per gene in a given cell type and biological condition (Ezkurdia et al., 2015; Gonzàlez-Porta et al., 2013).
39 Over the past decade, the number of transcripts has kept increasing whereas the number of protein coding genes has decreased to around 22,000. Advances in next generation sequencing (NGS) have largely contributed to this phenomenon. In particular, third generation sequencing technologies, such as Pacbio and Nanopore, which allow sequencing of full-length mRNA molecules, overrode most algorithmic constraints on transcriptome reconstruction. In addition to the coding repertoire, many long non-coding RNAs (lncRNAs) are also alternatively spliced and are themselves implicated in the splicing regulation of coding proteins genes (Mattick and Makunin, 2006; Rinn and Chang, 2012).
4. Different types of alternative splicing events
Due to its complexity, alternative splicing can give rise to a large diversity of mRNAs (figure 12). There are at least six types of alternative splicing events: (i) skipped exon (SE) is the most common (and most commonly studied) in mammals: one or multiple exons are spliced-in or spliced-out, (ii) mutually exclusive exons (MXE): both exons cannot belong to the same transcript. If exon A is included, exon B is skipped and conversely, (iii) alternative 5’ splice site (A5SS), (iv) alternative 3’ splice site (A3SS), (v) intron retention (IR), which corresponds to the retention of a whole intron in the mature transcript. Most of the time, intron retention leads to a premature stop codon and degradation through nonsense-mediated decay (NMD) and (vi) alternative last exon (ALE), also called intronic polyadenylaton or splicing-dependent alternative polyadenylation (APA). It should be noted that in addition to alternative splicing, a large part of transcriptome diversity in Human corresponds to splicing-independent APA (APA within the last exon of genes) and to alternative first exons (AFE), the latter of which is due to alternative promoters and is thus related to transcriptional events (Pal et al., 2011; Reyes and Huber, 2018).
40 Figure 12: Five major events of alternative splicing. ALEs, which are less studied, are not represented..
B. Multiple layers of regulation
1. The core splicing signals
Intronic regions are extremely variable among Eukaryotes, but sequences located at the extremity of introns are highly conserved and are necessary for the spliceosome recognition. There are four sequences that are essential for the splicing reaction (Figure 13) (Breathnach and Chambon, 1981; Breathnach et al., 1978; Reed and Maniatis, 1985). The 5’ donor site, located at the exon|intron boundary, is composed of the consensus sequence CAG|GTRAGT. The most conserved sequence is the dinucleotide GT (Moore and Sharp, 1993). The 3’ acceptor site, located at the boundary intron|exon, is constituted of the sequence YAG|G. The branchpoint is more degenerated than other splice signals. The sequence YNYTRAY is located between 18 to 40 bases upstream the 3’ acceptor site. In addition to these sequences, intronic regions harbor a pyrimidine-rich sequence called the polypyrimidine tract (PPT). This region is located between the branchpoint and the 3’ acceptor site and is generally 10-20nt long.
41 Figure 13: Schematic overview of splicing sites composition.
2. Spliceosomal proteins
“The spliceosome: the most complex macromolecular machine in the cell” (Nielsen et al., 2003) Splicing is orchestrated by two spliceosome machineries: (i) the U2-dependent spliceosome that is necessary for the removal of U2-type introns, which account for 99% of splicing reactions and (ii) the U12-dependent spliceosome, which plays a role on the U12-type introns and is specific to a subset of eukaryotes (Patel and Steitz, 2003).
The spliceosome is a huge and highly dynamic machinery and is composed of RNA-protein complexes called small nuclear ribonucleoproteins (snRNPs). There are five types of snRNPs composed of five small nuclear RNAs (snRNAs): U1, U2, U4/U6 and U5; a common set of seven Sm proteins: B/B’, D3, D2, D1, E, F and G; and a number of other specialized proteins. Another non-snRNP complex is the Prp19 complex. In total, the spliceosome comprises more than 150 proteins such as RNA-Binding Proteins (RBPs), RNA helicases or phosphatases (Wahl et al., 2009) making it the most complex macromolecular machine in the cell (Jurica and Moore, 2003; Nilsen, 2003). In order to orchestrate such an enormous complex, spliceosome assembly has to be ordered and well regulated in a stepwise fashion (Will and Lührmann, 2011).
42 3. Spliceosome assembly
The first step of the spliceosome assembly is the recognition of the 5’ donor site by the snRNP U1. Non-snRNP factors U2AF65 and SF1 are recruited to the polypyrimidine tract and the branchpoint respectively (E complex) (Figure 14). Then, the A complex is formed by the binding of the snRNP U2 on the branchpoint site. The next step consists in the pre-assembly of three snRNP U4/U6 and U5 (B complex). Once this complex is associated to pre-mRNA, the subunits U1 and U4 are released and a conformational change occurs giving rise to an active spliceosome complex (B’ complex). Next, the 5’ splice site is cleaved by catalytic reaction generating the C complex. The second enzymatic reaction is processed, the 3’ splice site is cleaved, the intronic region (called “lariat”) is released and exon boundaries are ligated. Spliceosome is then disassembled and the Exon Junction Complex (EJC) is deposited upstream of the exon-exon junction. In addition, it has been shown that core spliceosome components affect splicing outcomes partially due to functional interactions with RBPs (Papasaikas et al., 2015).
Figure 14: Overview of the spliceosome machinery assembly. Abbreviations: 5’ splice site (5’SS); 3’ splice site (3’SS); branchpoint (BP). From Paschalis et al., 2018.
43 4. Splicing regulatory sequences
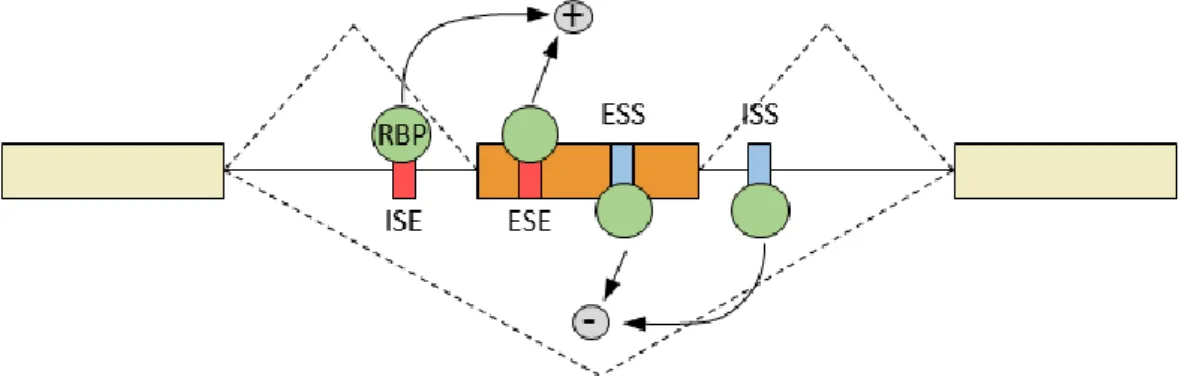
Alternative splicing is also regulated through intronic and exonic cis-acting regulatory elements (Figure 15) (Burd and Dreyfuss, 1994; Fairbrother et al., 2002; Wang et al., 2004). These sequences are directly associated to the regulation of alternative splicing through the binding of specific proteins called RNA-Binding Proteins (RBPs). These cis-regulatory elements are classified into four classes, depending on their localization and function: (i) Intronic Splicing Enhancer (ISE), (ii) Intronic Splicing Silencer (ISS), (iii) Exonic Splicing Enhancer (ESE) and (iv) Exonic Splicing Silencer (ESS).
Figure 15: Schematic model of splicing regulation through RBPs. Abbreviations: RNA-binding proteins (RBPs); exonic splicing enhancer (ESE); exonic splicing silencer (ESS); intronic splicing enhancer (ISE); intronic splicing silencer (ISS). Adapted from Kornblihtt et al., 2013.
5. RNA-binding proteins
RNA binding proteins (RBPs) affect alternative splicing decisions by binding enhancer/silencer sites and interacting with the core spliceosome components. Each RBP usually binds specific RNA motifs of about 4 to 6 nucleotides, which have been precisely mapped in the human transcriptome for more than one hundred RBPs using high-throughput sequencing of RNA isolated from crosslinking immunoprecipitation experiments (CLIP-seq) (Hafner et al., 2010; Licatalosi et al., 2008; Rossbach et al., 2014; Ule et al., 2005; Van Nostrand et al., 2016). RBP expression is tightly regulated, depending on the cellular context. Some RBPs are only expressed in a certain tissue type or depending on the developmental stage, consistent with the importance of alternative splicing on cell-type function and development.
44 6. Coupling transcription and splicing
The RNA polymerase II (POL2) transcribes genes as precursor-mRNAs (pre-mRNAs). Afterwards, these pre-mRNAs molecules are converted to mRNA by multiple post-transcriptional modifications consisting in the 5’ capping, the 3’ polyadenylation and the splicing of introns. Nearly all human genes are spliced and approximately 80% of splicing reactions occur on the nascent RNA (Girard et al., 2012; Wang et al., 2008). Transcription and splicing occur concomitantly, thereby POL2 plays an important role on splicing decision (Beyer and Osheim, 1988; Cramer et al., 2001; Roberts et al., 1998; Tennyson et al., 1995). In addition, POL2 is able to recruit splicing factors and RNA processing factors through its C-ter domain (Misteli and Spector, 1999). This domain, called carboxy-terminal domain (CTD), is a highly phosphorylated region, which is required for cotranscriptional splicing (Hirose et al., 1999; Zeng and Berget, 2000). Moreover, POL2 elongation rate can directly influence splicing changes. Splice site selection mostly occurs cotranscriptionnally and the RNA POL2 kinetic can influence splicing decision (Cramer et al., 1999; Kadener et al., 2001).
A model has been proposed in which a fast elongation rate results in a competition between multiple splice sites (weak and strong ones) leading to the skipping of the weaker exon (Figure 16). Whereas slowing down the RNA POL2 usually favors exon inclusion because only the first exon (weak) is already transcribed when the splicing machinery starts to operate (Cáceres and Kornblihtt, 2002; Kornblihtt, 2005; de la Mata et al., 2003). However, in some cases, slow elongation can favor RBP recruitement to a splicing silencer, thereby favoring exon skipping. (Dujardin et al., 2014).