arXiv:1401.2628v2 [astro-ph.SR] 14 Jan 2014
Astronomy & Astrophysicsmanuscript no. HR5171˙vRef˙vLANG c ESO 2014
March 11, 2014
The yellow hypergiant HR 5171 A: Resolving a massive interacting
binary in the common envelope phase
⋆
O. Chesneau
1, A. Meilland
1, E. Chapellier
1, F. Millour
1, A.M. Van Genderen
2, Y. Naz´e
3, N. Smith
4, A. Spang
1, J.V.
Smoker
5, L. Dessart
6, S. Kanaan
7, Ph. Bendjoya
1, M.W. Feast
8, J.H. Groh
9, A. Lobel
10, N. Nardetto
1, S. Otero
11, R.D.
Oudmaijer
12, A.G. Tekola
8,13, P.A. Whitelock
8, C. Arcos
7, M. Cur´e
7, and L. Vanzi
141 Laboratoire Lagrange, UMR7293, Univ. Nice Sophia-Antipolis, CNRS, Observatoire de la Cˆote d’Azur, 06300 Nice, France
e-mail: [email protected]
2 Leiden Observatory, Leiden University Postbus 9513, 2300RA Leiden, The Netherlands
3 FNRS, D´epartement AGO, Universit´e de Li`ege, All´ee du 6 Aoˆut 17, Bat. B5C, B-4000 Li`ege, Belgium 4 Steward Observatory, University of Arizona, 933 North Cherry Avenue, Tucson, AZ 85721, USA 5 European Southern Observatory, Alonso de Cordova 3107, Casilla 19001, Vitacura, Santiago 19, Chile
6 Aix Marseille Universit´e, CNRS, LAM (Laboratoire d’Astrophysique de Marseille) UMR 7326, 13388, Marseille, France 7 Departamento de F´ısica y Astronom´a, Universidad de Valpara´ıso, Chile
8 South African Astronomical Observatory, PO Box 9, 7935 Observatory, South Africa; Astronomy, Cosmology and Gravitation
Centre, Astronomy Department, University of Cape Town, 7700 Rondebosch, South Africa
9 Geneva Observatory, Geneva University, Chemin des Maillettes 51, 1290, Sauverny, Switzerland 10 Royal Observatory of Belgium, Ringlaan 3, 1180, Brussels, Belgium
11 American Association of Variable Star Observers, 49 Bay State Road, Cambridge, MA 02138, USA 12 School of Physics & Astronomy, University of Leeds, Woodhouse Lane, Leeds, LS2 9JT, UK 13 Las Cumbres Observatory Global Telescope Network, Goleta, CA, 93117, USA
14 Department of Electrical Engineering and Center of Astro Engineering, Pontificia Universidad Catolica de Chile, Av. Vicu˜na
Mackenna 4860 Santiago, Chile Received ;accepted
ABSTRACT
Context.Only a few stars are caught in the very brief and often crucial stages when they quickly traverse the Hertzsprung-Russell
diagram, and none has yet been spatially resolved in the mass transfer phase.
Aims.We initiated long-term optical interferometry monitoring of the diameters of massive and unstable yellow hypergiants (YHG)
with the goal of detecting both the long-term evolution of their radius and shorter term formation of a possible pseudo-photosphere related to proposed large mass-loss events.
Methods. We observed HR 5171 A with AMBER/VLTI. We also examined archival photometric data in the visual and near-IR
spanning more than 60 years, as well as sparse spectroscopic data.
Results.HR 5171 A exhibits a complex appearance. Our AMBER data reveal a surprisingly large star for a YHG R∗=1315±260R⊙
(or ∼6.1 AU) at the distance of 3.6±0.5kpc. The source is surrounded by an extended nebulosity, and these data also show a large level of asymmetry in the brightness distribution of the system, which we attribute to a newly discovered companion star located in front of the primary star. The companion’s signature is also detected in the visual photometry, which indicates an orbital period of Porb=1304±6d. Modeling the light curve with the NIGHTFALL program provides clear evidence that the system is a contact or
possibly over-contact eclipsing binary. A total current system mass of 39+40
−22M⊙and a high mass ratio q ≥10 is inferred for the system.
Conclusions.The low-mass companion of HR 5171 A is very close to the primary star that is embedded within its dense wind. Tight
constraints on the inclination and vsini of the primary are lacking, which prevents us from determining its influence precisely on the mass-loss phenomenon, but the system is probably experiencing a wind Roche-Lobe overflow. Depending on the amount of angular momentum that can be transferred to the stellar envelope, HR 5171 A may become a fast-rotating B[e]/Luminous Blue Variable (LBV)/Wolf-Rayet star. In any case, HR 5171 A highlights the possible importance of binaries for interpreting the unstable YHGs and for massive star evolution in general.
Key words.Techniques: high angular resolution; (Stars:) individual: HR 5171A, V382 Car; Stars: binaries: close; Stars: circumstellar matter; Stars: massive; Stars: mass-loss
1. Introduction
Yellow hypergiants (YHGs) are visually bright evolved sources that have extreme luminosities of log(L/L⊙) = 5.6-5.8, which
Send offprint requests to: O. Chesneau
⋆ Based on observations made with ESO telescopes at the La
Silla / Paranal Observatory under program ID 088.D-0129 and from Gemini/South Observatory under program GS-2011A-C-4.
exhibit episodes of strong mass loss (de Jager 1998; Oudmaijer et al. 2009; Nieuwenhuijzen et al. 2012). Owing to their large variability, both photometric and spectroscopic, and their spec-tacular spectral type evolution for some targets, these sources may deserve to be described as “Luminous Yellow Variables” in a similar manner to the so-called luminous blue variables (LBVs). About ten of these stars have been clearly identified in our Galaxy so far. In some cases, uncertainty in their
dis-tance estimation renders their classification as highly luminous sources difficult, and confusion may exist between classical yel-low supergiants (YSGs) and these more extreme yelyel-low hyper-giant (YHGs). Their spectra show many lines that originate in stellar winds and, in particular, the presence of the infrared Ca ii triplet, as well as infrared excess from dust (?). They also show an overabundance of Na that is supposed to provide indirect evi-dence of a post-red supergiant nature, because Na is produced in the Ne-Na cycle in the high-temperature core of red supergiants. Because of their transitory nature, YHGs provide a critical chal-lenge for evolutionary modeling, so they are of great interest for extragalactic studies (Neugent et al. 2012; Drout et al. 2012).
These stars are also subject to important activity that is characterized by time variations in the line profiles and strik-ing switches between emission and absorption in the 2.3µm CO bands (e.g., ρ Cas on the scale of months as reported in Gorlova et al. 2006). These violent changes are suggested to be the result of outbursts, which are caused by pulsations occurring during a period of instability. Occasionally or even permanently, the wind density is such that it may lead to the formation of a modest-to-strong pseudo-photosphere that might alter the star’s apparent position on the H-R diagram, as seen in Wolf-Rayet stars and LBVs. Smith et al. (2004) speculate that the YHGs might be the ‘missing LBVs’ in the HertzsprungRussell (HR) diagram, since their true surface temperature is masked by the screening of the wind.
The instability of YHGs has traditionally been attributed to the star having the first adiabatic index below 4/3, lead-ing to potentially strong pulsational activity (Stothers 2012; Nieuwenhuijzen & de Jager 1995). Lobel (2001) has provided the theoretical framework of the Ledoux’s stability integral < Γ1 > atmospheric stability criterion in cool massive stars.
Another possibility, not discussed thus far in the literature, is to invoke the additional influence of a companion star that may perturb a loosely bound envelope.
The evolution of such stars across the Herzprung-Russell (HR) diagram has so far been monitored thanks to photometric and spectroscopic data taken on a roughly annual basis. The ad-vent of routine optical interferometry in the southern and north-ern hemispheres presents an opportunity to monitor the evolu-tion of the angular diameter of the YHGs and also their blue counterparts, the luminous blue variables that experience the so-called S Doradus phase (Groh et al. 2009b). The large variations in the photometric characteristics and spectral type exhibited by these stars should have measurable consequences on their appar-ent diameters. In this paper, we focus our work on one source, HR 5171 A. We also observed the YSG V382 Car (HD 96918), which we used as a reference for the interferometric data on HR 5171 A, owing to their similar K-band magnitudes, 1.6 ver-sus 0.9 mag, respectively, and similar expected extension in the sky in the range of 2-3 mas.
HR 5171 A (V766 Cen, HD 119796, HIP 67261) is one of the first objects identified as YHG in our galaxy (Humphreys et al. 1971; Warren 1973; van Genderen 1992) with a spectral type between G8Ia+ and K3Ia+, but it remains a poorly stud-ied object. This star and its widely separated B0 Ib companion HR 5171 B, located 9.4” away, dominate the energy balance in their local environment, causing a large photodissociation region known as Gum48d (Karr et al. 2009; Schuster 2007). HR 5171 A lies in the center of the HII region and was most likely the dom-inant ionizing source until its recent post-main-sequence evolu-tion took place. It is not clear whether the companion is bound at such a large separation, yet given their apparently similar dis-tances, their isolated location on the sky, and their short
life-Fig. 1. UV coverage of the AMBER/VLTI observations. Red triangles
mean medium resolution mode and blue squares low-resolution mode.
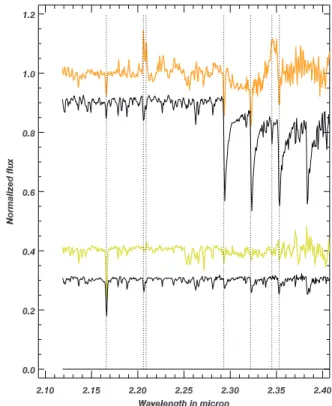
Fig. 2. AMBER/VLTI medium-resolution (R = 1500) K band spectra
of V382 Car (green line, level 0.4) and HR 5171 A (orange line level 1) compared to a G0Ib and a G8III template (levels 0.3 and 0.9, re-spectively). Note the striking NaI doublet at 2.2µm in the HR 5171 A spectrum.
time, it is probable that they both originate in the same molec-ular complex. The distance is reasonably well constrained by several independent estimates to be D = 3.6±0.5kpc (Karr et al. 2009; Schuster et al. 2006; van Genderen 1992; Humphreys et al. 1971). At such a large distance, the estimated luminosity is logL/L⊙∼5.7-6, making HR 5171 A as bright as the famous IRC+10420 (Driebe et al. 2009; Oudmaijer et al. 1996).
The cool temperature and the potentially high mass-loss rate of HR 5171 A have led to the formation of a complex circumstel-lar environment. It exhibits a circumstel-large infrared excess due to dust with a strong silicate absorption, although no scattered light was observed around HR 5171 A at visual wavelengths with deep HST images (Schuster et al. 2006).
Our AMBER/VLTI observations, described below, revealed the extremely interesting binary nature of HR 5171 A, which prompted us to thoroughly reinvestigate all published photomet-ric and spectroscopic datasets and to search for possible unpub-lished data. The analysis of such a large dataset cannot be ex-haustive so we focus here on establishing the binary nature of the source by investigating its spectral evolution and the com-plex mass-loss history documented by visual and near-infrared photometry and spectroscopy.
The paper is organized as follows. Section.2 describes the observations, consisting primarily of AMBER/VLTI observa-tions. This was complemented by archival optical and near-IR data, a few archival and recent spectra, together with a corona-graphic image of the source in the near-IR. Sections.3, 4 and 5 focus on the analysis of the near-IR interferometric, photomet-ric and spectroscopic data, respectively. Finally, in Sect. 6 we discuss the implications of discovering such a low-mass com-panion for the fate of this star, and the potential impact of still undiscovered companions in the yellow or red supergiant stages.
2. Observations
2.1. AMBER/VLTI interferometric observations
V382 Car and HR 5171 A were observed during 1.5 nights in March 2012 at the Paranal Observatory. The VLTI 1.8m auxil-iary telescopes (ATs) and the AMBER beam recombiner (Petrov et al. 2007) were used. On March 8 (JD = 2 455 994), ob-servations were carried out using the low spectral resolution mode (R=30) and providing a simultaneous record of the J, H, and K bands. On March 9 an additional half night of obser-vations was carried out in medium spectral mode (R=1500) centered at 2.3 µm and covering the 2.17 µm Brγ line and the 2.3-2.4 µm CO bands. All data were recorded using the FINITO fringe tracker that stabilizes optical path differences due to atmospheric turbulence. The fringe tracker allows using a longer exposure time and a significantly improves the signal-to-noise ratio and overall data quality. The stars HD 96566 (spec-tral type G8III, φ=1.50±0.04mas) and HD 116243 (spec(spec-tral type G6II, φ=1.37±0.04mas) were used as interferometric calibra-tors and their diameters obtained from the SearchCal soft-ware (Bonneau et al. 2006). The observations log is presented in Table A.1 and the (u, v) plan coverage for all targets is plot-ted in Fig. 1. We reduced the data using the standard AMBER data reduction software amdlib v3.0.3b1 (Tatulli et al. 2007; Chelli et al. 2009). The average raw complex visibility and clo-sure phase were determined using several selection criteria. The interferometric calibration was then performed using custom-made scripts described by Millour et al. (2008).
Medium resolution K-band spectra were obtained as a byproduct of the AMBER observations. These spectra are com-pared in Fig. 2 with two templates from the IRTF1 spectral li-brary (Rayner et al. 2009).
2.2. Optical photometry
The photometric observations of HR 5171 A are shown in Fig. 3 and the log of the observations together with some statistical information can be found in Table A.2.
The observations consist of several photometric data sets: a historical one gathered by van Genderen (1992), consisting
1 http://irtfweb.ifa.hawaii.edu/∼spex/IRTF Spectral Library/
of Johnson U BV and Walraven V BLUW photometry, three un-published V BLUW observations made in 1977 (JD 2443248.5, 2443252.5 and 2443269.5, Pel 2013, priv.comm.), Hipparcos (Hp) photometry retrieved from van Leeuwen et al. (1998), unpublished Stroemgren uvby photomery by the Long-Term Photometry of Variables group (LTPV) initiated by Sterken (1983), unpublished V-band photometry by Liller, unpublished ASAS-3 photometry (Pojmanski 2002), and recent unpublished V-band photometric observations from Otero. After correcting for the contribution of HR 5171 B, Liller’s V-band observations were made fainter by 0.39 mag to match the V scale. The reason is probably the use of a non standard filter.
Owing to the extremely red color of HR 5171 A and its high interstellar and circumstellar reddening, a transformation from the color index V − B (V BLUW) to the B − V of the standard U BV system is unreliable. It appeared that in order to match the B − V color indices obtained with a genuine UBV photometer, 0.1 mag should be added to the computed B − V (van Genderen 1992). No obvious difference was apparent between V(U BV) computed and V(U BV) obtained with an U BV photometer. To match the V(U BV) magnitude scale, the Hp magnitudes were corrected by adding 0.15 mag (van Leeuwen et al. 1998). The coincident overlap of part of the uvby time series with V BLUW and Hipparcos data allowed us to derive the following correc-tions: add -0.07 mag to y to get V(U BV), and add +0.72 mag to b − y to get B − V (U BV).
However, all these corrections should be considered with caution. The number of overlapping data points obtained in the different photometric systems is usually small. Additionally, the color dependence of transformation formulae and of the empir-ically derived corrections should not be underestimated due to the variable color of HR 5171 A.
The temporal sampling of Hipparcos measurements is very irregular. Therefore we averaged the measurements secured within the same day, thereby improving the resulting data ap-pearance. Until JD 2453000, the ASAS-3 light curve suffered from saturation and cannot be used with confidence, but after this date the scheduling of observations changed from a sin-gle three-minute exposure to three one-minute exposures. Stars as bright as sixth magnitude became unsaturated. The agree-ment with the visual photometry from Sebastian Otero is ex-cellent, illustrating the quality of these amateur observations. From the van Genderen data, we selected the densest subset from JD 2446500 to 2448315 during which the mean magnitude of HR 5171 A was relatively stable. The datasets that included the V = 10.01 mag companion 9.4”away were corrected so all the magnitudes correspond to the G8-K0 hypergiant without the contribution of the B0 supergiant.
The V-band data were complemented by B-band photometry as much as possible. Unfortunately, only sparse B-band obser-vations have been retrieved to complement the extensive dataset published in van Genderen (1992). We retrieved a single epoch of contemporaneous B and V-band measurements in the AAVSO archives (obs: G. Di Scala at JD = 2452456.09045).
We also searched for some historical measurements of the visual magnitude of HR 5171 A. The visual magnitude reported in 1875 by Gould (1879) is 6.8 mag, converted to V = 6.51 mag. This agrees with Thome (1932) who reports 7.0 mag, and with the photovisual magnitude of 6.23 mag from the Henry Draper catalog (Cannon 1936).
Fig. 3. Visual light curve spanning more than 60 yr. The colors are described in Table A.2. The low flux events are indicated named the Dean,
Sterken and Otero minima, which occurred in ∼1975, ∼1994, and ∼2000, respectively.
2.3. Infrared photometry
We present unpublished near-infrared (JHKL) data in Table A.2 and shown in Fig. 4. They were obtained from 1975 until the present with the MkII infrared photometer, through a 36” aper-ture, on the 0.75m telescope at the South African Astronomical Observatory (SAAO) at Sutherland. The magnitudes are on the SAAO system as defined by Carter (1990) and are accurate to ±0.03 mag at JHK and ±0.05 mag at L. No corrections have been applied for the contribution of HR 5171 B, which is mostly negligible. We also present some recent mid-IR data in Sect.D in the Appendix.
2.4. Spectroscopic data
Visual-wavelength spectra of HR 5171 A are unfortunately quite rare, although they can help characterize the spectral type of HR 5171 A and the vsin(i) of the primary star more precisely. High-resolution archival AAT/UCLES spectra taken in 1992 and 1994 were retrieved from the Anglo-Australian Telescope (AAT) archives2. They were taken with UCLES, a cross-dispersed Echelle spectrograph located at the coud´e focus of the AAT of-fering high resolution combined with good wavelength cover-age. The 31.6 lines/mm setting gives almost continuous wave-length coverage at bluer wavewave-lengths, with a short slit wave-length (6-15 arcsec). The data were reduced using IRAF. The quality of the wavelength calibration of the 1992 spectrum was tested using nearby observation of the star κ TrA and was compared with archival UVES/VLT data. The wavelength calibration of the 1994 data was more difficult to perform because no suit-able ThAr reference could be found in the archive. The 1992 UCLES/AAT spectrum covers the range 531-810nm, and the two 1994 spectra cover the range 457-697nm. The width of tel-luric lines has a minimum of 0.0168 nm at 687.8 nm, which is
2 http://apm5.ast.cam.ac.uk/arc-bin/wdb/aat database/observation log/make
about 7.3 km s−1, providing a lower limit to the instrumental
res-olution of R = 41000.
Low- and medium-resolution spectra were acquired at SAAO in 2013 with the Grating Spectrograph at the 1.9 m Radcliffe telescope. Several spectra centered at λ = 680nm were obtained with gratings 5 and 7 yielding a spectral resolution of about R = 1000 and R = 6000 over spectral bands of 370 and 80nm, respectively. The low-resolution spectra were calibrated with a CuAr lamp and the medium-resolution ones with a CuNe lamp. A standard star, LTT7379 (G0) was also observed to pro-vide accurate spectrophotometry3.
Radial-velocity monitoring of the source would provide cru-cial information about the binary. The only radial velocity data reported in the literature are from Balona (1982). The radial ve-locities were obtained by cross-correlating the spectra of several yellow super- and hypergiants with a G2II template (δ TrA) and he estimated his error to be 2.5 km s−1. Thirty-eight spectra of
HR 5171 A were secured over 837 days, between JD=2443940 (March 7, 1979) and 2444777 (June 21, 1981). Balona (1982) reports a strong peak at a period of 263.2 d, and a radial velocity variation of ∼9km s−1.
We initiated spectral monitoring with Pucheros (Vanzi et al. 2012), an optical spectrograph of the Pontificia Universidad Catolica de Chile (PUC). It is a fiber-fed echelle that provides spectral resolution R = 20,000 in the visible (390-730 nm) and a radial velocity accuracy of 0.1km s−1. The instrument is
in-stalled at the 50 cm telescope of the PUC Observatory located near Santiago, Chile (altitude of 1450m). The first observations were executed on April 11, 2013. Five spectra were taken, each one with 20 min of integration time, providing a combined spec-trum with S/N of about 200.
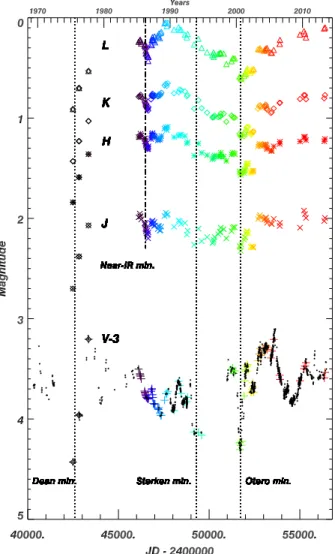
Fig. 4. SAAO IR J, H, K, and L light curves compared to the
near-est observations in the V band (the full dataset is shown as small dots). The visual magnitude of HR 5171 A is shifted by 3 magnitudes for the sake of clarity. Remarkable flux minima are indicated.
2.5. NICI/Gemini South coronagraphic observations
Observations of HR 5171 A were performed with the NICI im-ager (Chun et al. 2008) on the Gemini South telescope in February 2011 under program ID GS-2011A-C-4 (P.I. N. Smith). The dataset consists of a series of 0.4s and 7.6s coronagraphic exposures with filters probing the narrow K-band continuum (Kcont G0710, 2.2718µm, ∆λ =1.55%) and the [Fe ii] line in the H-band (FeII G0712, 1.644µm, ∆λ =1.55%). The Focal Mask F0.9” (G5711) was used. The mask is completely opaque with a minimum transmission of about one part in 300. Stars cen-tered below the mask are therefore dimmed by approximately 6.2 magnitudes.
3. Fitting by geometrical models
We analyzed the AMBER data with the LITpro software and our own routine fitOmatic (described in the next section and also in Millour et al. 2009). The two packages yield identical re-sults for V382 Car. Both show that the source is best described as a simple uniform disk (UD) model with a diameter of 2.29 mas and an internal accuracy of 5% (reduced χ2=3.4). We did not
dis-card the noisier J band data in the analysis, since it provides
im-portant information at higher angular resolution. We performed some tests on the presence of diffuse extended emission, or of the existence of asymmetries in the data. The V382 Car data are compatible with the absence of such emission down to the 6% flux (accuracy limit) and an elongation greater than 0.5% is also excluded. In Fig. 5 (left), we show an illustration of the data fit with our best UD model, which can later be compared with HR 5171 A (right). The interferometric observations indicate a lack of significant emission around the star. This can be under-stood if V382 Car is a normal YSG rather than a more extreme YHG, since a significant contribution from the wind would be expected around a YHG. This classification is also consistent with its lack of infrared excess.
The HR 5171 A AMBER dataset shows clear differences compared to V382 Car.
– First, the source is larger in angular size, indicated by the systematically lower visibilities at the same spatial frequen-cies.
– Second, the visibilities at various spatial frequencies deviate strongly from the expected shape of a UD.
– Third, a closure phase signal is observed rising at high spatial frequencies.
– Fourth, all visibilities and closure phases show significant variations with wavelength, which are correlated with spec-tral features, particularly at the end of the K-band owing to the CO first-overtone absorption bands. The source is much more extended at these wavelengths due to increased opacity from a thick CO nebula.
The medium-resolution data reinforce this view of complex and spectrally rich information in the dispersed visibilities and phases. These data are shown and discussed more extensively in the appendix (Sect.B). To exploit this spectrally rich dataset, we used our software fitOmatic, a general-purpose model-fitting tool for optical long-baseline interferometry. In fitOmatic, the gradient descent algorithm is taken directly from LITpro. The main difference with the publicly available tool LITpro is the use of wavelength-dependent parameters and a global op-timization method inspired by simulated annealing algorithms. These two additions allow some flexibility in the fitting process when dealing with chromatic variations, as in HR 5171 A. With fitOmatic, we test for the effect of wavelength-dependent flux ratios between the different geometrical models used.
We first tried to fit the HR 5171 A data with simple models such as a UD or a Gaussian Disk (GD) with a varying radius as a function of wavelength. Both fits were of poor quality, provid-ing inconsistent variations in the parameters with wavelength. A fit with a uniform disk plus a Gaussian Disk, with wavelength-invariant diameters, but with varying flux ratios provided quali-tatively better results for the visibilities, though the quality of the fit remained poor because none of these spherical models could by construction account for the smoothly varying closure phase as a function of spatial frequencies, which indicates an asym-metric source.
We incorporated this asymmetry in our models by adding an offset point source with a mean flux fraction that converged to about 12% of the total flux at 2.1µm. Allowing this point source to be resolved (modeled as a UD) marginally improved the result of the fit but the angular resolution is insufficient to provide tight constraints on the secondary diameter apart from an upper limit. Table 1 lists all the models tested together with the reduced χ2
value obtained.
Therefore, our best interpretation of this dataset (see Fig. 5) provides a uniform disk diameter for the primary of 3.39±0.2
0.01 0.1 1.0 −10 0 10 −2 0 2 0 200 400 −10 0 10 V 2 Clos. φ (rad) Sp. Freq. (cycles/arcsec.) V 2 Clos. φ (rad) Sp. Freq. (cycles/arcsec.) V 2 Clos. φ (rad) Sp. Freq. (cycles/arcsec.) Res. ( σ ) Res. ( σ ) Sp. Freq. (cycles/arcsec.) 0.001 0.01 0.1 1.0 −10 0 10 −2 0 2 0 200 400 −10 0 10 V 2 Clos. φ (rad) Sp. Freq. (cycles/arcsec.) V 2 Clos. φ (rad) Sp. Freq. (cycles/arcsec.) V 2 Clos. φ (rad) Sp. Freq. (cycles/arcsec.) Res. ( σ ) Res. ( σ ) Sp. Freq. (cycles/arcsec.)
Fig. 5. The AMBER/VLTI datasets of V382 Car (left panel) and HR 5171 A (right panel). For each star, the top panel shows squared visibilities in
log-scale versus spatial frequencies. Red, green, and blue represent data points dispersed in the K, H, and J bands, respectively. The residuals are shown below with ±3 sigma indicated as dashed horizontal lines. The bottom panel shows the closure phases versus the spatial frequencies of the largest of the 3 baselines involved. The best geometrical models are shown as thick and black solid lines.
mas (12.6±0.5 AU for a distance D=3.6 kpc), surrounded by an extended envelope with a Gaussian full width at half maximum (FWHM) of 4.76±0.2 mas (17±0.7 AU) in the continuum. The close companion is visible in the limb of the primary, separated from the center by 1.45±0.07 mas (5.15±0.25 AU), and its flux ratio is 12 ± 3% (2.3 mag) of the total flux at 2.1µm(see the model appearance at various wavelengths in Fig.6). The sec-ondary in the model would be smaller than ∼2.0 mas in diam-eter, but this parameter is weakly constrained with our restricted uv coverage4.
Assuming that the source is indeed described well by three components (i) (i.e. the uniform disk, the Gaussian disk and the offset point source with achromatic sizes and positions), one can analyze their relative fluxes Cithat were fitted for each indepen-dent spectral channel. Once these relative fluxes Ci have been obtained, it is straightforward to get the spectrum Si of each component:
Si= CiS⋆
Pn
j=1Cj
where S⋆is the total flux (i.e. the spectrum of the source). We ex-tracted the spectra of the three geometrical components relative to the normalized total flux and discuss the results in Sect.6.1
4. Photometry
The detection of a companion passing in front of the primary prompted us to re-investigate the archival visual light curve of this bright star. HR 5171 A exhibits complex variations in the visible, as shown in Fig.3. The multicolor photometry was ex-tensively described in several studies and, in particular, in van Genderen (1992). A large multicolor dataset has also been gath-ered from the blue to the near-IR, see Sect. 4.2.
4 Baselines longer than 150m are clearly needed.
N E 1.30µm −15 −10 −5 0 5 10 15 N E 1.70µm N E 2.10µm −15 −10 −5 0 5 10 15 −15 −10 −5 0 5 10 15 N E 2.50µm −15 −10 −5 0 5 10 15 0 200 400 600 800 1e+03 0 200 400 600 800 1e+03 0 200 400 600 800 1e+03 0 200 400 600 800 1e+03 α (mas) α (mas) δ (mas) δ (mas)
Fig. 6. Interpretation of the near-IR AMBER/VLTI interferometric data
using a set of three geometrical models. The best model of the emitting source consists in a primary photospheric disk represented by a uniform disk with a radius of 1.7 mas, a circumstellar environment represented by a Gaussian with FWHM of 4.8 mas, and an unresolved companion represented as a point source located at a projected distance of 1.45 mas from the center of the primary. The relative fluxes are determined for each spectral channel, representing for instance at 2.1µm 58/30/12% for the primary, circumstellar environment, and secondary, respectively.
4.1. Light curve analysis
A statistical analysis of the full visual curve yields a mean at V=6.54 mag and a rms of 0.23 mag. However, this result de-pends on the period of observations, and we also performed the same analysis for each dataset. The results are shown in Table A.2. This simple statistical analysis is important because it reveals several periods lasting several years of either relative
Geometrical Achromatic Flux ratio in percent Reduced model parameters 1.65 µm 2.10 µm 2.33 µm χ2 UD+GD 3.67/4.65 mas 80/20 % 50/50 % 35/65% 30 UD+GD 3.39/4.76 mas 58/35/7 % 58/33/9 % 30/62/8 % 8.6 +offset PS ρ:1.45 mas, θ=-121◦ UD+GD 3.39/4.76 mas 57/34/9 % 58/30/12 % 29/60/11 % 8.2 ρ:1.45 mas, θ=-121◦ +offset UD 1.8 mas
Table 1. The different sets of geometrical-models compared to the HR 5171 A AMBER/VLTI dataset. UD, GD and PS stand for uniform disk,
Gaussian disk and point source, respectively. ρ and θ stand for the separation and position angle of the secondary, respectively. The wavelength-dependent parameters are provided for three selected wavelengths and the achromatic parameters (UD diameter, GD FWHM, and PS position) are presented separately.
quietness or enhanced activities. One can identify several min-ima, which we called the Dean (∼2442584, ∼1975), Sterken (∼2449330, ∼1993), and Otero (∼2451800, ∼2000) minima, separated by ∼6716d and ∼2470d, respectively. These minima are all characterized by a magnitude increase to 7.5, 7.2, and 7.3 mag for the Dean, Sterken, and Otero minima, respectively. The minima lasted about one year but seem to be followed by longer changes, an interpretation supported by the temporal be-havior of the colors (Fig. 7, discussed in Sect.4.2). A bright-ness peak was observed a few years after the Dean and Otero minima, reaching a magnitude of 6.1-6.2 mag. The recent years probed by the ASAS and Otero observations (2000-2013) show that HR 5171 A was more active by a factor ∼2 compared to the periods between 1950 and 1970 (Table A.2), and also between 1980 and 1992 that appear relatively stable by contrast.
The near-IR light curves shown in Fig. 4 provide a clarifi-cation of the V-band photometric behavior. The Dean minimum is very deep and observed in each band, from V to L, sugges-tive of a cooling of the envelope or/and an important optically thick ejection of material in the line of sight. The Otero mini-mum is less marked, but the imprint of the event can be seen in the J, H, K, and L bands as a sudden 0.2 mag decrease in magnitude. The Sterken minimum is only noticeable in the in-frared by a small decrease in the flux (∼0.1mag) followed by a rapid return to the the previous level. We also note that the in-frared data suggest at least one minimum in addition to the three described above5An important decrease of the near-IR fluxes
appeared around JD∼2446500 (1986), an event (called ’near-IR minimum’ in Fig. 4) associated with a surprisingly weak V min-imum.
A long-term evolution on the scale of several thousand days is observed. The decrease in the V-band flux between 1980 and 2000 (see Figs. 3 and 4) is probably observed H, K, and L bands, more significant between 1990 and 2000, but the lack of obser-vations between Sterken and Otero minima prevents a definite answer. An anticorrelation would suggest a varying column den-sity of dust in the line-of-sight causing absorption in the V band and excess emission in the L band. The J-band photometry ex-hibits smaller variations with rms of 0.1 mag compared to rms of 0.15 mag in K and L, and larger than 0.2 mag in the V band.
Turning to the earliest data recorded between 1953 and 1966, we note that the rms of V-band magnitudes reported in Table A.2 is only 0.1 mag, as low as from Hipparcos. These two time inter-vals are relatively very quiet, unlike the current epoch when the source is more active (rms larger than 0.2 mag in the V band).
5 There might be many much less striking peaks, but is impossible to
localize them with this limited dataset.
4.2. Color analysis
The time evolution of near-IR and visible colors indexes is shown in Fig.7. The near-IR colors were computed from the self-consistent SAAO dataset. The V − K were computed by selecting several subsets of the visual and K-band curves obtained at sim-ilar epochs and interpolating. The B − V dataset is self consis-tent, mainly coming from the dataset reported in van Genderen (1992). We also constructed two near-IR color-color-diagrams, (H-K) versus (J-H) and (K-L) versus (J-K), that are shown in Fig. D.1 and briefly discussed in Sect.D.
The mean color are < V − K >=5.78±0.028 mag, < J − H >=0.80±0.090 mag, < H − K >=0.40±0.027 mag, and < K − L >=0.59±0.039 mag. While the V-band curve appears complex and seemingly erratic, the colors show a much more coherent behavior. One can see in Fig.7 that V − K, H − K, K − L and J − H vary with time in the same manner. The high rms for the V − K curve probably reflects the importance of the screening by dusty material in the line of sight. The rms is minimal for J − H and then increases for K − L.
During the Dean minimum, all color indices were very red. Thereafter HR 5171 A became bluer until the high light maxi-mum at JD∼2443300 (the V − K, H − K, K − L, and J − H are at that time the bluest of all data points, until now). Then be-tween 1985-1993 the reddening increased, after which the color indices became bluer again following the Sterken mimimum and lasting until 2000. However, a causal connection between these two phenomena is uncertain. The Otero minimum seems to be followed by a period of decreased reddening lasting up to the present.
In this context, the B − V presented in Fig.7 gives an im-portant insight. The B − V dataset covers more than 60 yr of data, and a roughly monotonic temporal evolution is observed that contrasts with the evolution of the other colors. The curve can be separated into two main periods: a gradual increase from 1942 to 1982 from B − V∼1.8 to B − V∼2.6, then an apparent stabilization, although measurements are unfortunately missing between 1990 and 2010. We also found in Fallon (1983) and in Jackson & Stoy (1958) two B − V indices of 1.8 and 1.85 ob-tained in 1942.29 and 1946.5, respectively, which prolong the observed trend (diamonds in Fig. 7). The curve suggests a deep-seated phenomenon that can be interpreted in two ways: a spec-tral type change or a large variation in the circumstellar extinc-tion. The curve can be compared with the one shown in Fig. 11 of Nieuwenhuijzen et al. (2012) which exhibits a similar change in the B-V for the YHG HR 8752 but in the opposite direction. This important evolution of B − V is not accompanied by an increase in the V-band magnitude as would be expected for increasing circumstellar extinction. Assuming the classical relationship be-tween B − V and AV with a factor R=3.1, a similar trend should
be accompanied by a V magnitude increase of at least 2.2 mag, which is not observed. It also appears that the 1942-1966 light and color curves are more stable than observed subsequently (see statistics in Table A.2). The long-term trend of a B − V in-crease stops apparently around 1982 and then stabilizes around B − V=2.6 mag for at least 10 yr, and this is approximately the current value. Interestingly, the Dean minimum, which appeared as one of the key events of the past 40 yr, has a much lower impact on B − V than the long-term trend. It reinforces our inter-pretation that the cause of the gradual B − V evolution is related more to a gradual change in the underlying star than a variation in the reddening, even though it is certain that the circumstellar material also has strong effects on the color curves that cannot be ignored (see Sect. 5.3 and Sect. 6.2). Attributing the full ampli-tude of the phenomenon (i.e. ∆ < B−V >=0.8 mag) to a spectral type change implies a significant change of spectral type, from G0/G2 to K1/K3. This information is very important in the con-text of the binary system evolution if one considers that such a large spectral type change implies an increase (nearly a dou-bling!) in the radius of the primary star (Nieuwenhuijzen, Van Genderen et al., in preparation). In this context, one can hypothe-size that the relative stability of the V-band magnitudes observed in the 1950s and 60s is a consequence of the smaller diameter of the primary, hence its lower sensitivity to the influence of the orbiting companion.
4.3. Detection of a periodic signal in theVband and the radial velocities
We performed a Fourier analysis of the visual photometry aim-ing to detect a potential periodical signal. The different sets were analyzed separately with the Period046package (Lenz & Breger 2005).
We first used data from the ‘quiet’ period ranging between 1985 and 1992, which have a good temporal coverage and are of good quality. A clear peak at a frequency of 0.001522d−1
(P1=657 d) was detected first in the Hipparcos dataset (see
Fig.8) with an amplitude a=0.126 mag. For each detected fre-quency, the amplitude and the phase were calculated by a least-squares sine fit. We then enlarged the dataset to include the period of relatively quiet behavior between the Dean and the Sterken minima (i.e. JD 2443240-2448966). This analysis pro-vides a peak at frequency 0.00152433d−1 determined with an
accuracy of about 2% (corresponding to P1=656±13d).
Photometry from recent years, including ASAS and Otero data, exhibits more active behavior compared to the Hipparcos dataset. The Fourier transform of the ASAS data yields a strong peak at f∼0.00038d−1 (P∼3300d, a=0.246 mag) that affects an
accurate determination of the peaks that are present nearby. Three peaks are also identified at f=0.001542d−1(a=0.074 mag),
f=0.00102d−1(a=0.0393 mag), and f=0.02751 (a=0.0372 mag).
We imposed the f=0.0015d−1 frequency in these data set and fitted the residuals with a little series of sinusoids. Then we came back to the original observations and prewhitened them with these sinusoids. The residuals correspond to the cleaned observations. This prewhitening yields a specific peak around F∼0.0015d−1with an amplitude of a=0.122 mag, similar to the
one found in the 1985-1992 dataset.
It was noticed that if the light curve is phased with the P1 period, an important residual remains at the phases of
ob-served lowest fluxes. This behavior is particularly clear in the Hipparcos dataset where the first dip appears lower than the
6 http://www.univie.ac.at/tops/Period04/
Fig. 7. Temporal evolution of HR 5171 A in several colors. The color
coding for the curves involving near-IR data is the same as in Fig. 4. The B−V coming from a different dataset are shown separately, together with the corresponding B and V magnitudes. They witness a long-term trend that seems independent of any reddening variation.
second one. A careful inspection of the Fourier diagrams re-vealed a half frequency peak. Phasing the data with the fre-quency f=0.000761d−1(P0=1314d) improves considerably the
quality of the fit that exhibits a striking ’double-wave’ pattern showed in Fig.8. The phased light curve is reminiscent of an
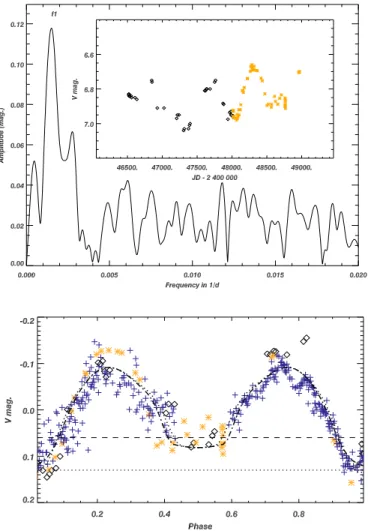
Fig. 8. Top panel Density power from the Fourier transform of a
sub-set of the visual light curve used for the first search of periodical sig-nal. The dataset used, between the Dean and Sterken minima, is shown as an inset with the following label: Van Genderen data in black di-amonds, Hipparcos data in orange stars. Bottom panel Phased light curves compared with two NIGHTFALL models. In addition to the Van Genderen and Hipparcos data (i.e., the most easily prewhitened), the ASAS dataset is shown as blue crosses. The dashed horizontal lines are indicative of the deepest level of the primary and secondary eclipses, at 0.13 and 0.06 magnitudes, with eclipse depth 0.21 and 0.14 magni-tudes, respectively. The best 1 and best 2 models are indicated as dotted and dash-dotted curves, respectively.
eclipsing system in contact or overcontact (Wilson 1994), in line with the finding of the interferometric observations that the source is seen in front of the primary. In this case, it is expected that the strong peak detected (namely P1) corresponds to half the
orbital period Porband hereafter we will consider that P0=Porb. One may wonder whether the P1period originates in a slow
pulsation and not from the companion. In many pulsating stars, the amplitude of the pulsation depends on the wavelength. If the P1 period were associated to a pulsation we should detect this
frequency dependence in our B − V data. When the V data are fully or partly analyzed, a frequency peak close to 0.0015 with an amplitude between 0.1 and 0.12 mag is systematically detected. As a test, such an analysis was performed on the B − V data. While present in the V and B datasets, the 0.0015 frequency is missing in the color index data.
The 38 radial velocities published by Balona (1982) cover 1190 days. Structured variations that are significantly larger than
the noise were observed, and the author reports the discovery of a strong peak at a period of 263.2 days (f=0.003799 d−1) from
the dataset. We performed a Fourier analysis with Period04 that revealed the presence of two peaks of similar amplitudes at f=0.003789 d−1 and 0.001467 d−1, the latter one
correspond-ing to a period P∼682 days, close to P1. Least squares fits gave
K=3.87km s−1 and K=3.96km s−1 for the amplitudes of the two
peaks, respectively, so our analysis suggests that a radial velocity signal with a period similar to the one inferred from the visual light curve. In any case, the radial velocities variations imply that the companion has a low mass compared to the primary or that the inclination of the system is very low, although the latter hypothesis is inconsistent with the detection of eclipses.
By comparing the date of the zero point of the radial velocities with the minimum of the Hipparcos light curve (JD=2447335±40), we improved the precision on the period slightly. We obtained a value P1=652±3 d, corresponding to an
orbital period Porb=1304±6d. It is worth noting that the peak corresponding to a period of 263d detected by Balona (1982) represents one fifth of Porb. In addition, van Genderen (1992) identified two periods in their photometric data: a 430d period during the relatively quiet epochs ranging from 1969 to 1972 (before the Dean minimum), and then a 494 d period afterward. These periods were obtained by identifying extrema in the com-plex and active light curves, and they are affected by uncertain-ties potentially as large as 30d. The harmonic at one third of Porb has a period of 435d.
The inferred ephemeris with Porb=1304±6d days is given by Φ = 0.5 + (JD − 2448000)/Porb
.
The light curves covering six orbital periods were used to test the phasing of the variations. First, a secondary eclipse at phase Φ =0.5, when the slightly hotter secondary is in front of the primary, occurred during the Hipparcos observations at JD=2448029±30. Second, the AMBER observations represent a reference point where the secondary is observed at the begin-ning or the end of the secondary eclipse, hence observed near phase Φ ∼0.4 or Φ ∼0.6 (see Fig. 8). Using this ephemeris, the AMBER observations were made at phase 0.63±0.04, i.e., at the end of the secondary eclipse. Third, we used the ephemeris to test and predict the latest maxima of the visual light curve. Some maxima were identified, but this technique remains highly un-certain since the light curve is currently severely affected by the activity of the primary.
4.4. Modeling of the light curve
From the phased light curve shown in Fig.8, one can infer that the distorted surface of the supergiant modulates the visible flux by 17 ±5%, and from the mid-period eclipse the contribution of the companion is estimated to be about 7 ± 2% of the vis-ible flux. This flux contrast is close to the one inferred in the near-IR by the AMBER/VLTI observation. The emissivity of the companion is greater than that of the primary, indicating a hot-ter star. Under the assumption that the emissive surfaces in the visible and near-IR are rather similar, this implies that the com-panion surface temperature is only hotter by 150-400K than the primary star’s temperature of 3500-4500K. We also note that the secondary eclipse, when the secondary passes in front, is long, about 0.15P0, implying a strong inclination for the system.
As a consistency check, we performed an independent anal-ysis based solely on the phased light curve with the NIGHTFALL
code7. This software (Wichmann 2011) is based on a general-ized Wilson-Devinney method assuming a standard Roche ge-ometry. NIGHTFALL is based on a physical model that takes the non-spherical shape of stars in close binary systems into account, as well as mutual irradiance of both stars, and it can handle a wide range of configurations including overcontact systems. We performed a fit of the light curve by minimizing the free parame-ters and exploring the various solutions found. We first assumed a circular orbit and fixed the period to P0(i.e., 1333d). We then
used various sets of initial parameters such as a strong inclina-tion (from 45◦ up to 90◦), a total mass for the system ranging from 30 to 120 M⊙ and an identical initial temperature for the two stars of 4000K. Regardless of the total mass adopted, the results are very similar. The lower mass range is only compat-ible with large inclinations while a wider range of inclination accounts for the light curve with a mass around 120M⊙. The full set of solutions favors a primary with a large radius (i.e. ≥1000R⊙) in contact or over-contact with the secondary, involv-ing a fillinvolv-ing factor ranginvolv-ing from 0.99 to 1.04. Two examples of good models are shown in Fig. 8 and their parameters are listed in Table 2. The inferred properties for the primary and secondary are fully consistent with the limits imposed by AMBER/VLTI measurements. The lower inclinations close to 45◦ yield mass ratios q between 0.8 and 0.5 and a large temperature difference for the two components (Tsec/Tprim ≥ 2). However, such mod-els predict radial velocities for the primary larger than 20km s−1
which are not compatible with the observed range of variations, which is less than 10km s−1 ˙Furthermore, a long-duration
sec-ondary eclipse with a plateau is clearly observed in the phased curve, despite the limited S/N, favoring the interpretation with a large inclination. If one includes the constraint from the interfer-ometric measurements that the secondary must have a radius at most one third of the primary, then a restricted range of param-eters is found. A family of good models involves a high inclina-tion (i≥60◦), a large mass ratio (q ≥12), and a low-temperature difference between the primary and the secondary (∼300K).
Improved constraints on the system parameters would re-quire more complete radial velocity monitoring, and we advo-cate coupled interferometric and radial velocity monitoring in the future. The NIGHTFALL modeling of the phased visual light curve is consistent with the information provided by the interfer-ometric observations, giving further confidence on the interpre-tation that the system is a contact or over-contact binary.
5. Spectral analysis 5.1. Spectral type
The determination of an accurate spectral type using photomet-ric data for such a variable and reddened object is difficult. The first published spectral classification of HR 5171 A was reported by Humphreys et al. (1971) to be G8Ia+, but that was corrected by Keenan & Pitts (1980) to K0Ia+. The spectrum of HR 5171 A was extensively studied by Warren (1973), providing the first ac-curate determination of the effective temperature, Te f f=4900K. None of the AAT and 2013 SAAO spectra mentioned above showed any TiO lines. The AAT spectra secured between 1992 and 1994 are nearly identical. A comparison with Kurucz mod-els yields a best match with log(g) = 0 and Te f f=5000 K for both spectra. The spectra were also compared to templates providing similar results. We include representative wavelength regions in Fig.9.
7 http://www.hs.uni-hamburg.de/DE/Ins/Per/Wichmann/Nightfall.html
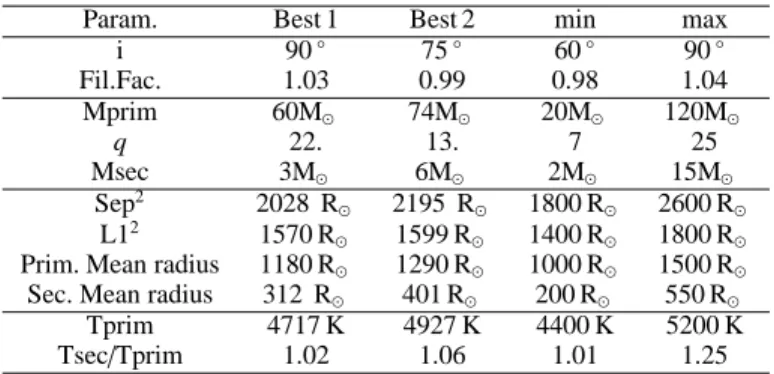
Table 2. Parameter space for the best NIGHTFALL models. The period
P0=1333d is fixed.
Param. Best 1 Best 2 min max
i 90◦ 75◦ 60◦ 90◦ Fil.Fac. 1.03 0.99 0.98 1.04 Mprim 60M⊙ 74M⊙ 20M⊙ 120M⊙ q 22. 13. 7 25 Msec 3M⊙ 6M⊙ 2M⊙ 15M⊙ Sep2 2028 R ⊙ 2195 R⊙ 1800 R⊙ 2600 R⊙ L12 1570 R ⊙ 1599 R⊙ 1400 R⊙ 1800 R⊙
Prim. Mean radius 1180 R⊙ 1290 R⊙ 1000 R⊙ 1500 R⊙
Sec. Mean radius 312 R⊙ 401 R⊙ 200 R⊙ 550 R⊙
Tprim 4717 K 4927 K 4400 K 5200 K
Tsec/Tprim 1.02 1.06 1.01 1.25
1 Separation of the components (circular orbit assumed). 2 Position of first Lagrangian point, from primary center
5.2. Rotational velocity
Thanks to the high spectral resolution of his spectra, Warren (1973) noticed that the lines are much broader (50-100km s−1) than in an ordinary supergiant (∼8km s−1). The stellar lines in
the AAT spectra are obviously resolved well. A simple Gaussian fitting procedure performed on several lines including the Fe I lines around 600nm (such as 606.5nm) provides FWHM esti-mates of 49±9km s−1.
However, hypergiant spectra exhibit broad absorption lines attributed to large scale turbulence motion that may reach super-sonic velocities while the stellar rotational broadening is con-sidered small (Lobel et al. 2003; de Jager 1998). The discovery of a close-by companion raises a question about on whether the broadening in HR 5171 A has a rotational or turbulent origin.
We therefore performed a Fourier transform (FT) anal-ysis, following standard techniques (Gray 1992). This tech-nique is considered a robust way to disentangle Doppler broadening from other sources. From this analysis, values of vsini=57±15km s−1were estimated from these lines, the large
error bar reflecting the rms of the measurements (the S/N of the AAT spectra is about ∼100). A value of 50km s−1, interpreted
as the vsin(i) Doppler velocity at the uniform disk radius in-ferred from the AMBER observations would imply a period of P/sin(i)=1326 days, in fair agreement with our detected period and derivation of a large inclination. The same technique applied to the Pucheros spectra at slightly lower resolution but higher S/N (∼200) provide less scattered results with a mean value of vsin(i)=40±4km s−1. Nonetheless, Sim´on-D´ıaz et al. (2010)
showed that the determination of the vsin(i) by the FT tech-nique is subject to important biases when the macroturbulence is significantly greater than the vsini. We used the unblended Fe I 557.2nm line as a good indicator of variable wind opacity to perform a comparison of the AAT spectrum of HR 5171 A with a spectrum from ρ Cas and HR 8752. HR 5171 A appears as spectroscopically very similar to these other extreme stars, rais-ing doubt about our analysis. It is therefore very difficult to in-fer this key quantity from spectroscopy alone. Important is that AMBER/VLTI is able to detect this rotation in the differential phases without being biased by the pulsation signal (Domiciano de Souza et al. 2004; Chelli & Petrov 1995), provided that the source vsin(i) is larger than 20 - 30km s−1 (resolving power R =
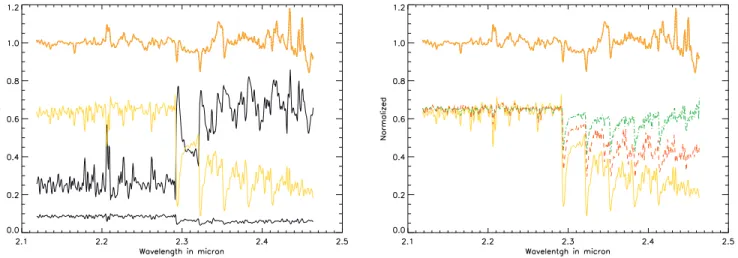
Fig. 10. Left Separation of the medium-resolution K band spectra HR 5171 A based on their spatial properties resulting from the geometrical
models analysis of Sect.3. The upper orange line is the full spectrum. The yellow line is the spectrum from the uniform disk which its respective normalized flux. The contribution from the Gaussian is characterized by the strong CO emission lines, and the secondary flux is the bottom line at about 12% level in the continuum. Right The spectrum from the uniform disk is compared to the G8Ib IRTF template in dotted green and the spectrum of Betelgeuse in dashed red. The depth of the CO absoptions is related to the large column of molecular material that is found around the system. Obviously, the CO molecular lines, even those originating in the core of HR 5171 A are affected by the strong veiling from the circumstellar environment and cannot be used for the spectral classification of the primary.
5.3. Influence of the circumstellar environment
In the near-IR spectra shown in Fig. 2, one can note the simi-larity between the G0Ib near-IR template (HD 185018) and the AMBER spectrum of V382 Car, whereas we observe numer-ous differences between the G8Ib template (HD 208606) and HR 5171 A. The AMBER spectrum from HR 5171 A is char-acterized by a strong sodium line Na I 2.2 µm in emission and narrow CO bandheads that are partly filled by emission. A similar NaI 2.2 µm emission is also reported and discussed by Oudmaijer & de Wit (2013) on other YHGs, such as ρ Cas (Gorlova et al. 2006) or IRC+10420 (Oudmaijer & de Wit 2013). This line betrays the presence of an extended region where the continuum forms inside the dense wind from the YHG, which veils the hydrostatic photosphere and may explain the unusual reddening and surprising decoupling between the photometric and spectroscopic data.
A UD is necessary to explain the zero visibility observed in the interferometric data that implies the presence of a sharp (photospheric) border, but the particular shape of the visibility curve also implies an extended and dense environment. This en-velope is also indicated by the striking visibility signal observed in the CO lines and the NaI2.2 µm doublet (Fig.B.3), whereas no signal is observed in the Brγ line. A comparison with the same data for V382 Car shows that all the lines from HR 5171 A observed in this spectral region form in an extended environ-ment compared to the continuum, except for Brγ, which seems to be the only photospheric line in this spectral domain.The in-terferometric model presented in Sect.3 is the combination of an uniform disk, a Gaussian disk and an offset point source, whose sizes and positions were achromatically estimated in the fitting routine and whose relative fluxes are estimated for each spectral channel (see Sect. 3). These relative fluxes are shown in Fig. 10. The UD spectrum exhibits deep absorptions in the CO bands, increasing with wavelength more rapidly than in the spectrum of Betelgeuse, used as template. This suggests that the envelope renders any spectral classification dubious. The spectrum from the Gaussian is characterized by the same lines, now strongly in emission as may be expected from an extended envelope. It must
be stressed that although qualitatively interesting, this approach can hardly provide robust quantitative information. The spec-tral separation procedure relies on an accurate knowledge of the flux-calibrated spectrum of the total source at that the time of the observations and the spatial distribution of the emission, imply-ing a full spectrally dependent image reconstruction, such as per-formed only once on the case of the SgB[e] HD 62623 (Millour et al. 2011). The formation of CO bands emission is very com-plex, and certainly their study by the technique described here would imply a (time-consuming) dedicated imaging campaign.
We also found that the [N ii] λ6548 and λ6583 emission lines of HR 5171 A in the AAT-UCLES spectrum of 14 Jun 1994 are spatially extended. The spatial scale is 0.16 arcsec per spatial pixel, and the [N ii] λ6548 line is detected up to three pixels (∼0.5”), while the [N ii] λ6583 line is seen up to five pixels away from the continuum peak (∼0.8”). Extended [N ii] λ6583 emission is also observed in HD 168625 and in HR 8752 (Lobel et al. 2013). It is interesting that both HR 8752 and HD 168625 are supergiant binaries. Interestingly, HD 168625 is also an LBV candidate with a triple ring nebula (Smith 2007) resembling the one around SN 1987A.
To summarize, the interferometric data show that the ex-tended envelope has a strong influence on the spectral appear-ance, complicating spectral classification. This envelope acts as a ‘pseudo-photosphere’ in the sense that it imprints a signature that may have strongly influenced the spectral diagnoses pub-lished so far.
6. Discussion
6.1. HR 5171 A: an over-contact interacting binary
The first surprise that came out of the AMBER/VLTI observa-tions was the large angular diameter for such a distant source, which implied a radius of 1310±260 R⊙(∼6 AU). Recent models predict that the most extended red supergiants reach 1000-1500 R⊙, and have initial masses not exceeding 20-25 M⊙(Ekstr¨om et al. 2012), while the radius of a YSG is expected to be 400-700 R⊙. HR 5171 A appears as extended as bright red
super-Fig. 9. Top:Comparison of the 2013 low-resolution SAAO spectrum
(yellow) with two templates of similar spectral type. The spectrum of HR 5171 A is discrepant in lacking some Hα absorption (vertical dotted line). Bottom: Comparison between the 1992 AAT echelle spectrum (purple dotted line) overplotted with the 2013 PUCHEROS spectrum (yellow curve). The spectra are very similar. The Hα and [N ii] λ6548 lines are indicated as vertical dotted and dashed lines, respectively.
giants (Arroyo-Torres et al. 2013), such as VY CMa (Wittkowski et al. 2012; Smith et al. 2001, 1420±120R⊙) and has a radius 50% larger than the radius of Betelgeuse (Haubois et al. 2009, 885±90R⊙). Such a large radius for a G8 YHG seems inconsis-tent with a single star evolution unless HR 5171 A just left the red supergiant stage.
The phased light curve and the subsequent NIGHTFALL mod-eling lead independently to a large diameter for the primary and secondary in the context of a contact or over-contact mas-sive binary system. From Kepler’s third law and for a very-low mass companion of period 3.57 yr orbiting as close as 1.3 R∗, we infer the lowest current mass of the system to be 22±5 M⊙. Taking into account the Nightfall modeling constraints on the separation of the components and the optical interferome-try constraints on the primary apparent diameter (and their un-certainties), we estimated the total mass of the system to be 39+40
−22M⊙(at D=3.6±0.5kpc).
The long-term evolution of the B − V curve that ended in the 80s suggests that contact may have happened relatively re-cently, coinciding with a period of increased activity. Such a large change in color suggests a dramatic change in spectral type in a few tens of years, which is not at odds with what is known
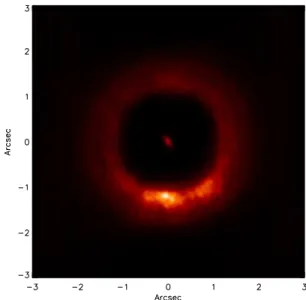
Fig. 11. NICI/Gemini coronagraphic image of HR 5171 A in the [FeII]
1.644 micron line. The central star is visible, highly dimmed by the semi-transparent coronagraphic mask to optimize the fine pointing of the source at the center. The mask has a radius of 0.9” and the detected light extends up to 1.8”.
already for these extreme objects (Nieuwenhuijzen et al. 2012; Klochkova et al. 1997; de Jager 1998). Unfortunately, we have to rely on very few spectra for the spectral type characterization, covering three epochs 1971-1973, 1992-1994, and 2013. The (limited) analysis of the spectra shows that the spectral type and effective temperature inferred were relatively similar (a compari-son is shown in Fig. 9). The spectral determination remains crude and largely complicated by the veiling issue. The analysis of the near-IR spatially resolved spectra from AMBER (Fig. 10) shows that the veiling is very strong. An alternative, intermediate sce-nario would imply a strong increase in the mass-loss rate, the creation of a relatively thin, extended gaseous envelope affect-ing the visual band only marginally, but strongly influencaffect-ing the B − V color index. We discuss this issue further in the following section.
6.2. Activity and mass loss
The photometric behavior of HR 5171 A is very similar to the ac-tivity of the archetypal YHG ρ Cas (Gorlova et al. 2006; Lobel et al. 2003). The near-IR and visual light curves show long-term variations and shorter term minima. If one takes the Dean min-imum as the starting point for this analysis, one can interpret the behavior of the photometric and color curves as an outburst that propelled part of the primary envelope into the circumbi-nary environment. The veiling lasted more than 20 years as seen by the decrease in the J − H or V − K curves until a new deep minimum was observed around 2000 (the Otero minimum) that apparently initiated a new cycle. The Otero minimum is nearly identical to the millennium outburst V-minimum of ρ Cas, in-terpreted by Lobel et al. (2003) as resulting from a shell ejec-tion or outburst event after which the star continued with its usual pulsation variability. The gradual increase in the B − V color index seems to be only slightly affected by the Dean min-imum, suggesting that the star’s activity is a second-order per-turbation. Unfortunately, some B band photometry is missing to
probe the later stages (e.g., Otero minimum). What is the con-nection between the short-term deep minima and the near-IR col-ors? During the 1999-2000 outburst, the effective temperature of ρCas apparently decreased by more than 3000 K and an increase of its mass-loss rate from ˙M∼10−5to 5.4 × 10⁻²M
⊙yr−1 was in-ferred (Lobel et al. 2003). The analysis of the SED suggests that a 800 K decrease can explain the differences observed between a minimum and the normal state. Intensive spectroscopic and in-terferometric monitoring would be needed during the next visual mimimum of HR 5171 A to better understand the mechanism of these mass-loss events.
The similarities of the photometric behavior and spectral ap-pearance of HR 5171 A with other YHG suggest that its activ-ity and mass-loss rate are due to the same process, namely the chaotic strong pulsations intimately related to the mean adia-batic index deep in the atmosphere. The key question related to the discovery of a low-mass companion is to determine its influence on the mass-loss process. Even a comparatively low-mass secondary can dramatically influence a low-massive — yet loosely bound and unstable — envelope through tides and at-mospheric/wind friction. As the more massive star evolves and expands, the Roche lobe limits the size of the primary, and parts of the envelope become unbound in a process that is currently poorly known. In particular, it is by no means granted that this process is smooth and steady. The complex and variable light curve suggests large ejection events. The primary is forced to have a surface temperature set by the uncoupled core luminosity and the size of the Roche lobe. Binarity may therefore be a key component for other YHGs as well.
Even with the large dataset presented here, the issue of the rotation of the primary is far from trivial. We first suspected ev-idence of significant rotation from the large widths of lines in the spectrum, but a comparison to other YHGs suggests that the large turbulence for these exceptional sources can easily hide a relatively large (e.g. 10-30 km s−1) vsin(i). We note also that the
presence of the companion is not accompanied by detectable X-ray emission (see Sect.C). Does this imply that the mass-transfer process is relatively smooth and the X-rays cannot emerge from the dense envelope? These observations are correlated to the lack of any emission in the optical and near-IR from hydrogen recom-bination lines.
Recent NICI/Gemini-South coronagraphic images obtained in the near-IR reveal a faint extended nebula with a radius out to 1.8”(Rsh=6500 AU at D=3.6kpc) around the system (Fig. 11). This implies that a significant amount of mass has been lost dur-ing past centuries. Usdur-ing HST, Schuster et al. (2006) report a lack of diffuse emission in the range 0.9-1.4”down to very low levels (5-7.5 mag). Using the assumptions in Fig. 4 of their paper, we infer a dynamical time for these radii in the range 300-1000 yr (corresponding to expansion velocities of 100 and 35km s−1, re-spectively). This observation is in line with the estimates from early studies from Apruzese (1975) based on the first mid-IR observations of this source. A model involving a shell at 100 R∗ was considered as not tenable for explaining the IR flux observed at 25-60 micron, and a 1000 R∗ shell was preferred by the au-thors. At the distance D=3.6kpc, this would represent a shell of 1.4”radius, in agreement with the more extended [Fe ii] emis-sion seen in the Gemini/NICI images. Does the presence of the companion imply a long-term cycle with periods of activity and a high mass-loss rate followed by quiescent periods lasting a few tens of years, during which time the diameter of the primary is decreased and the mass-loss rate is much lower?
In Fig. 12, we present a sketch that summarizes our view of HR 5171 A following our best constraints on the system. The
system is presented at maximum elongation for the sake of clar-ity, and observations at these particular orbital phases are needed to have the best view of the contact between the two components of the system.
6.3. Hypergiants and binarity
Mounting evidence indicates that binarity has a decisive effect on the fates of massive stars and, in particular, on their rotation rate (de Mink et al. 2013; Sana et al. 2012; Kochanek 2009). Binary mass transfer via Roche lobe overflow (RLOF) has long been considered a key channel for producing stripped-envelope Wolf-Rayet stars, and the statistics of supernovae sub-types con-firm the importance of the binary channel in producing stripped-envelope supernovae (Smith et al. 2011b). Similar conclusions are reached through the modeling of the light curves and spec-tra of SNe IIb, Ib, and Ic (Dessart et al. 2012, 2011; Ensman & Woosley 1988). Despite the crucial influence of strong binary interaction in the late evolution of massive stars, very few exam-ples of the phenomenon have been identified, and this system is, to our knowledge, unique. Since the mass transfer phase of mas-sive binaries is very brief (∼104yr or so), these systems caught in that phase are extremely rare and each one of them is very valuable for studying the physics of the process.
Considering the current parameters for the HR 5171 A sys-tem compared to binary evolution models suggests the following scenario. During the main sequence, HR 5171 A was a detached binary system. When the most massive star became a YHG, with a bloated and intrinsically unstable envelope, the separation was still too large for the two components to merge or to exchange a large amount of mass. The primary envelope is now quite cool and large, possibly under the decisive influence of the compan-ion. The convective layers span most of the star’s radius, and as-suming convective motions at 10-20km s−1, some material can
reach the interior regions in 2-3 yr, which is a time shorter than the orbital period. The Kelvin-Helmholtz time for these stel-lar envelopes is comparatively short, a few tens of years. Can the convective envelope efficiently transfer the incoming angular momentum from the secondary deep into the primary star’s inte-rior? What is the competing influence of angular momentum loss due to the mass lost by the system? YHGs are extremely unsta-ble and their observations show that a large pulsationnal activity can explain their high mass-loss rate even without invoking the influence of a companion.
The system is probably undergoing Wind Roche-Lobe Overflow (Abate et al. 2013, WRLOF), i.e., the primary under-fills its Roche lobe, but a significant fraction of its wind under-fills it up and is gravitationally channeled to the secondary. This process is by nature non-conservative; i.e., a lot of mass is lost in the process. Since the primary is close to Roche-lobe filling, its spin should be tidally synchronized with the orbit rotation (Langer, private communication), but an accurate measurement of the ro-tation of the primary is pending.
The fate of the system depends on the orbital evolution. At present, the orbit could shrink (if some mass flows onto the sec-ondary) or widen (due to the mass lost by the system). If it shrinks, the system could still develop into dynamical common envelope interaction, and the binary could evolve into a short-period WR+x system, where x is either a main sequence stars or a compact star. As such, it would have a small chance of form-ing a long-duration gamma-ray burst (Detmers et al. 2008). If the orbit widens, it would remain a long period system (Langer, private communication). If the common envelope is avoided but a significant amount of angular momentum transferred, then the