HAL Id: hal-02322043
https://hal.archives-ouvertes.fr/hal-02322043
Submitted on 31 Oct 2019
HAL is a multi-disciplinary open access
archive for the deposit and dissemination of
sci-entific research documents, whether they are
pub-lished or not. The documents may come from
teaching and research institutions in France or
abroad, or from public or private research centers.
L’archive ouverte pluridisciplinaire HAL, est
destinée au dépôt et à la diffusion de documents
scientifiques de niveau recherche, publiés ou non,
émanant des établissements d’enseignement et de
recherche français ou étrangers, des laboratoires
publics ou privés.
Coral resistance to ocean acidification linked to
increased calcium at the site of calcification
T. Decarlo, S. Comeau, C. Cornwall, M. T. Mcculloch
To cite this version:
T. Decarlo, S. Comeau, C. Cornwall, M. T. Mcculloch. Coral resistance to ocean acidification linked to
increased calcium at the site of calcification. Proceedings of the Royal Society B: Biological Sciences,
Royal Society, The, 2018, 285 (1878), pp.20180564. �10.1098/rspb.2018.0564�. �hal-02322043�
HAL Id: hal-02322043
https://hal.archives-ouvertes.fr/hal-02322043
Submitted on 31 Oct 2019
HAL is a multi-disciplinary open access
archive for the deposit and dissemination of
sci-entific research documents, whether they are
pub-lished or not. The documents may come from
teaching and research institutions in France or
abroad, or from public or private research centers.
L’archive ouverte pluridisciplinaire HAL, est
destinée au dépôt et à la diffusion de documents
scientifiques de niveau recherche, publiés ou non,
émanant des établissements d’enseignement et de
recherche français ou étrangers, des laboratoires
publics ou privés.
increased calcium at the site of calcification
T. Decarlo, S. Comeau, C. Cornwall, M. Mcculloch
To cite this version:
T. Decarlo, S. Comeau, C. Cornwall, M. Mcculloch. Coral resistance to ocean acidification linked to
increased calcium at the site of calcification. Proceedings of the Royal Society B: Biological Sciences,
Royal Society, The, 2018, 285 (1878), pp.20180564. �10.1098/rspb.2018.0564�. �hal-02322043�
Research
Cite this article: Decarlo TM, Comeau S,
Cornwall CE, McCulloch MT. 2018 Coral
resistance to ocean acidification linked to
increased calcium at the site of calcification.
Proc. R. Soc. B 20180564.
http://dx.doi.org/10.1098/rspb.2018.0564
Received: 13 March 2018
Accepted: 9 April 2018
Subject Category:
Global change and conservation
Subject Areas:
environmental science
Keywords:
coral, calcification, ocean acidification, calcium
Author for correspondence:
T. M. Decarlo
e-mail: [email protected]
†
Present address: Sorbonne Universite´,
CNRS-INSU, Laboratoire d’Oce´anographie de
Villefranche, 181 chemin du Lazaret,
F-06230 Villefranche-sur-mer, France.
‡
Present address: School of Biological Sciences,
Victoria University of Wellington, Wellington,
New Zealand.
Electronic supplementary material is available
online at rs.figshare.com.
Coral resistance to ocean acidification
linked to increased calcium at the site
of calcification
T. M. Decarlo
1,2, S. Comeau
1,2,†, C. E. Cornwall
1,2,‡and M. T. McCulloch
1,21Oceans Institute and Oceans Graduate School, and2ARC Centre of Excellence for Coral Reef Studies,
The University of Western Australia, 35 Stirling Hwy, Crawley, Western Australia 6009, Australia TMD, 0000-0003-3269-1320; SC, 0000-0002-6724-5286; CEC, 0000-0002-6154-4082
Ocean acidification threatens the persistence of biogenic calcium carbonate (CaCO3) production on coral reefs. However, some coral genera show
resist-ance to declines in seawater pH, potentially achieved by modulating the chemistry of the fluid where calcification occurs. We use two novel geochem-ical techniques based on boron systematics and Raman spectroscopy, which together provide the first constraints on the sensitivity of coral calcifying fluid calcium concentrations (½Ca2þ #
cf) to changing seawater pH. In response
to simulated end-of-century pH conditions, Pocillopora damicornis increased ½Ca2þ #cfto as much as 25% above that of seawater and maintained constant
calcification rates. Conversely, Acropora youngei displayed less control over ½Ca2þ #cf, and its calcification rates strongly declined at lower seawater
pH. Although the role of ½Ca2þ #
cf in driving calcification has often been
neglected, increasing ½Ca2þ #
cfmay be a key mechanism enabling more
resist-ant corals to cope with ocean acidification and continue to build CaCO3
skeletons in a high-CO2world.
1. Introduction
Since the start of the industrial era, atmospheric CO2 concentrations have
increased from approximately 280 to over 400 ppmv today, primarily due to burning of fossil fuels and deforestation [1]. Although CO2levels in the geologic
past (e.g. during the Eocene) were likely several times higher than today, it is the speed of CO2 rise that dictates the severity of ocean acidification [2,3], with
the current rate of CO2released by human activities being unprecedented even
over million-year timescales [4]. However, despite its rapid rise, more than one quarter of anthropogenic CO2 emissions have already been absorbed by the
oceans [5], causing declines in seawater pH and hence aragonite saturation state (VAr¼ ½CO2%3 #½Ca2þ #=Ksp). Shallow-water coral reefs, which are found
only within a relatively narrow range of open-ocean VAr.3 conditions [6],
are likely to be among the most sensitive marine ecosystems to ocean acidifica-tion [6–8]. Under ‘business-as-usual’ CO2 emissions, climate models project
that the surface open ocean could be devoid of regions with VAr.3 by the end
of the twenty-first century [9], potentially driving a rapid decline of corals and the CaCO3-based reef ecosystems that they build.
Crucial to interpreting the sensitivity of corals to ocean acidification is the mechanism by which calcification occurs. Scleractinian corals transport seawater to a micro-scale internal calcifying space [10–12], thereby supplying some of the calcium (Ca2þ) and carbonate (CO2%
3 ) ions needed to build their aragonitic
(CaCO3) skeletons. However, as seawater pH declines, the concentration of
car-bonate ions ([CO2%3 ]) in seawater decreases, making precipitation of CaCO3less
favourable due to lower VAr[13]. In laboratory experiments, many corals
repeat-edly show decreased calcification rates in response to lower-VAr conditions
achieved by manipulating seawater pH or, less commonly, [Ca2þ] [14–17]. Yet,
it is increasingly recognized that not all corals are affected equally. Some species are highly sensitive ‘losers’ and others appear to be more resistant ‘winners’ that
1 2 3 4 5 6 7 8 9 10 11 12 13 14 15 16 17 18 19 20 21 22 23 24 25 26 27 28 29 30 31 32 33 34 35 36 37 38 39 40 41 42 43 44 45 46 47 48 49 50 51 52 53 54 55 56 57 58 59 60 61 62 63
ARTICLE IN PRESS
may potentially benefit from reduced competition for space or resources [8]. Differential sensitivities to VAramong coral
species imply that ocean acidification has the potential to irrevocably alter coral assemblages for centuries to come. Despite this, little is known about how resistant species are better able to cope with acidification. Elevating pH (and thus [CO2%3 ]) at the internal site of calcification is one potential
mech-anism to maintain high VArthat may confer resistance [18–21],
but the ability to raise pH is not limited to resistant species [22]. Alternatively, or in combination, corals could theoretically elevate internal Ca2þ to increase V
Ar, even though
concen-trations of Ca2þ in ambient seawater (approx. 10 mmol kg21)
far exceed those of CO2%3 (approx. 0.2 mmol kg21). The utility
of elevating [Ca2þ] is, however, potentially limited to less
than a factor of approximately two increase relative to seawater because decreases in Mg/Ca will begin to favour the precipi-tation of calcite over aragonite [23] and the Ca2þ =CO2%
3
stoichiometry will become less optimal for crystal growth [24]. Nevertheless, while at least some corals can actively pump Ca2þ [25,26], no study has quantified changes in
calcify-ing fluid Ca2þ (½Ca2þ #cf) in response to seawater pH, and thus,
the role of Ca2þ relative to CO2%
3 in defining resistance to ocean
acidification remains unknown.
We apply a novel technique to derive ½Ca2þ #cfin the corals
Acropora youngei and Pocillopora damicornis cultured under simulated ocean acidification conditions. In the absence of direct or non-invasive techniques to measure ½Ca2þ #cf, we use
the information provided by combining two recently devel-oped geochemical proxies. First, the boron systematics (d11B
and B/Ca) of aragonite quantify calcifying fluid carbonate chemistry, including pHcf and ½CO2%3 #cf [27,28]. Second,
Raman spectroscopy can be used to determine calcifying fluid VAr [29]. As VAr is a function of both [CO2%3 ] and
[Ca2þ], boron systematics and Raman spectroscopy can be
applied in tandem to derive ½Ca2þ#cf(electronic supplementary
material, table S1). Here, we use this approach to investigate the response of ½Ca2þ #cf to seawater pH and its potential role
in controlling the calcification sensitivity to ocean acidification.
2. Material and methods
The coral culturing experimental design was described pre-viously by Comeau et al. [30]. Briefly, branches of A. youngei and P. damicornis were collected from Rottnest Island in Western Australia and transported to the Waterman’s Bay experimental aquaria facility in Perth, Australia. The corals were allowed to recover for two weeks before exposure to treatments in 36 aqua-ria divided among three pH (total scale) treatments of 7.63, 7.81 and 8.09 maintained by CO2bubbling. After eight weeks, the
apical tips of the skeletons were crushed to powders for geo-chemical and Raman analyses. B/Ca and d11B measurements
and data are reported in Comeau et al. [30]. Mg/Ca and Sr/Ca ratios were measured on a Q-ICP-MS (X-series II, Thermo Fisher Scientific) following the methods of Holcomb et al. [31]. Precisions of Mg/Ca and Sr/Ca were 0.01 mmol mol21 and
0.009 mmol mol21, respectively, based on repeated analyses of
an in-house coral skeleton consistency standard.
Raman spectroscopy was conducted on the same powders used for geochemical analyses. Measurements were made on a WITec Alpha 300RAþ system with an Andor iDUS 401 CCD maintained at 2608C, and a 20& objective with 0.5 numerical aperture. An infrared (785 nm) laser was used with a 1200 mm21grating and the spectral centre placed at a Raman
shift of 830 cm21. Coral skeleton powders were spread onto a
glass slide and multiple grains (typically five) were sampled with 1 s integration times. A target for replication was set at 25 spectra per sample (i.e. per individual coral branch), although this was not always achieved as some spectra with poor signal (i.e. arbitrary intensity units less than 100) were subsequently fil-tered during data processing (electronic supplementary material, tables S2–S3). For each spectrum, the aragoniten1peak was fit
with a Gaussian curve, and the resulting full width at half maxi-mum (FWHM) intensity was converted to VAr following the
methods of DeCarlo et al. [29]. We note that VArwas estimated
by Comeau et al. [30] based only on boron-derived ½CO2%3 #cf
and assuming a constant ½Ca2þ#
cf. Here, we use only the directly
derived ½CO2%3 #cf from Comeau et al. [30], and instead, we
calculate ½Ca2þ# cfas follows: ½Ca2þ#cf¼ VAr' Ksp ½CO2%3 #cf , ð2:1Þ where ½CO2%
3 #cfand VArare derived from boron systematics [28]
and Raman spectroscopy, respectively. This equation is simply a rearrangement of the definition of aragonite saturation state shown in the Introduction. Ca2þ
cf=Ca2þsw ratios were calculated
by normalizing to [Ca2þ]
sw, which was estimated from salinity
as 10.58 mmol kg21[32].
Precisions of derived ½Ca2þ#
cfwere estimated with a Monte
Carlo method. We repeated the calculation of ½Ca2þ# cf 104
times, and in each iteration, we added random errors to the measured d11B (1sanalytical uncertainty of 0.17‰), B/Ca (1s
analytical uncertainty of 18 mmol mol21) and Raman FWHM
(standard error of replicates per sample; electronic supplemen-tary material, tables S2–S3), assuming Gaussian distributions. We estimated the 1s uncertainty of ½Ca2þ#
cf by taking the
standard deviation of the 104Monte Carlo iterations.
We also tested whether our technique could be accurately applied to abiogenic (i.e. synthetic or inorganic) aragonites. These aragonites were precipitated from seawater with [Ca2þ]
manipu-lated by the addition of CaCl2and concentrated seawater [27],
allowing us to check if our combined boron and Raman approach is sensitive to variations in [Ca2þ]. We used the seven abiogenic
aragonite samples that were repeatedly analysed in DeCarlo et al. [29] for calibration of the Raman-VArproxy, in addition to
new Raman measurements on nine more abiogenic aragonite samples that were precipitated from fluids with [Ca2þ] exceeding
12 mmol kg21, as described in [27]. Eight of the abiogenic aragonite
samples were precipitated using a ‘degassing’ method in which CaCO3 was dissolved in acidified seawater and precipitation
occurred as the seawater pCO2equilibrated with the atmosphere.
The degassing experiments were not used in calibrating the Raman-VArproxy. The other eight experiments were conducted
by pumping Na2CO3/NaHCO3solutions into filtered seawater.
For each sample, we used the fluid pH, and the aragonite B/Ca and Raman FWHM to calculate [Ca2þ] as described above. We
then compared our derived [Ca2þ] with that reported from
measurements during the aragonite precipitation experiments [27]. Coral ½Ca2þ#
cf dynamics were separately estimated using
Mg/Ca and Sr/Ca ratios of the coral skeletons. Coral calcifica-tion models that invoke seawater as the ultimate source of the calcifying fluid, Ca2þ addition to the fluid and precipitation
from a closed or semi-closed reservoir have been successful at explaining much of the variability in the elemental composition of the skeleton [12,29,33,34]. Although such models have not been validated in terms of accurately predicting ½Ca2þ#
cf
variabil-ity, they can provide insights into whether Ca2þ addition to the
calcifying fluid is required to explain the skeletal geochemistry. We used the model described in [29] that predicts ½Ca2þ#
cf
enrich-ment based on paired Mg/Ca and Sr/Ca data. The model is based on the abiogenic partitioning of these two element ratios between aragonite and seawater, and it solves for the combi-nation of ½Ca2þ#
cf enrichment (which dilutes both Mg/Ca and
.
2 64 65 66 67 68 69 70 71 72 73 74 75 76 77 78 79 80 81 82 83 84 85 86 87 88 89 90 91 92 93 94 95 96 97 98 99 100 101 102 103 104 105 106 107 108 109 110 111 112 113 114 115 116 117 118 119 120 121 122 123 124 125 126Sr/Ca) and Rayleigh fractionation (which increases Mg/Ca and decreases Sr/Ca) that match the measured element ratios. We performed two separate model runs: one in which addi-tion to the calcifying fluid is 100% selective for Ca2þ and
another in which addition is 50% ‘leaky’ with respect to Mg2þ
and Sr2þ (i.e. [Sr2þ ]
fluid¼ (0.5Ca2þaddition)(Srsw/Casw) þ [Sr2þ]sw).
Both produce the same patterns of variability, but the latter requires twice the ½Ca2þ#
cf enrichment to explain the measured
element ratios.
All parameters (½CO2%
3 #cf, ½Ca2þ#cf, VAr, calcification rate and
modelled ½Ca2þ#
cf) for each species were checked for normality
with Kolmogorov–Smirnov tests and homogeneity of variances across pH treatments with Levene’s tests. Regressions were per-formed using the linear model (lm) function in R [35] with species treated as factors as described in the text. Residuals of all regressions were also checked for normality with Kolmogorov–Smirnov tests.
3. Results and discussion
Our application of the Raman and boron proxies to the abio-genic aragonites produced [Ca2þ] estimates that were
correlated with the known [Ca2þ] during the experiments
(figure 1). A regression between derived and known [Ca2þ]
has a slope of 1.0 + 0.1 (r2¼ 0.82) (figure 1d). Although
excluding the highest [Ca2þ] data point decreases the slope
to 0.71 + 0.09 (r2¼ 0.82), the data still indicate a sensitivity
of the combined Raman-boron proxy to fluid [Ca2þ]. This
result supports the overall reliability of our approach because the derived versus known [Ca2þ] plot close to a 1 : 1 line,
demonstrating that the Raman and B/Ca proxies differ pri-marily by their sensitivities to [Ca2þ]. The root-mean-square
error of the derived to known [Ca2þ] regression is
1.7 mmol kg21, and comparing this with the average
stan-dard deviation of derived [Ca2þ] (0.9 mmol kg21 for
abiogenic data and 0.5 mmol kg21 for our corals) indicates
that at least half of the scatter in the regression is explained by propagation of errors from the boron and Raman measurements. That not all the scatter around the regression is accounted for by the propagated uncertainties may suggest that other factors have minor influences on either the boron or Raman proxies, but it is unlikely that we would be able to successfully reconstruct 82% the [Ca2þ] variance of the
0 5 10 15 20 25 0 5 10 15 20 25 5 10 15 raman-derived WAr known WAr 20 25 30 5 10 15 20 25 30 500 1000 1500 2000 2500 500 1000 1500 2000 2500 [Ca2+] (mmol kg–1) 5 10 15 20 25 (a) (b) (c) (d)
known [CO32–] (µmol kg–1)
boron-deri ved [CO 3 2–] (µmol kg –1) deri ved [Ca 2+ ] (mmol k g –1)
known [Ca2+] (mmol kg–1)
Figure 1. Test of deriving [Ca
2þ] from abiogenic aragonites precipitated under various Ca
2þconcentrations. (a) Derived [Ca
2þ] (colours) as functions of V
Ar(x-axis)
and [CO
2%3
] (y-axis). Each black point shows the derived [Ca
2þ] of a separate abiogenic precipitation experiment. The boron-derived [CO
2%3] and Raman-derived V
Armeasurements that are used together to calculate [Ca
2þ] are shown in (b) and (c), respectively. The dashed grey lines each connect to the boron and Raman data
from a single experiment, indicating how combining these data enables estimates of [Ca
2þ]. For clarity, only a subset of these lines is plotted. (d) Comparison of
derived [Ca
2þ] to the [Ca
2þ] known from fluid measurements during the aragonite precipitation experiments. The dashed black line indicates a 1 : 1 relationship,
and the solid lines show regressions fit to all the data (red) and to all the data except the highest [Ca
2þ] point (blue). Error bars show 95% confidence intervals.
3 127 128 129 130 131 132 133 134 135 136 137 138 139 140 141 142 143 144 145 146 147 148 149 150 151 152 153 154 155 156 157 158 159 160 161 162 163 164 165 166 167 168 169 170 171 172 173 174 175 176 177 178 179 180 181 182 183 184 185 186 187 188 189
ARTICLE IN PRESS
experimental fluids if the primary controls of B/Ca and Raman FWHM were factors other than [CO2%3 ] and VAr,
respectively. Therefore, while each individual data point car-ries substantial uncertainty, our abiogenic test suggests that this approach is successful in capturing changes in [Ca2þ]
given suitable sample replication (figure 1).
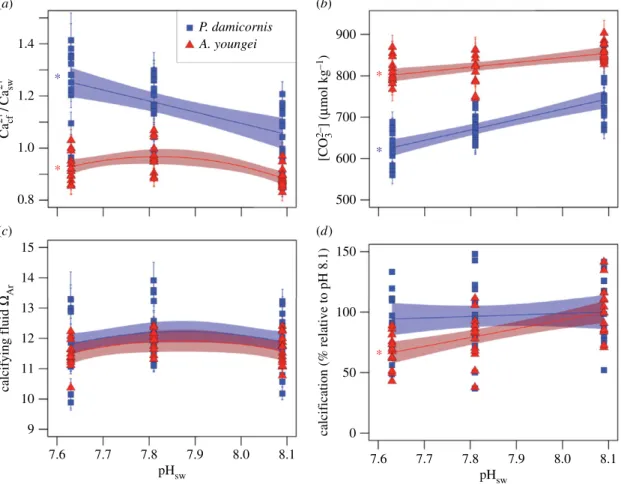
In our culturing experiment, P. damicornis displayed a strong ability to control ½Ca2þ #cf, whereas A. youngei was
unable to elevate ½Ca2þ #
cf in response to low pH. The ratio
of ½Ca2þ #cf to [Ca2þ] of the external seawater (Ca2þ cf =Ca2þsw)
ranged from 0.85 to 1.41 for P. damicornis and increased significantly with decreasing seawater pH (pHsw; r2¼ 0.31,
n ¼ 42, p , 0.01, F1,40¼ 19.3; figure 2a). Pocillopora damicornis
maintained Ca2þ
cf =Ca2þsw of 1.06 + 0.06 (s.e.) at present-day
pHsw (8.09), but it increased Ca2þcf=Ca2þsw to 1.25 + 0.06 at
simulated end-of-century pHsw (7.63) under a
business-as-usual emissions scenario. Conversely, A. youngei did not con-sistently increase Ca2þ
cf =Ca2þswwith decreasing pHsw. Although
A. youngei increased Ca2þ
cf =Ca2þsw slightly from 0.89 + 0.03 at
the highest pHswto 0.97 + 0.03 at the mid-pHswtreatment,
there was no further change in Ca2þ
cf =Ca2þsw at the lowest
pHswtreatment (figure 2a). Calcifying fluid VArwas
main-tained at nearly constant levels across treatments for both species, with only slight declines at the lowest pHsw
(figure 2c). The ability of P. damicornis to control ½Ca2þ#cf
resulted in similar VAr compared with A. youngei, even
though ½CO2%3 #cf was lower in P. damicornis (figure 2b) [30].
The species’ differences in Ca2þ
cf =Ca2þsw are mirrored in
their calcification responses to acidification (figure 2d). While A. youngei calcification declined at lower pHsw(r2¼
0.36, n ¼ 42, p , 0.01, F1,40¼ 24.3), P. damicornis calcification
was insensitive to pHsw(r2¼ 0.01, p ¼ 0.58). These
contrast-ing responses appear to be driven not by calcifycontrast-ing fluid carbonate chemistry [30], but rather by Ca2þ
cf =Ca2þsw. In fact,
½CO2%3 #cf was significantly more sensitive to pHsw for
P. damicornis than for A. youngei (r2¼ 0.83, n ¼ 84, p , 0.01,
F3,80¼ 134.9), contrasting their calcification sensitivities to
pHsw (figure 2). Similarly, P. damicornis calcification has
been shown to be insensitive to acidification across multiple locations in the Pacific Ocean [36], whereas A. youngei is highly sensitive [37,38]. Although the mechanisms underlying these different sensitivities have so far remained largely unre-solved, our results suggest that resistant corals are those with the ability to elevate ½Ca2þ #cf, and more susceptible species are
those which cannot.
There are two non-mutually exclusive hypotheses to explain the changes in Ca2þ
cf =Ca2þswthat we observed: (i)
pas-sive precipitation of CaCO3 and (ii) active upregulation by
the coral polyps. Mass balance considerations imply that accretion of CaCO3 skeleton consumes ½Ca2þ #cf, but this
does not exclude the possibility that upregulation of pro-cesses controlling ½Ca2þ#cf is also involved. Indeed, several
lines of evidence support that much of the Ca2þ
cf =Ca2þsw
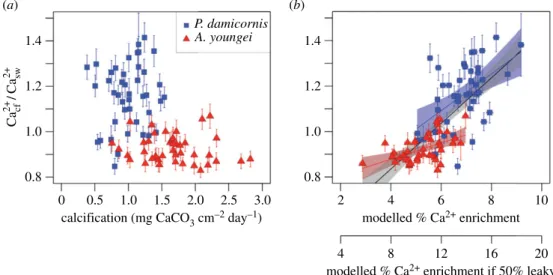
varia-bility in our experiment was driven by the activity of the corals. First, while there is a weak inverse correlation between Ca2þ
cf =Ca2þsw and calcification when data for both species are
combined (r2¼ 0.22, n ¼ 84, p , 0.01, F
1,82¼ 24.0), there are
no significant correlations within each species (figure 3a). Second, the Ca2þ
cf =Ca2þsw exceeding 1 for P. damicornis cannot
be explained by CaCO3 precipitation and requires some
(a) (b) (c) (d) 900 800 700 600 500 150 100 50 calcification (% relative to pH 8.1) 0 [CO 3 2–] ( mmol kg –1) 1.4 1.2 1.0 0.8 14 13 12 11 10 15 9 7.6 7.7 7.8 7.9 8.0 8.1 calcifying fluid WAr Ca cf 2+ /Ca sw 2+ pHsw 7.6 7.7 7.8pH 7.9 8.0 8.1 sw P. damicornis A. youngei * * * * *
Figure 2. Sensitivity of calcifying fluid chemistry and calcification to seawater pH. (a) Ca
2þcf
=Ca
2þsw, (b) ½CO
2%3#cf
, (c) V
Arand (d) calcification responses to pH
swtreatments for both P. damicornis (blue squares) and A. youngei (red triangles). Bounded lines indicate regression fits +1s.e. Coloured asterisks indicate which
regressions are statistically significant (p , 0.01). Error bars on individual points represent 1 s.e.m.
4 190 191 192 193 194 195 196 197 198 199 200 201 202 203 204 205 206 207 208 209 210 211 212 213 214 215 216 217 218 219 220 221 222 223 224 225 226 227 228 229 230 231 232 233 234 235 236 237 238 239 240 241 242 243 244 245 246 247 248 249 250 251 252
mechanism of increasing ½Ca2þ#cf. Finally, we independently
estimated ½Ca2þ #
cf using skeletal Mg/Ca and Sr/Ca ratios
and a simple model [29] in which these element/Ca ratios are explained by initial ½Ca2þ#cfelevation followed by
precipi-tation from a closed reservoir. The elevation of ½Ca2þ# cf
estimated from this modelling exercise is strongly correlated (r2¼ 0.53, n ¼ 84, p , 0.01, F
1,82¼ 93.0) with our derived
Ca2þ
cf =Ca2þsw ratios, and significant positive correlations are
found within each species (figure 3b). However, the model implies that ½Ca2þ #cfis elevated up to 10% with respect to
sea-water, which is less than the upper limit of 25% indicated by our maximum derived mean Ca2þ
cf =Ca2þswof 1.25 for Pocillopora
at the lowest pHsw. One possible reason for this is that the
model assumes that the addition of Ca2þ to the calcifying
fluid is 100% selective for Ca2þ. Allowing this process to be
partially leaky with respect to Sr2þ and Mg2þ ions [39]
brings the modelled ½Ca2þ #
cf elevation into closer agreement
with our derived Ca2þ
cf =Ca2þsw (figure 3b). Transporting Mg2þ
along with Ca2þ to the calcifying fluid may allow ½Ca2þ#cf to
be elevated without favouring calcite growth over aragonite. Further geochemical evidence for active ½Ca2þ #cf elevation
comes from calcium isotope ratios in modern and fossil coral skeletons, which cannot be reconciled with direct precipitation from seawater [40,41]. Rather, the calcium isotopic offset between coral skeletons and seawater supports strong biologi-cal modulation of ½Ca2þ #
cf[40] and potentially some effects of
Rayleigh fractionation or Ca2þ diffusion between the calcifying
fluid and the external environment [41]. Corals may influence their ½Ca2þ #
cf via multiple
mechan-isms. These potentially include Ca-channels [25,39,42–44], Ca2þ/Naþ exchange [43], Ca2þ-ATPase [26] and
precipi-tation/dissolution of amorphous calcium carbonate [45]. The only previous measurements of coral ½Ca2þ #cf were made by
cutting an incision in living Galaxea fascicularis polyps and inserting a Ca2þ microsensor near the skeleton surface [26].
Although potentially invasive, these previous data showed elevation above seawater concentrations by up to 10%, within the range of our Ca2þ
cf =Ca2þsw ratios. Importantly, the
microsensor data allowed for continuous measurements, which revealed a strong sensitivity of ½Ca2þ#cf to light, likely
because the polyp uses energy provided by its photosynthetic
symbionts to drive the activity of various Ca2þ-transport
mech-anisms [26,44]. In additional laboratory experiments that exposed corals to Ca-channel and Ca2þ-ATPase inhibitors,
½Ca2þ#cf variability was dampened and calcification rates
were decreased [26,39,43]. These multiple lines of evidence make it clear that some corals have cellular mechanisms in place to modulate ½Ca2þ #cf, and our results demonstrate that
resistant species such as Pocillopora can upregulate these processes to resist the effects of ocean acidification and to main-tain normal calcification rates even at low pHsw. Conversely,
our data indicate that A. youngei exerts less control on ½Ca2þ#cf, consistent with a previous experiment that found
gene expression for ion transporters in Acropora did not change in response to seawater pH [46].
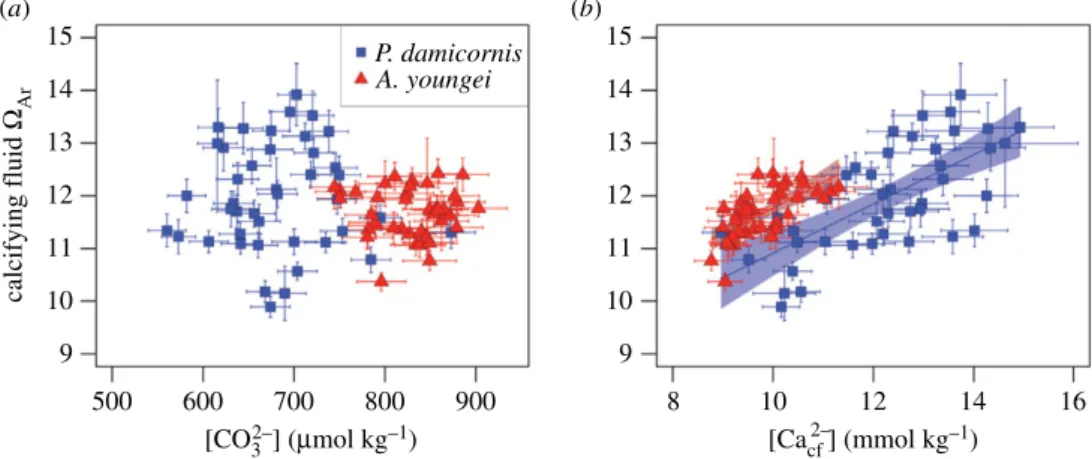
Our unique characterization of ½CO2%3 #cf and ½Ca2þ#cf
enables the first evaluation of their relative influences on calcifying fluid VAr. Most models of coral calcification rely
on the assumption that VAr is controlled by ½CO2%3 #cf and
that variability in ½Ca2þ#cf is negligible [20,47]. However, we
found no significant correlations between ½CO2%3 #cf and VAr,
neither within nor between species (figure 4a). Rather, VAr
is positively correlated (r2¼ 0.47, n ¼ 84, p , 0.01, F 2,81¼
37.8) with ½Ca2þ #
cf for both A. youngei and P. damicornis
(figure 4b). This finding should, however, be viewed with some caution because our technique of deriving ½Ca2þ#cf in
part from proxy measurements of VAr means that they are
not independent, and thus, it is difficult to determine if this correlation represents a causal relationship. Nevertheless, for a given ½Ca2þ#
cf, calcifying fluid VAris higher in A. youngei
than P. damicornis, which may explain the overall faster calci-fication of A. youngei [30]. Critically though, ½Ca2þ #cf for
A. youngei remains within a relatively narrow range, whereas P. damicornis is capable of driving VArhigher, potentially by
elevating ½Ca2þ #cf. This ability may account for the relative
insensitivity of P. damicornis calcification to seawater pH, although we cannot exclude some influence of other factors such as changes in calcifying time or surface area within the calyx.
Ocean acidification, combined with warming, threatens to disrupt coral growth and survival [6–8,38]. Although some resistant species are likely to persist, the differential responses
P. damicornis A. youngei (a) (b) 1.4 1.2 1.0 0.8 1.4 1.2 1.0 0.8 Ca cf 2+ /Ca sw 2+ 0 0.5 1.0 1.5 2.0 2.5 3.0
calcification (mg CaCO3 cm–2 day–1) modelled % Ca2+ enrichment
2 4 6 8 10
modelled % Ca2+ enrichment if 50% leaky
4 8 12 16 20
Figure 3. Factors driving Ca
2þcf
=Ca
2þswvariability. Sensitivity of Ca
2þcf=Ca
2þswto (a) calcification and (b) ½Ca
2þ#cf
elevation estimated by modelling with Mg/Ca and
Sr/Ca ratios. In (b), the upper x-axis values show the model assuming 100% selectivity for Ca
2þ, and the lower x-axis values show the model that is 50% leaky with
respect to Mg
2þand Sr
2þions. The black line with grey error bound in (b) corresponds to regressions fit to the data from both species. The coloured lines and error
bounds in (b) show species-specific regressions. Colours are the same as in figure 2.
5 253 254 255 256 257 258 259 260 261 262 263 264 265 266 267 268 269 270 271 272 273 274 275 276 277 278 279 280 281 282 283 284 285 286 287 288 289 290 291 292 293 294 295 296 297 298 299 300 301 302 303 304 305 306 307 308 309 310 311 312 313 314 315
ARTICLE IN PRESS
to ocean acidification will potentially create novel configur-ations of species occupying coral reefs. If coral communities shift in favour of species resistant to ocean acidification [8], there are likely to be cascading effects in reef ecosystems due to the associations of other reef biota with the habitat created by susceptible coral genera such as Acropora [48]. Fur-thermore, declines in CaCO3 production by susceptible
genera are expected to be exacerbated by increasing bioero-sion and carbonate dissolution rates as seawater pH declines [49–53]. In tandem, these changes in CaCO3budgets
could inhibit some reefs from keeping pace with rising sea levels [54]. Identifying which corals can cope with ocean acid-ification by increasing ½Ca2þ #cfprovides a new perspective in
identifying more resistant species, which may help efforts to forecast the changing state and viability of coral reefs as anthropogenic CO2continues to invade the oceans.
Ethics.All local regulations and permit requirements were followed
during this study.
Data accessibility.Datasets supporting this article have been uploaded as
the electronic supplementary material, and the raw data and code
are available at https://codeocean.com/2018/03/12/code-for- amp-num-34-semi-resistant-corals-increase-calcium-to-cope-with-ocean-acidification-amp-num-34-semi/code.
Authors’ contributions.S.C. and C.E.C. performed the culturing
exper-iments and measured the skeletal geochemistry. T.M.D. performed the Raman analyses, designed the technique for quantifying calcium concentrations, and wrote the manuscript. All authors contributed to interpreting data and editing the manuscript.
Competing interests.The authors declare that they have no competing
interests.
Funding. This study was funded by an ARC Laureate Fellowship
(FL120100049) awarded to M.T.M., the ARC Centre of Excellence for Coral Reef Studies (CE140100020) and S.C. was supported by
an ARC DECRA (DE160100668). Q1
Acknowledgements.Thomas Becker (CMCA) assisted with Raman
spec-troscopy measurements. The authors acknowledge the facilities, and the scientific and technical assistance of the Australian Microscopy & Microanalysis Research Facility at the Centre for Microscopy, Charac-terisation and Analysis, The University of Western Australia, a facility funded by the University, State and Commonwealth Governments. J. Ries and one anonymous reviewer provided helpful comments that improved the quality of a previous version of this manuscript.
References
1. IPCC. 2013 Climate Change 2013: The Physical Science Basis. Contribution of Working Group I to the Fifth Assessment Report of the Intergovernmental Panel on Climate Change (eds TF Stocker et al.), pp. 1535. Cambridge, UK: Cambridge University Press.
2. Tyrrell T, Zeebe RE. 2004 History of carbonate ion concentration over the last 100 million years. Geochim. Cosmochim. Acta 68, 3521–3530. (doi:10. 1016/j.gca.2004.02.018)
3. Ho¨nisch B et al. 2012 The geological record of ocean acidification. Science 335, 1058–1063. (doi:10. 1126/science.1208277)
4. Zeebe RE, Ridgwell A, Zachos JC. 2016 Anthropogenic carbon release rate unprecedented during the past 66 million years. Nat. Geosci. 9, 325–329. (doi:10.1038/ngeo2681)
5. Sabine CL et al. 2004 The oceanic sink for anthropogenic CO2. Science 305, 367–371. (doi:10.
1126/science.1097403)
6. Hoegh-Guldberg O et al. 2007 Coral reefs under rapid climate change and ocean acidification.
Science 318, 1737–1742. (doi:10.1126/science. 1152509)
7. De’ath G, Lough JM, Fabricius KE. 2009 Declining coral calcification on the Great Barrier Reef. Science 323, 116. (doi:10.1126/science.1165283) 8. Fabricius KE et al. 2011 Losers and winners in coral
reefs acclimatized to elevated carbon dioxide concentrations. Nat. Clim. Chang. 1, 165–169. (doi:10.1038/nclimate1122)
9. IPCC. 2014 Climate Change 2014: Impacts, Adaptation, and Vulnerability. Part B: Regional Aspects. Contribution of Working Group II to the Fifth Assessment Report of the Intergovernmental Panel on Climate Change (eds V Barros et al.), pp. 688. Cambridge, UK: Cambridge University Press. 10. Barnes DJ. 1970 Coral skeletons: an explanation
of their growth and structure. Science 170, 1305–1308. (doi:10.1126/science.170.3964.1305) 11. Clode PL, Marshall AT. 2002 Low temperature
FESEM of the calcifying interface of a scleractinian coral. Tissue Cell 34, 187–198. (doi:10.1016/S0040-8166(02)00031-9)
12. Gagnon AC, Adkins JF, Erez J. 2012 Seawater transport during coral biomineralization. Earth Planet. Sci. Lett. 329, 150–161. (doi:10.1016/j.epsl. 2012.03.005)
13. Burton EA, Walter LM. 1987 Relative precipitation rates of aragonite and Mg calcite from seawater: Temperature or carbonate ion control? Geology 15, 111–114. (doi:10.1130/0091-7613(1987)15,111: RPROAA.2.0.CO;2)
14. Gattuso J-P, Frankignoulle M, Bourge I, Romaine S, Buddemeier RW. 1998 Effect of calcium carbonate saturation of seawater on coral calcification. Glob. Planet. Change 18, 37–46. (doi:10.1016/S0921-8181(98)00035-6)
15. Langdon C, Takahashi T, Sweeney C, Chipman D, Goddard J, Marubini F, Aceves H, Barnett H, Atkinson MJ. 2000 Effect of calcium carbonate saturation state on the calcification rate of an experimental coral reef. Glob. Biogeochem. Cycles 14, 639–654. (doi:10.1029/1999GB001195) 16. Chan NCS, Connolly SR. 2013 Sensitivity of coral
calcification to ocean acidification: a meta-analysis.
(a) (b) 14 13 12 11 10 15 9 14 13 12 11 10 15 9 calcifying fluid WAr [CO32–] (mmol kg–1) 500 600 700 800 900 8 10 12 14 16 P. damicornis A. youngei [Cacf 2–] (mmol kg–1)
Figure 4. Relative influences on coral calcifying fluid V
Ar. Sensitivity of V
Arto (a) ½CO
2%3#cf
and (b) ½Ca
2þ#cf
. Colours are the same as in figure 2.
6 316 317 318 319 320 321 322 323 324 325 326 327 328 329 330 331 332 333 334 335 336 337 338 339 340 341 342 343 344 345 346 347 348 349 350 351 352 353 354 355 356 357 358 359 360 361 362 363 364 365 366 367 368 369 370 371 372 373 374 375 376 377 378
Glob. Chang. Biol. 19, 282–290. (doi:10.1111/ gcb.12011)
17. Swart PK. 1979 The effect of seawater calcium concentrations on the growth and skeletal composition of a scleractinian coral: acropora squamosa. SEPM J. Sediment. Res. 49, 951–954. (doi:10.1306/ 212F7888-2B24-11D7-8648000 102C1865D) 18. Wall M, Fietzke J, Schmidt GM, Fink A, Hofmann LC,
de Beer D, Fabricius KE. 2016 Internal pH regulation facilitates in situ long-term acclimation of massive corals to end-of-century carbon dioxide conditions. Sci. Rep. 6, 30688. (doi:10.1038/srep30688) 19. Ries JB, Cohen AL, McCorkle DC. 2009 Marine
calcifiers exhibit mixed responses to CO2-induced
ocean acidification. Geology 37, 1131. (doi:10.1130/ G30210A.1)
20. Ries JB. 2011 A physicochemical framework for interpreting the biological calcification response to CO2-induced ocean acidification. Geochim.
Cosmochim. Acta 75, 4053–4064. (doi:10.1016/ j.gca.2011.04.025)
21. Venn A, Tambutte E, Holcomb M, Allemand D, Tambutte S. 2011 Live tissue imaging shows reef corals elevate pH under their calcifying tissue relative to seawater. PLoS ONE 6, e20013. (doi:10. 1371/journal.pone.0020013)
22. McCulloch MT, Falter J, Trotter J, Montagna P. 2012 Coral resilience to ocean acidification and global warming through pH up-regulation. Nat. Clim. Chang. 2, 623–627. (doi:10.1038/nclimate1473) 23. Ries JB, Stanley SM, Hardie LA. 2006 Scleractinian
corals produce calcite, and grow more slowly, in artificial Cretaceous seawater. Geology 34, 525. (doi:10.1130/G22600.1)
24. Nehrke G, Reichart G, Van Cappellen P, Meile C, Bijma J. 2007 Dependence of calcite growth rate and Sr partitioning on solution stoichiometry: Non-Kossel crystal growth. Geochim. Cosmochim. Acta 71, 2240–2249. (doi:10.1016/J.GCA.2007.02.002) 25. Zoccola D, Tambutte´ E, Se´ne´gas-Balas F, Michiels J-F, Failla J-P, Jaubert J, Allemand D. 1999 Cloning of a calcium channel a1 subunit from the reef-building coral, Stylophora pistillata. Gene 227, 157–167. (doi:10.1016/S0378-1119(98)00602-7) 26. Al-Horani FA, Al-Moghrabi SM, De Beer D. 2003 The
mechanism of calcification and its relation to photosynthesis and respiration in the scleractinian coral Galaxea fascicularis. Mar. Biol. 142, 419–426. (doi:10.1007/s00227-002-0981-8)
27. Holcomb M, DeCarlo TM, Gaetani GA, McCulloch M. 2016 Factors affecting B/Ca ratios in synthetic aragonite. Chem. Geol. 437, 67–76. (doi:10.1016/j. chemgeo.2016.05.007)
28. McCulloch MT, D’Olivo Cordero JP, Falter J, Holcomb M, Trotter JA. 2017 Coral calcification in a changing World: the interactive dynamics of pH and DIC up-regulation. Nat. Commun. 8, 15686. (doi:10.1038/ ncomms15686)
29. DeCarlo TM, D’Olivo JP, Foster T, Holcomb M, Becker T, McCulloch MT. 2017 Coral calcifying fluid aragonite saturation states derived from Raman
spectroscopy. Biogeosciences 14, 5253–5269. (doi:10.5194/bg-14-5253-2017)
30. Comeau S, Cornwall CE, McCulloch MT. 2017 Decoupling between the response of coral calcifying fluid pH and calcification to ocean acidification. Sci. Rep. 7, 7573. (doi:10.1038/s41598-017-08003-z) 31. Holcomb M, DeCarlo TM, Schoepf V, Dissard D,
Tanaka K, McCulloch M. 2015 Cleaning and pre-treatment procedures for biogenic and synthetic calcium carbonate powders for determination of elemental and boron isotopic compositions. Chem. Geol. 398, 11–21. (doi:10.1016/j.chemgeo. 2015.01.019)
32. Riley JP, Tongudai M. 1967 The major cation/ chlorinity ratios in sea water. Chem. Geol. 2, 263–269. (doi:10.1016/0009-2541(67)90026-5) 33. Gaetani GA, Cohen AL. 2006 Element partitioning
during precipitation of aragonite from seawater: a framework for understanding paleoproxies. Geochim. Cosmochim. Acta 70, 4617–4634. (doi:10. 1016/j.gca.2006.07.008)
34. DeCarlo TM, Gaetani GA, Holcomb M, Cohen AL. 2015 Experimental determination of factors controlling U/Ca of aragonite precipitated from seawater: implications for interpreting coral skeleton. Geochim. Cosmochim. Acta 162, 151–165. (doi:10.1016/j.gca.2015.04.016)
35. R Core Team. 2016 R: A language and environment for statistical computing
Q2 .
36. Comeau S, Carpenter RC, Nojiri Y, Putnam HM, Sakai K, Edmunds PJ. 2014 Pacific-wide contrast highlights resistance of reef calcifiers to ocean acidification. Proc. R. Soc. B 281, 20141339. (doi:10. 1098/rspb.2014.1339)
37. Schneider K, Erez J. 2006 The effect of carbonate chemistry on calcification and photosynthesis in the hermatypic coral Acropora eurystoma. Limnol. Oceanogr. 51, 1284–1293. (doi:10.4319/lo.2006.51. 3.1284)
38. Anthony KRN, Kline DI, Diaz-Pulido G, Dove S, Hoegh-Guldberg O. 2008 Ocean acidification causes bleaching and productivity loss in coral reef builders. Proc. Natl Acad. Sci. USA 105, 17 442–17 446. (doi:10.1073/pnas.0804478105) 39. Allison N, Cohen I, Finch AA, Erez J, EIMF F. 2011
Controls on Sr/Ca and Mg/Ca in scleractinian corals: the effects of Ca-ATPase and transcellular Ca channels on skeletal chemistry. Geochim. Cosmochim. Acta 75, 6350–6360. (doi:10.1016/j. gca.2011.08.012)
40. Inoue M, Gussone N, Koga Y, Iwase A, Suzuki A, Sakai K, Kawahata H. 2015 Controlling factors of Ca isotope fractionation in scleractinian corals evaluated by temperature, pH and light controlled culture experiments. Geochim. Cosmochim. Acta 167, 80–92. (doi:10.1016/j.gca.2015.06.009) 41. Gothmann AM, Bender ML, Bla¨ttler CL, Swart PK,
Giri SJ, Adkins JF, Stolarski J, Higgins JA. 2016 Calcium isotopes in scleractinian fossil corals since the Mesozoic: implications for vital effects and biomineralization through time. Earth Planet.
Sci. Lett. 444, 205–214. (doi:10.1016/j.epsl.2016. 03.012)
42. Allemand D, Ferrier-Page`s C, Furla P, Houlbre`que F, Puverel S, Reynaud S, Tambutte´ E´, Tambutte´ S, Zoccola D. 2004 Biomineralisation in reef-building corals: from molecular mechanisms to
environmental control. C. R. Palevol 3, 453–467. (doi:10.1016/j.crpv.2004.07.011)
43. Marshall AT. 1996 Calcification in hermatypic and ahermatypic corals. Science 271, 637–640. (doi:10. 1126/science.271.5249.637)
44. Marshall AT, Clode PL, Russell R, Prince K, Stern R. 2007 Electron and ion microprobe analysis of calcium distribution and transport in coral tissues. J. Exp. Biol. 210, 2443–2463. (doi:10.1242/jeb. 003343)
45. Mass T et al. 2017 Amorphous calcium carbonate particles form coral skeletons. Proc. Natl Acad. Sci. USA 114, E7670–E7678. (doi:10.1073/pnas. 1707890114)
46. Moya A et al. 2012 Whole transcriptome analysis of the coral acropora millepora reveals complex responses to CO2-driven acidification during the
initiation of calcification. Mol. Ecol. 21, 2440–2454. (doi:10.1111/j.1365-294X.2012.05554.x)
47. Allison N, Cohen I, Finch AA, Erez J, Tudhope AW. 2014 Corals concentrate dissolved inorganic carbon to facilitate calcification. Nat. Commun. 5, 5741. (doi:10.1038/ncomms6741)
48. Bonin MC. 2012 Specializing on vulnerable habitat: acropora selectivity among damselfish recruits and the risk of bleaching-induced habitat loss. Coral Reefs 31, 287–297. (doi:10.1007/s00338-011-0843-2)
49. Wisshak M, Scho¨nberg CHL, Form A, Freiwald A. 2012 Ocean acidification accelerates reef bioerosion. PLoS ONE 7, e45124. (doi:10.1371/journal.pone. 0045124)
50. Silbiger NJ, Guadayol O, Thomas FIM, Donahue MJ. 2014 Reefs shift from net accretion to net erosion along a natural environmental gradient. Mar. Ecol. Prog. Ser. 515, 33–44. (doi:10.3354/meps10999) 51. DeCarlo TM, Cohen AL, Barkley HC, Cobban Q,
Young C, Shamberger KE, Brainard RE, Golbuu Y. 2015 Coral macrobioerosion is accelerated by ocean acidification and nutrients. Geology 43, 7–10. (doi:10.1130/G36147.1)
52. Scho¨nberg CHL, Fang JKH, Carreiro-Silva M, Tribollet A, Wisshak M. 2017 Bioerosion: the other ocean acidification problem. ICES J. Mar. Sci. 74, 895–925. (doi:10.1093/icesjms/fsw254) 53. Ries JB, Ghazaleh MN, Connolly B, Westfield I,
Castillo KD. 2016 Impacts of seawater saturation state (VA ¼ 0.4–4.6) and temperature (10, 258C) on the dissolution kinetics of whole-shell biogenic carbonates. Geochim. Cosmochim. Acta 192, 318–337. (doi:10.1016/J.GCA.2016.07.001) 54. Yates KK, Zawada DG, Smiley NA, Tiling-Range G.
2017 Divergence of seafloor elevation and sea level rise in coral reef ecosystems. Biogeosciences 14, 1739–1772. (doi:10.5194/bg-14-1739-2017) 7 379 380 381 382 383 384 385 386 387 388 389 390 391 392 393 394 395 396 397 398 399 400 401 402 403 404 405 406 407 408 409 410 411 412 413 414 415 416 417 418 419 420 421 422 423 424 425 426 427 428 429 430 431 432 433 434 435 436 437 438 439 440 441
![Figure 1. Test of deriving [Ca 2 þ ] from abiogenic aragonites precipitated under various Ca 2 þ concentrations](https://thumb-eu.123doks.com/thumbv2/123doknet/14800990.606246/5.892.107.788.65.665/figure-test-deriving-abiogenic-aragonites-precipitated-various-concentrations.webp)