Publisher’s version / Version de l'éditeur:
ASTM Special Technical Publication, 254, pp. 254-271, 1960-12-01
READ THESE TERMS AND CONDITIONS CAREFULLY BEFORE USING THIS WEBSITE. https://nrc-publications.canada.ca/eng/copyright
Vous avez des questions? Nous pouvons vous aider. Pour communiquer directement avec un auteur, consultez la
première page de la revue dans laquelle son article a été publié afin de trouver ses coordonnées. Si vous n’arrivez pas à les repérer, communiquez avec nous à PublicationsArchive-ArchivesPublications@nrc-cnrc.gc.ca.
Questions? Contact the NRC Publications Archive team at
PublicationsArchive-ArchivesPublications@nrc-cnrc.gc.ca. If you wish to email the authors directly, please see the first page of the publication for their contact information.
NRC Publications Archive
Archives des publications du CNRC
This publication could be one of several versions: author’s original, accepted manuscript or the publisher’s version. / La version de cette publication peut être l’une des suivantes : la version prépublication de l’auteur, la version acceptée du manuscrit ou la version de l’éditeur.
Access and use of this website and the material on it are subject to the Terms and Conditions set forth at
Improved determination of preconsolidation pressure of a sensitive
clay
Hamilton, J. J.; Crawford, C. B.
https://publications-cnrc.canada.ca/fra/droits
L’accès à ce site Web et l’utilisation de son contenu sont assujettis aux conditions présentées dans le site
LISEZ CES CONDITIONS ATTENTIVEMENT AVANT D’UTILISER CE SITE WEB.
NRC Publications Record / Notice d'Archives des publications de CNRC:
https://nrc-publications.canada.ca/eng/view/object/?id=c9422f13-5ab8-47aa-a8d5-3da3ffaa1baa https://publications-cnrc.canada.ca/fra/voir/objet/?id=c9422f13-5ab8-47aa-a8d5-3da3ffaa1baa
no.
115
c . 2
NATIONAL
RESEARCH
COUNCIL
Bin2
CANADADIVISION O F BUILDING R E S E A R C H
IMPROVED DETERMINATION OF PRECONSOLIDATION PRESSURE
OF A SENSITIVE CLAY
BY
J. J. HAMILTON AND C. 6 . C R A W F O R D
REPRINTED FROM
AMERICAN SOCIETY FOR TESTING MATERIALS SPECIAL TECHNICAL PUBLICATION NO. 2 5 4 . 1959
P. 2 5 4
-
271 RESEARCH P A P E R NO. 115 O F THE DIVISION O F BUlLDlNG R E S E A R C H OTTAWA DECEMBER 1960 P R I C E 2 5 C E N T S N R C 5 5 2 8This p u b l i c a t i o n i s being d i s t r i b u t e d by t h e Division of Building Research of t h e National Research Council a s a c o n t r i b u t i o n towards b e t t e r b u i l d i n g i n Canada.
I t
should not be reproduced i n whole o r i n p a r t , without permission o f t h e ori- g i n a l publisher. The D i v i s i o n would be glad t o be of a s s i s t a n c e i n o b t a i n i n g such permission.P u b l i c a t i o n s of the Division of Building Research may be obtained by m a i l i n g the a p p r o p r i a t e remittance, ( a Dank, Ekpress
,
o r Post Off i c e Money Order o r a cheque made payable a t par i n Ottawa, t o t h e Receiver General of Canada, c r e d i t National Research council) t o t h e N a t i o r a l Research Council,Ottawa. Stamps a r e not acceptable.
A coupon system has been introduced t o make payments f o r p u b l i c a t i o n s r e l a t i v e l y s h p l e
.
Coupons a r e a v a i l a b l e i n denominations of5,
25, and50
c e n t s , and may be obtained by making a re- mittance a s i n d i c a t e d above. These coupons may be used f o r t h e purchase of a l l National Research Council p u b l i c a t i o n s i n c l u d i n g s p e c i f i c a t i o n so f
A u t h o r i ~ e d R e p r i n t from the Copyriglited Soils-19% Meetings
Spccial Tcclri~rcnl P?iblccnlro?s N o 3 4
Published by the
\VERIC,\\ SOCIET, TOR TLSTIXG ~ I A T E R I A L S
A
N
A
L
YZ
E
D
1959IMPliOVED D E T E R M I N A T I O N O F PRECONSOLIDATION PRESSURE O F A SENSITIVE CLAY
SYNOPSIS
Poor agreement between calculated and measured consolidation settlement in the Leda (Laurentian) clay of eastern Canada suggested that either the classical consolidatioil theory might not apply to this soil or that present test- ing techniques were not yielding the correct coilsolidatioil characteristics of the soil. An underestimation of tlie preconsolidation load was found to result from tests using normal procedures. An investigation of various techniques to improve the determinatiol~ of the precoilsolidatioil pressure are outliiled in this paper.
Iilcrelnent loading tests with various increment sizes and increment dura- tioils were investigated as tvell as continuous loading tests under various con- trolled rates of stress application and various controlled rates of strain. I t was found that small increment tests best dcfiiled the pressure - void-ratio curve, but required much time. A method of determining the point of 100 per cent primary consolidatioi~ on the log time - deflectioil plot of small iilcreme~lt
tests was developed. Constant rate of strain tests show promise as possible rapid testing techniques.
T h e marine clay of eastern Canada, called Leda clay, covers the broad, highly developed regions of the Ottawa and St. Lawrence River valleys. I t is therefore of considerable interest in foundation engineering. One of the not- able features of this clay is the occurrence of a n unusually sharp change in its com- pressibility a t the preconsolidatioll load. This suggests a complete failure of the soil skeleton and results in extremely high compressioil indices.
An extensive investigation of the settlement of the National AiIuseum
1 Research Officer, Soil ?vIcchanics Section, Division of Building Research, National R e - search Council. Ottawa, Ont. (Canada).
? IIead, Soil 3Ieclianics Section. Division of
Building Research, National Research Council, O t t a w a , Ont. (Canada).
Building in Ottawa by Crawford ( I ) ~
showed an unsatisfactory correlation be- tween computed a n d observed settle- ments. It was suggested t h a t the stand- ard consolidation test may yield incorrect values for preconsolidation pressure and compression index or that the standard consolidatiol~ theory may n o t apply a t all to this particular soil. A subsequent "field check" of the settlement of a large fill on a deep deposit of t h e marine clay confirmed t h e possible error in determin- ing the preconsolidation pressure by the standard laboratory test.
I n view of the serious discrepancies between the theoretical evaluation and field performance of Leda clay, a detailed laboratory investigation of its compres-
T h e boldface numbers in parentheses refer to t h e list of refercllces appended t o this paper. NRC 5528
sion properties was undertaken by the decreased the equilibrium void-ratio Division of Building Research of the under any particular stress. Van Zelst National Research Council. (9) reported that most disturbance was This paper discusses the factors that due to the remolding caused by trimming are known to affect test results and de- the flat faces of test specimens.
scribes the laboratory investigation.
I~zcremelzl Ratio and Duralion:
Sa?tz ple Disturbance:
In nature, clays usually exist in equi- librium under unequal principal stresses. The stress reduction and changes in principal stress ratio that occur due to soil sampling and specimen preparation are probably responsible for most of the disagreement between laboratory results and field observations.
Based on laboratory observations of compression, rebound, and recompression characteristics of soil specimens, Casa- grande (2) developed a graphical method for adjusting laboratory pressure - void- ratio curves to field conditions. Terzaghi
(3) questions the merits of this proce- dure and cites cases of serious disagree- ment. I t is defended by Casagrande and Fadum (4) as the only means of estimat- ing the preconsolidation history of a nat- ural clay deposit. Rutledge ( 5 ) quotes evidence in support of the procedure, and Schmertmann ( 6 ) has further devel- oped the interpretation originated by Casagrande. I t is now a generally ac- cepted treatment, although there is no doubt that large discrepancies may occur with certain types of soil especially if sampled at great depths.
The implications of stress changes due to sampling are discussed at length by Rutledge (7) and Terzaghi (8) in an at- tempt to visualize the pressure
-
void- ratio curve in nature and its relationship to the laboratory curve. Rutledge (7)concluded that sample disturbance tended to obscure the stress history and preconsolidation pressure of a soil and
From a considerable amount of re- search at the Massachusetts Institute of Technology, Taylor (lo) concluded that consolidation proceeds more slowly for small load increments than for large and that predictions of rate of settlement may be seriously in error unless load incre- ments in the test are essentially the same as in the field. Irregular increment dura- tions were found to introduce irregulari- ties in the test result. Most authorities agree that this should be standardized for any particular soil. Small load incre- ments have been suggested for soft soils by Burmister (11). The nature of load increments appears to have less effect on the amount of settlement. Tests on adjacent specimens of Boston Blue Clay reported by Casagrande and Fadum (4)
showed almost identical pressure - void- ratio curves, although one was consoli- dated in seven load increments in one week while the second was subjected to nearly 50 increments during an 85-day period.
The variation between rate of loading of an element of soil during deposition and during testing in the laboratory is invariably great. The fact that deep, rather uniform deposits of clay are found to exist in nature at almost constant void- ratio has led to the deduction that the difference between geological and labora- tory loading rates has a great influence on the compression index of a soil.
Terzaghi (12) postulated a "rigid bond" between the adsorbed water films sur- rounding the particles of undisturbed clay which is unbroken by slow loading during sedimentation. Stresses are there- fore able to increase along a flat pres-
sure - void-ratio curve. Disturbance and excessive stresses during a laboratory test however are thought to destroy the "rigid bond" and transform the clay into a "lubricated" state. In this condition the void-ratio change under pressure in- crements is much greater than in nature and the pressure
-
void-ratio curve may be very steep.Schmertmann (6) on the other hand concludes from c. detailed study of a normally consolidated organic silty-clay plus some supplementary evidence that
".
. .
many natural clays consolidate in the field along virgin slopes similar, if not identical, to those obtained from a completely undisturbed laboratory con- solidation test." From a study of water content decrease with depth in some borings in marine clay and from consoli- dation tests on undisturbed and artifi- cially sedimented specimens of the clay, Casagrande and Fadum (4) drew similar conclusions.Two opposite interpretations have been made on the basis of field evidence: either interpretation may be correct de- pending on the nature of the soil. I n view of the wide possibilities of interpre- tation between geological and laboratory test properties, the field consolidation of some natural soil deposits is an open question.
Gas Content:
Taylor (lo), Hvorslev (13), and Ter- zaghi (14) have suggested that the initial, almost instantaneous, compression which occurs under load increments may be largely due to gas bubbles in the speci- men. These gas bubbles may be found in organic soils or in soils having pore water which has percolated through organic soils.
Presumably, gases such as hydrogen sulfide, derived from the decomposition of organic matter, and dissolved air
which has been carried down into the pore water by percolation or seepage, ~vill remain in solution until a change in pressure or temperature alters the state of equilibrium. Gases will continue to be generated in organic soils until the pore water is saturated under the existing con- ditions of temperature and pressure. The saturation weight of gas dissolved in the pore water is directly proportional to the pressure (Henry's law) and inversely pro- portional to temperature of the pore water.
Telnperatz~re and Storage:
The temperature a t which laboratory tests are made usually differs appreciably from temperatures in the ground. Studies of the effect of this difference by Gray (15) and by Finn (16) show temperature to have an influence on both rate and amount of compression under load.
Undoubtedly, in some soils, the in- crease in temperature after sampling to- gether with the reduction in stresses re- sults in a slight volume increase due to expansion of gas bubbles and a release of gas from solution. Hvorslev (13) con- siders this problem in some detail. He discusses sampling and storage tech- niques to minimize the effect and sug- gests methods of correcting test results. Dawson (17) has considered the special case of storing and testing expansive soils.
The apparatus and testing teclmiques are factors which influence test results. Taylor (lo) investigated the effect of friction between the consolidation ring and the specimen and found some effect on pressure - void-ratio curves but little effect on rate of compression. Apparatus compressibility and seating of porous stones on the soil specimen are factors found to be worth taking into account.
Soil Material:
The tests reported in this paper were made on specimens trimmed from an undisturbed block sample of silty-clay of marine origin. The sample was carefully cut from a trench wall at a depth of 23 ft. I t is composed of more than one half clay-size particles, has a liquid limit of 48 per cent, a plastic limit of 25 per cent, and a water content range from 53 to 62 per cent. The pore water salt content is about 0.5 g per liter. The undisturbed shear strength by field vane, laboratory vane, and by unconfined compression is about 0.7 kg per sq cm, and remolded it is about 0.05 kg per sq cm. The sensi- tivity is therefore about 14. A complete series of triaxial compression tests on specimens from a block sample obtained just above this sample are reported sepa- rately by Crawford (18).
Sample Yreparatiotz:
Past esperience with the extremely sensitive Leda clay has shown that the best consolidation samples can be ob- tained by a method involving partial pretrimming followed by cutting of the sample with a sharp-edged consolidation ring. The pretrimining is done by hand using a wire saw and knife slightly ahead of the advance of the consolidation ring. The ring is held by a special device while it is pushed into the pretrimmed speci- men. Visual observation and comparison of test results with samples trimmed by other techniques have proved the superi- ority of this method. The two end sur- faces of the sample are cut to the same height as the consolidation ring by a fine wire saw with a minimum of planing with a steel straight-ed, me to assure a horizontal surface. The porous stones are then carefully aligned on the sample surface, positioned with a slight thumb
pressure, and the enclosed specimen carefully installed in the consolidation chamber.
Loading is carried out through a load- ing cap and ball bearing arrangement allo~vjng complete freedom of rotation of the porous stones. The first increment of pressure, usually 0.2 to 0.4 kg per sq cm is applied to the sample before the chamber is filled with water, thus elimi- nating any tendency of the sample t o slvell. Normally consolidated or lightly overconsolidated Leda clay a t its natural water content shows little or no tendency to s~vell when soaked in the consolidom- eter under these small loads. To assure greatest similarity in pretest conditions and in the quality of samples, this prepa- ration procedure was followed in every test by the same person.
Types of Tests:
Increwzelztal Loading-In normal rou- tine consolidation testing an increment ratio of one is used, that is,
9
= 1, Pwhere Ap is the load increment, and
p
is the previous total load. A typical load schedule of this type might be 0.2, 0.4, 0.8, 1.6, 3.2, 6.4, 12.8 kg per sq cm. I n addition to these normal tests, several tests were made using increment ratios of3, 5,
and&.
Co~zslant Rate of Stress.-Several tests mere made to study load-deflection char- acteristics using a uniform constant rate of stress increase. Loading rates ranging from nearly 3 kg per sq cm per hr to 0.1 kg per sq cm per hr were used.
Co?zsfatzt Rate of Strain.-Although re- quiring more elaborate apparatus, a
compression test at a constant rate of strain is more appropriate than a test a t constant rate of stress increase because at a controlled rate of strain the recom-
pression load can be applied quickly strain; above the preconsolidation pres- while the virgin compression load is sure the rate of strain is essentially con- applied more slowly, allowing time for stant and equal to the applied rate.
P r e s s u r e , k g per sq crn
FIG. 1.-Change in Void-Ratio - Log Pressure Relationship for A11 Incremental Loading Tests. 0. I 0.2 0.4 0.6 0.8 1 2 4 6 8 1 0 20
drainage of pore water. Several constant rate of strain tests were made at rates of virgin compression ranging from 0.3 per cent per hr to 9.0 per cent per hr.
In these tests there are really two rates of strain application: during recompres- sion the proving ring deflects consider- ably and the strain in the sample is therefore only a fraction of the applied
I
1
1 1 1 ) 1 1Tesl Apparatzts:
I
1
1 1 ' 1 1 1In all tests, the same type of consolida- tion ring and porous stones were used. The consolidation ring is of high quality stainless steel, especially chosen to resist corrosion by the soil and water of Leda clay samples. I t is 2 cm high with a cross- sectional area of 20.0 sq cm. The ring is patterned after one developed by the
0 . 0 0.1 +--.>-ex,+--
m-+Avew$.)
.
-
-
-
Initial Void- Ratio 0.2 8 3 - 3 2 - 2 A I. 6 0-
0 8 3 - 3 2 - 2 6 1. 70\
0 0.3 .- + y 2p
0 . 4 C .- a, 13 0.5 L 0 a,q
0.6 0 7 0 . 87
8 3 - 3 2 - 2 C 1.72-
8 3 - 3 2 - 2 D 1 . 82 A 8 3 - 3 2 - 2 E 1.66 A 8 3 - 3 2 - 2 F 1. 57-
8 3 - 3 2 - 2 G 1. 56 r 8 3 - 3 2 - I C 1. 6 8 + 8 3 - 3 2 - I D I. 8 5-
-
X 8 3 - 3 2 - 3 6 I . 56 x-
8 3 - 3 2 - 3 C I. 6 7-
--
-
Norwegian Geotechnical Inst, and fea- tures a sharpened cutting edge to facili- tate sample preparation. For this inves- tigation the ring was used as a floating ring with the two porous stones a t the top and the bottom having a radial clearance of 0.003 in. to allow free move- ment but a minimum of sample loss around the sides. The porous stones were 3-in. thick porous Alundum4 disks of me- dium hardness and grain size 150, with tapered edges to minimize the possibility of binding.
The incremental loading of samples was carried out in several lever type con- solidation frames. The constant rate of strain tests were made in direct-drive variable-speed triaxial compression presses. Tests at constant rate of stress increase were run either by manually ad- justing hydraulic bellows-type consoli- dometer or by loading with a constant rate of water flow into a tank hung on the loading arm of a lever-type con- solidome ter.
The relation between change in void ratio, that is, change in void ratio from beginning of test, and pressure for 11
increment loading tests is shown in Fig. 1. Load increment ratios were 1,
+,
and3,
with all increments being terminated after the rate of compression became less than 0.0006 in. per hr.This plot, although somewhat unusual since change in void ratio rather than actual void ratio has been plotted, was found to provide the best means of com- paring test ,results. The study of the eleven individual pressure
-
void-ratio curves, using the Casagrande graphical solution (2), resulted in a variation of most probable preconsolidation pressure'
Alundum is fused alumina made by meltingt h e mineral bauxite in a n electric furnace.
from 1.97 kg per sq cm to 2.78 kg per sq cm. By plotting the change in void ratio under each load increment for all tests and drawing an average curve through the points (curve A , Fig. 1) a preconsolidation pressure of 2.40 kg per sq cm is obtained. From other tests it has been found that the range of indi- cated preconsolidation values due to interpretation becomes larger as the pre- consolidation pressure increases, due to the nature of the log plot. The initial water content of the samples tested varied from 62.2 per cent to 52.8 per cent with the average being 57.0 per cent. I n spite of the rather large variation in the initial water contents of these sam- ples, it was found that the curve from the small increment tests could be fitted fairly closely to the curves for large incre- ment tests. Exceptions to this may be described as follows:
(a) For specimens a t higher than aver- age initial water content the laboratory recompression curve was steeper and the compression index was higher than aver- age.
(b) For specimens a t lower than aver- age initial water content the laboratory recompression curve was flatter and the compression index tilas lower than aver- age.
A comparison of all the pressure -
void-ratio curves from the increment tests showed that the size of increment has practically no effect on the shape of the curve. I t appears that there is a unique relationship between pressure and void ratio and that points on the curve representing this relationship for any particular soil can be determined by a variety of load increment sizes.
The averaged curve shown in Fig. 1 agrees very favorably with the pressure
-
void-ratio curve from the small incre-AP
ment test
(t
=&)
as can be seen in Fig. 2.The importance of establishing the technique on the log of time-deflection point of 100 per cent primary consolida- plot has proved satisfactory for Leda clay tion was demonstrated in this investiga- test results.
tion. The void-ratio calculated to repre- Figure 3 shows curves of square root sent 100 per cent primary consolidation of time-deflection and log time-deflec- varied considerably depending on the tion for several load increments in each
Pressure, k g p e r s q cm
FIG. 2.-The Shapes of Pressure - Void-Ratio Curves as Obtained by Large Increment and by Small Incrernellt Testing.
method chosen to establish this point on the time-deflection curves. In small in- crement tests and in large increment tests near the preconsolidation pressure, struc- tural breakdown rather than permeabil- ity seems to be the important factor controlling the rate of compression. I n these cases neither Taylor's fitting tech- nique on the square root of the time- deflection plot nor Casagrande's fitting
of three typical tests having load incre- ment ratios of 1,
9,
andA.
Taylor's square root of time-fitting technique has been carried out on each increment where possible. (Only a single square root of time scale has been plotted, although for more accurate interpretation of re- sults other scales were used.) I t was found impossible to apply Taylor's tech- nique to the results from sample 83-32-3H. T h e application of the illethod to flection a t the end of primary consolida- some of the other increinents may also tion was observed for load increments be seriously questioned because a just beyond the preconsolidation load straight-line portion was difficult to in- although a n arithmetic plot of the same terpret. data would indicate a substantial reduc-
Sample No. 83-32-2A
A P - 1 - - P S a m p l e No. 83-32-2F AP I = /3 (cl '%, min 0.0000~
, , ,
,
I Sample Na. 83-32-3H A P I -; p 110 0.0000 2.4/-2.61 2.61-2.80 ; 0.0500 100 per cant 2.80-5.00 3.81-4.21 100 .2/ - 4.6/ cent 0.1500~'
' '
1 0.1 1 10 100 1000 IOOOO L o g Time, min. Log Time, mln L o g T ~ m e , mlnFIG. 3.-Curves of Square Root of Time-Deflection and Log-Time-Deflection for Various Load Increments.
I t was necessary to develop a modifi- tion in the rate of compression with time. cation of Casagrande's fitting method to By examining many arithmetic plots of establish the point of 100 per cent pri- the time-deflection relationship and b y mary consolidation on the time-deflection calculating the rates of compression a t plot. Because of the nature of the semi- 100 per cent primary consolidation on logarithmic plot, no definite point of in- those increments that showed a point of
TABLE I.-COEI'PICIENTS CALCULATED BY TAYLOR'S SQUARE ltOOT OF T I I I E AIETIIOD AND BY TIIE MODIFIED CASAGRANDE METIIOD.
Test Increment, kg per sq cm
C,. , sq cm per sec
II
A u , s q c m p e r g K, cm per secModified Log T i e
inflection on the log time-deflection plot (thus allowing the use of Casagrande's technique) a rate of 0.0008 in. per hr per in. height of specimen was found to rep- resent the end of primary consolidation. For a specimen 2 cm high, a rate of 0.0006 in. per hr was therefore chosen as the end of primary consolidation. This method proved to have three distinct advantages :
1. I t clearly defined the point of 100 per cent primary consolidation in all in- crements regardless of increment size or position with respect to the preconsolida- Once the rate representing the end of primary consolidation had been estab- lished (that is, 0.0006 in. per hr) a curve was plotted on a sheet of the same trans- parent semi-logarithmic paper used to plot the log time - deflection curve, so that a tangent plotted a t any point on the curve would have a slope equal to 0.0006 in. per hr. The procedure in de- termining 100 per cent primary consoli- dation was then simply to place the log time - deflection plot for any increment over this constant-rate curve and to de- termine the point of tangency of the two curves (see dashed curve for increment 1.20 kg per sq cm to 2.40 kg per sq cm in test No. 83-32-2A in Fig. 3).
2. I t allowed imrnediate application of the next increment of load as soon as the point of 100 per cent primary consolida- tion had been reached and thus saved the considerable time that would nor- mally be required to establish the straight-line portion of the secondary compression branch on the log time - de- flection plot.
3. I t allowed a simple standard test procedure.
Using the above modification to Casa-
-
grande's technique, values for void ratio a t 100 per cent primary consolidation were caiculated. 1n all the increments shown in Fig. 3, however, the durationof each increment was approximately 24
hr in order to compare this technique with the commonly used 2 4 h r increment. Values of the coefficient of consolida- tion, coefficient of compressibility, and the coefficient of permeability were cal- culated for each increment by Taylor's method and by the modified Casagrande method (Table I).
Tests o n Cogzsla~zi Rule o j Stress:
To investigate possibilities for the "rapid" determination of the preconsoli- dation pressure, a series of continuous loading tests was made using a constant- rate-of-stress-increase type of loading with rates of loading ranging from 2.7
kg per sq cm per hr to 0.14 kg per sq cm per hr. The most rapid test lasted ap- proximately 24 hr while the slowest ran for 2 days. T o be of value, this type of test must give a reliable value for the preconsolidation pressure in less than 3
days, since a conventional increment test can be carried out in this time.
Tests run a t a constant rate of stress application throughout their loading schedule do not take advantage of the almost elastic time-deflection relation- ship a t loads below the preconsolidation pressure, and unless the loading equip- ment is capable of varying the rate of loading during the test, the procedure is not particularly efficient.
I t was found in the constant-rate-of- stress tests that as the rate of loading decreased the break in the pressure
-
void-ratio curve took place a t lower val- ues of pressure than before. At the lowest rate of loading the preconsolidation pres- sure determined from the log pressure -void-ratio curve was 2.91 kg per sq cm. This value is considerably higher than that indicated by any of the increment tests. I t was thought that although the rate of loading was very slow, excess pore pressure must have been built up. At pressures greater than preconsolidation
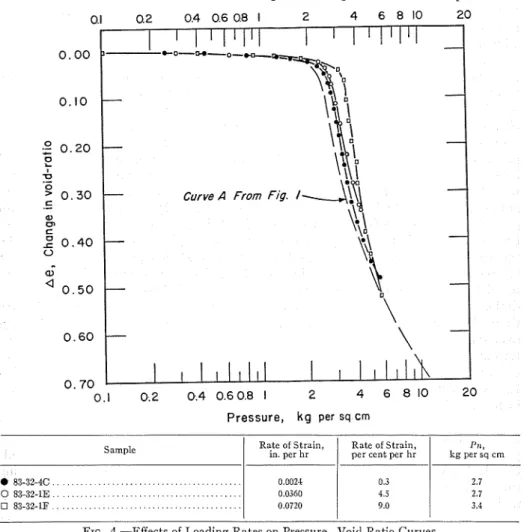
pressure the applied load did not accu- can be selected. Tests were run at rates rately represent effective stresses. Since varying from 0.072 in. per hr to 0.0024 pore-pressure measurements were not in. per hr. Figure 4 shows the relatioilship made, the true effective stresses could between change in void-ratio and pres- not be calculated, and for the time being sure for three tests run a t various rates. a t least the technique has been aban- The test run at the highest strain rate doned. gave the highest "indicated" preconsoli-
Sample
I
Rate of Strain, in. per llr1
Rate of S t r a i n , per cent per brI
kg per sq cnl P s ,FIG. 4.-Effects of Loading Rates on Pressure - Void-Ratio Curves.
Cofistafit Rate of Straifi Tests: gation pressure, and it is believed that
The investigation of test some excessive pore pressure existed in this test specimen. In spite of great differ- methods included several tests run under
ences in rates, the two curves for the controlled rates of strain. The advantage rates of strain give
of a constant-rate-of-strain test lies in values for tile preconsolidation pressure the fact that little time is required to of 2.7 kg per sq cm. The slight difference reach the preconsolidation load, and the in their shapes could be caused by differ- rate of strain during virgin compression ences in initial water content and grain
size. Even a t the slowest rate of testing, ment tests. Xeither color differences nor the indicated preconsolidation pressure differential shrinkage were observed in was definitely higher than the highest the tests a t coiltrolled rate of strain or value obtained by incremental loading. stress.
For comparison the "average" curve I t is thought that the observed discon- from the incremental tests (curve A, Fig. tinuity in some specimens is due to differ-
1) is also plotted on Fig. 4. ential shrinkage during oven drying and
FIG. 5.-Differential Shrinkage of Oven-Dried Sample.
Sl>erinren an left subjected to incrcinmtal lording
($
= I) , s u e r i ~ r ~ e o on right tested by aconti~luous load increase.
D ~ s c u s s ~ o x o r RESULTS that this resulted from unequal consoli-
S t ~ e s s e s irz t h e T e s l S p e c i m e t l :
During this study it was noticed that the shape and appearance of the oven- dried test specimens depended 0.11 the method of test. Specimens that had been subjected to incremental loading, when oven dried, revealed a dark ring of soil a t mid-height around the perimeter. This ring of soil appeared to have shrunk more than the rest of the specimen after oven drying and in many cases it fell away leaving a spool-shaped specimen as shown in Fig. 5. This phenomenon was observed more clearly in the larger increment tests than in the small incre-
datioil in the specimen. I t is presumed that the uneclual consolidation was due to unequal stress distribution in the specimen during testing and that this resulted from the boundary conditions iiltroduced b y the consolidation ring.
As a possible esplanation of the above phenomenon the following stages of movement are visualized after each load increment. First the entire load incre- ment is carried by the pore water. An instant later the pore water pressure de- creases substantially a t the drainage faces and effective stresses a t the faces are increased suddenly. This results in an increased effective stress normal t o
the consolidation ring near to the drain- age faces. No change has yet occurred a t the mid-plane. The increasing effective stress introduces an increment of friction which will transfer some of the normal load from the specimen to the consolida- tion ring. I t is this manner of increasing friction that is thought to cause unequal internal stress distribution and resulting unequal consolidation in the specimen. The effect is cumulative throughout the
Gas in the Test Specimen:
Examination of many consolidation tests on Leda clay led to the belief that gas bubbles were playing an important role in the shape of the recompression curve. An examination of the square root of time versus compression and log of time versus compression curves for these tests revealed a high "initial compres- sion." The loading apparatus and porous stones used in the standard floating-ring
In. x
FIG. 6.-"Initial" Gas Compression zlersus Pressure at Pressures Below the Preconsolidation Pressure
loading. Since the base plate and loading cap are relatively rigid a certain amount of lateral adjustment within the sample must take place.
I n tests a t constant rate of stress or strain the effective stresses within the specimen increase uniformly with applied stresses (pore pressures assumed to be zero). While friction will still exist during continuous loading the discontinuity in effective stresses due to pore pressure dissipation will not occur and a major cause of unequal consolidation is re- moved.
consolidation test were calibrated for compressibility, and it was found that, although significant, this correction could only partially explain the initial com- pression. The possibility of soil particles being squeezed into the porous stones was next investigated to find out whether this action might result in a significant "seating correction." The use of fine- grained porous disks resulted in a ''smooth" contact between sample and stone, and an investigation of the dry weight of the porous stones before and after consolidation tests revealed no sig-
nificant loss of soil solids to the porous stones. I t was concluded that the com- pression of gas bubbles must be of con- siderable importance, making up as much as 80 per cent of the "initial" compression in the recompression load increments.
An investigation of all the incremental type tests on the block sample was car- ried out in an attempt to evaluate the amount and significance of the compres- sion of gas bubbles. The cumulative initial compression for any load incre- ment was calculated by summing the amount of compression taking place in the first
&J
min of load application for each load increment u p to and including the applied pressure in question. A curve expressing the total correction for com- pressibility of apparatus was found by calibration. Figure 6 is a plot of the difference between the cumulative initial compression values and the cumulative apparatus compressibility and is there- fore a presentation of the cumulative "initial gas compression" verszts applied pressure. At pressures above the precon- solidation pressure, the amount of initial compression was about equal to the dif- ference between the zero point (com- puted by assuming a parabolic curve) and the&
min reading.The slope of the average curve through the data on Fig. 6 is expressed by the equation:
c, = 0.0023P
where :
c, = total initial gas compression, in., and
P = applied pressure, kg per sq cm. The average sample height during these tests was 0.790 in. Therefore in terms of unit values:
Co = 0.0029P
where :
C o = unit initial gas compression due to unidirectional compression, and P = applied pressure, kg per sq cm.
This formula, when used to calculate "initial" compression of a 100-ft-deep deposit of Leda clay subjected to recom- pression by the construction of a 20-ft- high embankment gave encouragingly close agreement with the measured com- pression. The calculated compression was 23 in. and a settlement of 2 in. was meas- ured b y accurate field instrumentation.
Effecis of Leaching o n Compressio~t In- dices:
To determine whether the geological pressure - void-ratio relationship was the same as that found for virgin compression in the consolidometer, the relationship between effective stress and void ratio was calculated for several natural de- posits of Leda clay in the Ottawa area. I t was found that there was a great difference in the compression indices ob- tained by these two methods; the labora- tory indices were many times higher than those implied b y field conditions. For this deposit of clay these observa- tions tend to confirm Terzaghi's hypothe- sis (12) and refute Schmertmann's theory
( 6 ) on the relationship between geological and laboratory virgin compression, and the following explanation is offered.
Geological opinion is that Leda clay was deposited in brackish water. A t depth some deposits of the clay in the Ottawa area yield pore-water salt con- centrations a s high a s 15 g per liter while the upper layers contain less than 1 g of dissolved salt per liter of pore water. This indicates that the clay has under- gone considerable leaching subsequent to deposition. Skempton and Northey (19)
have shown that the action of leaching is that of developing a meta-stable struc- ture which is extremely sensitive to re- arrangement of particle orientation caused by stress charges or remolding.
I t is suggested that under loads causing virgin compression of a clay which has been leached subsequent to deposition, significant changes take place in the
microstructure from the flocculated to a more dispersed state as visualized by Lambe (20). This collapse of structure will result in large changes in void ratio under relatively small increases in load. The result of leaching following geologic consolidation is, therefore, to give very high virgin compression indices at loads slightly greater than the maximum geo- logical loading.
Field void ratios are the result of con- solidation under geological rates of sedi- mentation a t the depositioilal pore-water salt concentration. Laboratory virgin compression void ratios are the result of consolidation of the leached clay under very much higher rates of compression. The consolidation indices determined in the laboratory may or may not be rep- resentative of the in sitzt characteristics, depending on how closely laboratory rates agree with field stress conditions. Incremental loading of even very small increment ratios may have serious effects on their meta-stable structure with the high pore pressures created by loss of strength of the structure contributing to the rearrangement of particle orientation.
A study of laboratory methods of de- termining the preconsolidation pressure of a natural clay is incomplete without some full-scale field investigations to pro- vide absolute values on which to evaluate the laboratory results. One high earth embankment on a deep deposit of Leda clay has already yielded valuable infor- mation regarding the preconsolidation pressure and the reconsolidation charac- teristics of this clay. Briefly this investi- gation has shown that previous labora- tory techniques and interpretation of laboratory data have tended to result in (a) An underestimation of the precon- solidation pressure owing to difficulties involved in determining 100 per cent primary consolidation a t loads near the
preconsolidation pressure and to errors in interpreting the pressure - void-ratio curve when large increments of load are involved.
(b) An overestimatioil of reconsolida- tion settlements owing to test errors re- sulting from compressibility of apparatus and compression of gas bubbles in the specimen.
The construction and instrumentation of another high embankment fill which will undergo considerable virgin compres- sion is planned. This will provide ailother field check with which to evaluate labora- tory testing techniques used to determine the preconsolidation pressure and virgin consolidation indices.
1. Experience with a sensitive marine clay shows the need for extreme care in sampling, handling, and trimming test specimens to obtain good test results for the preconsolidation pressure of the un- disturbed clay.
2. The size of load increments in incre- mental loading tests does not affect the pressure
-
void-ratio curve, but the inter- pretation of most probable preconsolida- tion pressure becomes more difficult as load increments become larger. In gen- eral when load increments are large. esti- mates of the most probable preconsolida- tion pressure are too lo~v.3. Initial water content of specimens from the same block sample affects the slope of the recompression and virgin compression curves.
4. A systematic method of determin- ing the end of primary consolidation under a load increment is essential and such a method has been developed.
5 . Rapid methods for obtaining a sat- isfactory value for preconsolidation pres- sure of this clay were investigated and found to show promise. The best rapid method seems to be a controlled-strain type of test.
6. There are indications of more seri- ous stress variations through a test speci- men during incremental loading than during continuous loading and this may result in an underestimation of precon- solidation pressure. Further work must be done to verify this.
7.
Test results indicated that gas bubbles in test specimens call account for most of the initial compression ob- served a t loads below the preconsolida- tion load.8. There are indications that the leaching of salt from the pore water after deposition has led to the development of a meta-stable structure in the clay and that this change prevents the determina- - .
tion of the geological pressure - void-ratio curve by laboratory testing and is re- sponsible for the extremely high com-
pression indices found for virgin compres- sion.
The authors are indebted to their col- leagues in the Soil Mechanics Section, Division of Building Research, for their assistance in obtaining samples and in the laboratory testing associated with the study. They wish to express their appreciation to B. J. Bordeleau for his assistance in the laboratory testing pro- gram. Grateful acknowledgment is also made to R . F. Legget, the Director of the Division, for continued encourage- ment in this study and with whose approval this paper is published as a contribution from the Division of Build- ing Research, National Research Council of Canada.
REFERENCES
(1) C. B. Cralvford, "Settlement Studies on Sampling t o Laboratory Testing," Trans- the National 31useum Building, Ottawa, aclions, Am. Soc. Civil Engrs., Vol. 109,
Canada," Proceedings, Third International pp. 1155-1183 (1944).
Conference on Soil Mechanics, Zurich (8) K. Terzaghi, discussion of P. C . Rutledge, (Switzerland), Vol. 1, pp. 338-345 (1953). "IZelation of Undisturbed Sampling t o (2) A. Casagrande, "The Determination of Laboratory Testing," Transachions, Am.
the Preconsolidation Load and its Prac- Soc. Civil Engrs., Vol. 109, pp. 1197-1201 tical Significance," Proceedings, First In- (1944).
ternational Conference on Soil Alechanics, (9) T . W. Van Zelst, Investigation of t h e Cambridge, illass., Vol. 3, pp. 6&64 (1936). Factors Affecting Laboratory Consolida- (3) K. Terzaghi, discussion of A. Casagrande tion of Clay," Proceedings, Second Inter- and R. E. Fadum, "Application of Soil national Conference on Soil Mechanics, Mechanics in Designing Building Founda- Rotterdam (The Netherlands), Vol. 7, pp. tions," Transactions Am. Soc. Civil Engrs., 52-61 (1948).
Vol. 109, pp. 427-435 (1944). (10) D. W. Taylor, "Research on Consolidation (4) A. Casagrande and R . E . Fadum, "Appli- of Clays," Mass. Inst. Technology, Serial
cation of Soil Mechanics in Designing Build- 82 (1942).
ing Foundations," author's closure, Truizs- (11) D. M. Burmister, "Suggested Methods of
actions, Am. Soc. Civil Engrs., Vol. 109, Test for Consolidation of Soils," Procedures pp. 4 6 3 4 9 0 (1944). for Testing Soils, Am. Soc. Testing Mats., (5) P. C. Rutledge, "Relation of Undisturbed Compiled by ASTM Committee D-18, pp.
Sampling to Laboratory Testing," author's 287-295 (1958).
closure, Transactions, Am. Soc. Civil Engrs., (12) K. Terzaghi, "Undisturbed Clay Samples Vol. 109, pp. 1208-1216 (1944). and Undisturbed Clays," J o ~ r r n ~ l , Boston (6) J. H . Schmertmann, "The Undisturbed Soc. Civil Engrs., Vol. 28, No. 3 (1944).
Consolidation Behavior of Clay," Trans- (13) >I. J. Hvorslev, "Sub-surface Exploration
actions, Am. Soc. Civil Engrs., Vol. 120, pp. and Sampling of Soils for Civil Engineer-
1201-1233 (1955). ing Purposes," Waterlvaps Experiment
(14) K. Terzaghi, "Theoretical Soil i\Iechanics," John Wiley and Sons, Inc., New York, N. '1'. (1942).
(15) H. Gray, "Progress Report on Research on the Consolidation on Fine-Grained Soils," Proceedings, First International Conference on Soil Mechanics, Cambridge, Mass., Vol. 2, pp. 138-141 (1936). (16) F. N. Finn, "The Effect of Temperature on
the Consolidation Characteristics of Re- molded Clay," Symposium on Consolida- tion Testing of Soils, Am. Soc. Testing Mats., pp. 65-71 (1951). (Issued as sepa- rate publ~cation ASTM S T P ilTo. 126.)
(17) R . F. Dawson, discussion of P. C. Rutledge, "Relation of Llidisturbed Sampling to Laboratory Testing," Tra~zsaclio~~s, Am. Soc. Civil Engrs., Vol. 109, pp. 1190-1193 (1944).
(18) C. B. Cravford, "The Influence of Rate of Strain on Effective Stresses in Sensitive Clay," see p. 36, this publication. (19) A. W. Skempton and R . D. Northey, "The
Sensitivity of Clays," Ge'olecltniqzle, Vol. 3, No. 1, pp. 30-53 (1952).
(20) T . W. Lambe, "The Structure of Inorganic Soil," Proceedi~zgs, Am. Soc. Civil Engrs., Vol. 79, No. 315 (1953).
Authorized Reprint from the Copyriglited Soils-1959 Meetings
Special Techtrical Publicaliorr No. 254
Published by t h e
AMERICAN SOCIETY FOR TESTING MATERIALS
1959
DISCUSSION MR. M. D. MORRIS.'-I still do not
quite understand and I wish the authors would explain in a little more detail, just what it is that is causing that hour-glass effect in the specimen.
MR. CARL B. CRAWFORD (author).- I am sorry that I have not made clear the reasons suggested in the paper for the development of the "spool" or "hour glass" shape by some specimens after oven drying. This is believed to be due to boundary conditions introduced by the consolidation ring which result in unequal consolidation of the specimen. when the specimen is dried the part next to the ring shrinks more than the part near the center of the specimen. This differential shrinkage causes a flaking-off of a portion of the specimen leaving the 'c~pool" shape.
MR. CARL A. CARPENTER."YOU used one word iust now that was not in vour presentation. You mentioned "flaking off." If the hour-glass shape resulted from flaking off, I think this clarifies the whole thing.
MR. CRAw~o~D.-Perhaps "flaking off" does not give the exact interpreta- tion. It did not come off in very thin
1 Materials Equipment Consultant, New
York, N. Y.
Bureau of Public Roads, Division of Phys- ical Research, Washington, D . C.
flakes, it more generally came off in small chunks.
MR. CARPENTER.-That is the point. Since there was quite an appreciable loss of material, it appears t h a t t h e hour-glass shape resulted from this loss rather than from some less readily explainable cause. MR. RONALD C. HIRSCHFELD~ (by
letter).-The comments which the au- thors have made concerning the effect of gas in the test specimen and the effects of leaching on the compression index are especially valuable. I t is hoped that they will undertake more comprehensive studies of these factors.
The new definition for 100 per cent consolidation which the authors propose does not appear to take into account fully the basic assumptions of the theory of consolidation. In the theory of con- solidation it is assumed that the time lag is solely that associated with the squeez- ing of the water out of the voids of the soil. Secondary time lag is ignored. The common definitions of 100 Der cent con- solidation for> laboratory consolidation tests are somewhat arbitrarily chosen so that we can apply the theory of consoli- dation to that part of the laboratory test in which the primary hydrodynamic time
Instructor in Soil Mechanics, I-Iarvard University, Division of Engineering and Al3ylied Physics, Cambridge, ,Mass.
DISCUSSION OF PRECONSOLIDATION PRESSURE OF SENSITIVE CLAY 271
lag clearly overshadows the secondary crement tests and at pressures near the time lag. If the primary time lag is very preconsolidation pressure by the usual small compared to the secondary time method that an empirical relation be- lag, the theory of consolidation can no tween rate of deformation and 100 per longer be applied to the analysis of the cent primary consolidation (in tests test results and any definition of 100 per where the usual method was satisfactory) cent consolidation would seem to have was sought. This rate proved to be con- little significance. sistently of the order of 0.0008 in. per
MR. CRAWFORD (author's closure).- hr per in. height of sample for the soil The authors appreciate Mr. Hirschfeld's under study. The same value should not questioning of the "new definition for 100 be expected to apply to all soils. per cent consolidation" but must point I t must be admitted that the reasons out that an effort has been made to re- for the obscure "end of primary consoli- tain the original concept of 100 per cent dation" in certain tests are not clear. I t primary consolidation. I t was because of is for this reason that efforts are being the impossibility of determining 100 per made to check laboratory values by full cent primary consolidation for small in- scale field measurements.