READ THESE TERMS AND CONDITIONS CAREFULLY BEFORE USING THIS WEBSITE. https://nrc-publications.canada.ca/eng/copyright
Vous avez des questions? Nous pouvons vous aider. Pour communiquer directement avec un auteur, consultez la première page de la revue dans laquelle son article a été publié afin de trouver ses coordonnées. Si vous n’arrivez pas à les repérer, communiquez avec nous à PublicationsArchive-ArchivesPublications@nrc-cnrc.gc.ca.
Questions? Contact the NRC Publications Archive team at
PublicationsArchive-ArchivesPublications@nrc-cnrc.gc.ca. If you wish to email the authors directly, please see the first page of the publication for their contact information.
NRC Publications Archive
Archives des publications du CNRC
This publication could be one of several versions: author’s original, accepted manuscript or the publisher’s version. / La version de cette publication peut être l’une des suivantes : la version prépublication de l’auteur, la version acceptée du manuscrit ou la version de l’éditeur.
Access and use of this website and the material on it are subject to the Terms and Conditions set forth at
Load distribution test Sussex Street Bridge, Ottawa, Canada
Houston W.D.; Schriever, W. R.
https://publications-cnrc.canada.ca/fra/droits
L’accès à ce site Web et l’utilisation de son contenu sont assujettis aux conditions présentées dans le site LISEZ CES CONDITIONS ATTENTIVEMENT AVANT D’UTILISER CE SITE WEB.
NRC Publications Record / Notice d'Archives des publications de CNRC:
https://nrc-publications.canada.ca/eng/view/object/?id=b199861c-f9d5-459b-837e-06a5b4ee4ca5 https://publications-cnrc.canada.ca/fra/voir/objet/?id=b199861c-f9d5-459b-837e-06a5b4ee4ca5
Ser
TH1
N2lr2
no.
51
c. 2
BLDGNATIONAL
RESEARCH
COUNCIL
C A N A D ADIVISION O F BUILDING RESEARCH
LOAD DlSTRlBUTlON TEST SUSSEX STREET BRlDGE
OTTAWA, CANADA
BY
W.
D. H O U S T O N A N D W. R. S C H R I E V E R
REPRINT FROM PROCEEDINGS O F JWORLD CONFERENCE ON PRESTRESSED CONCRETE
JULF
1 9 5 7 . PART 1 1 .SECTION V. P. 20
-
1 TO 20-
1 1 .R E S E A R C H P A P E R NO. 5 1
O F THE
DIVISION O F BUILDING RESEARCH
OTTAWA
FEBRUARY
1958P R I C E 25 C E N T S N R C 4 6 5 6
7 .>,, *%; > ,., ?=*
This p u b l i c a t i o n
i s
being d i s t r i b u t e d
by
t h e Division of Building Research of t h e National
Research Council a s
a c o n t r i b u t i o n towards b e t t e r
b u i l d i n g i n Canada.
It
should not
be
reproduced
i n whole or i n p a r t , without permission of t h e o r i -
g i n a l publisher.
The D i v i s i o n would be glad t o be
of a s s i s t a n c e i n o b t a i n i n g such permission,
P u b l i c a t i o n s of t h e Division of Building
Research may be obtained by mailing t h e a p p r o p r i a t e
remittance,
( a Dank, Fkpress, o r Post Office Money
Order o r a cheque ma.de payable a t par
5.n
Ot.tawa,
t o t h e Receiver General of Canada, c r a d i t N a t i o n a l
Research c o u n c i l ) t o t h e N a t i o r a l Research Council,
Ottawa.
Stanlp a r e not acceptable.
A
coupon system has been introduced
t o
malce payments f o r p u b l i c a t ions r e l a t i v e l y s h p l e
,
Coupons a r e a v a i l a b l e i n denominations of
5 9
259
and
c e n t s ,
and may be obtained by
making a
re-
mittance a s i n d i c a t e d above.
These coupons
m y
be
used f o r t h e purchase of
a l l N a t i o n a l Research
Council p u b l i c a t i o n s i n c l u d i n g s p e c i f i c a t i o n s
o f
LOAD DISTRIBUTION TEST LOADING
SUSSEX STREET BRIDGE
OTTAWA, CANADA
W. D. I-Iouston* and W.R. S c h r i e v e r w
SUMMARY
This paper describes a rather unusual full-scale load- ing test on a bridge. One simply supported span of t h e bridge was subjected to a series of static loads, in t h e form of two heavily loaded trucks, in order to deter- mine the transverse load distribution characteristics of the span. T h e test results show that theoretical a n d actual performance were i n rather close agreement for the case of symmetrical loading a t the c e n u e of the bridge. Under eccentric loading, i. e . , loading near t h e e d g e of t h e bridge, the actual distribution was sig- nificantly less severe than that obtained by analytical methods.
INTRODUCTION
T h e load distribution test described in this paper was carried out on t h e north span of one of t h e two. three-span bridges on Sussex Street, which cross the Ri- deau River a t Green Island, Ottawa. The South Bridge consists of three identical 72 ft. 10 in. long skew spans. T h e North bridge, on which the test took p l a c e , c o n - sists of three identical 8 6 ft. 7 in. right spans. Each span is comprised of 1 8 simply supported prestressed concrete beams, post-tensioned using the Magnel-Blaton or Bel- gian system. T h e beams were prestressed transversely a t diaphragms after erection, in order to produce slab a c - t i o n under load. T h e beams which a r e of modified I - section (Appendix B) were erected with their top flanges nominally 1 in. apart. These interstices were dry-packed prior to the application of the transverse prestress. Thus t h e flanges form the deck of the structure. T h e general contractor for the construction of the bridges for the C i t y of Ottawa was Key Construction Ltd. T h e bridges were designeii and built under t h e supervision of the Precompressed Concrete Engineering Company, L td. T h e investigation was carried out jointly by the Division of Building Research, National Research Council, and t h e Research Division, Hydro-Electric Power Commis- sion of Ontario.
T h e test loading consisted of two ready-mix con- crete trucks carrying a l o a d of aggregate. Each uuclc weighed approximately 31.670 Ibs.
,
and h a d a rear to front axle load distribution of about 4:l. Figure a , 2 diagrammatic sltetch of the test span, shows t h e location of both truclts for beam 5 loaded (Load 3-
s e e below). As shown in t h e figure, the trucks were placed paralleI to the bridge in a way such that the wheels straddled the b e a m designated as loaded. T h e rear a x l e of each truck was placed vertically above the diaphragm cIo- sest to midspan. The test loads for which deflections were measured were as noted below:Load 1
-
No loadLoad 2 - One truck on b e a m 5
Load 3 - Two trucks on beam 5
Load 4
-
No load Load 5-
No loadLoad 6 - Two trucks on tieam 9 Load 7
-
No loadLoad 8 - Two trucks on beam 7
Load 9 - No load
T h e need for noload or reference readings as indicated above b e c a m e apparent from a preliminary investiga- tion of t h e behaviour c f the span during a 24-hour per- iod a few days prior to the test. This showed that de- flections caused by changes i n the ambient temperature durlng t h e t i m e which it was expected would elapse while a c o m p l e t e s e t of measurements was being made, would be of t h e same order as the deflections arising from the application of the l i v e load. Consequently, it was not considered sufficiently accurate t o follow through the original idea of deducing the behaviour of the un-
loaded test span from a knowledge of the no load ther- mal deflections of the structurally identical adjacent centre span.
MEASUREMENTS
Deflection measurement stations were located ' a t the points shown in Fig. 1. T h e round-headed pins a t these stations were installed using a "Ramset" type fas- tener. Deflections were measured using two Wilde N I11 precise optical levels and Invar staves to the bottom of e a c h cf which was attached a conical s e a t which matched t h e deflection pins. One level was s e t up a t midspan near the edge of the test span, while the sec- OW. D. Houston, formerly of the Hydro-Electric Power
ond was situated on t h e centre span. T h e fixed refer- Commission of Ontario, Toronto, and
ence reading to which a l l readings were related was -
"W. R. Schriever, Division of Building Research, Nation- taken on the side of the pier supporting t h e test and
W O R L D C O N F E R E N C E O N P R E S T R E S S E D C O N C R E T E
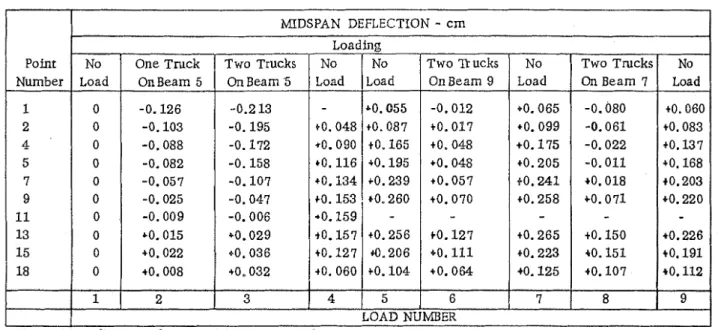
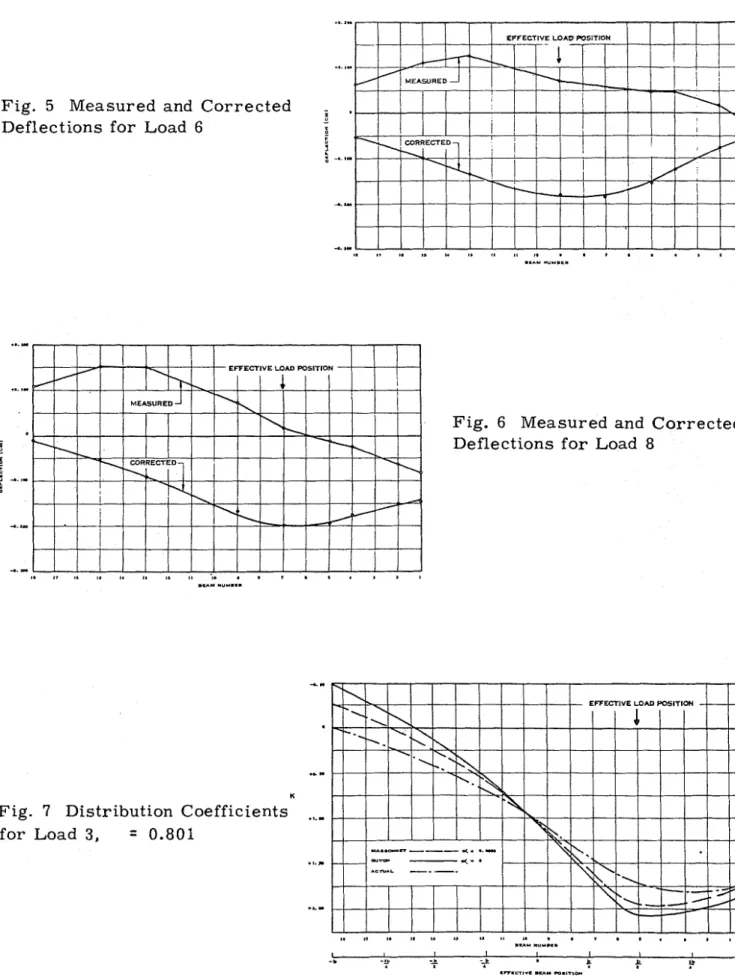
RESULTS AND DISCUSSIONThe results are given in Table 1 and are presented gaphically in Figs. 2 to 6. Figure 2, which is.a plot of the variation in no load deflection with time, also shows the time at which each load was applied. Linear interpolation between these no load points gives the true no load deflection which would have prevailed had the bridge been unloaded a t that time. Reasoning thus, the corrected points for loads 2, 3 , 6, and 8 (Figs. 3 to
6) were plotted. Only a t this stage was a smooth curve drawn through the plotted points, though it will be noted that very little smoothing out of the curves was required,
For beam 5 loaded, deflections were measured after each truck was placed on the span. By so doing i t was hoped to obtain a check on the linearity of the rela- tionship between load and deflection at midspan, Both trucks were placed symmetrically about midspan and they theoretically should have produced equal midspan deflections. That linearity did not exist is shown by Fig. 4 in which one corrected curve (A) represented the midspan deflection of the beams under a load of two trucks (Load3 ),while the other corrected curve (B) was obtained by doubling the ordinates of the deflection curve in Fig. 3 for one truck (Load 2). This discrepancy cannot be readily explained. However, it is pointed out that these trucks were the first loads of any mag- nitude to which the bridge had been subjected and it is considered likely rhat had the trucks been driven back and forth across the bridge a few times prior to the test in order to "cycle" or "work" the bridge, the results for the trucks on beam 5 wodd have been as consistent as those for the two subsequent test loads. (See later). The fact that the corrected curves in Fig. 4 are essentially parallel, and that the deflections for the first rruck are more than half of those for two trucks would suggest that some settlement took place under the initial load, although deflection measurements at the ends of some of the beams showed that no significant movements oc- curred a t those points.
'The accuracy of the deflection curves given in Figs. 3 to 6 may be checked in two ways, the first of which
0.315 cm. equally distributed among the 1 8 beams
-
and this seems justified by the more or less constant discrepancy between the two corrected curves in Fig. 4-
the final corrected curve is obtained.It is interesting to note that the effective modulus of elasticity for the bridge may be calculated knowing the value of t 6 . The calculation, which is given in Appendix A gives a value for:
concrete
=
8.03 xl o 6
psi.The second check may be carried out using Max- well's Theorem of Reciprocal Displacements (1) which states that the displacement a t any point N in a partic- ular direction due to unit load applied at a point M in a second direction, is equal to the displacement of M in the second direction due to unit load applied at N in the first direction. Strictly speaking the theorem is not applicable to the type of loading used in the investiga- tion, but is considered sufficiently accurate t o serve as a guide. Applied to the bridge, the theorem may be written thus:
where 8 is the deflection, t h e subscript defines the point at which the deflection is measured, and t h e super- script defines the load position, the latter being ex- pressed as beam numbers. The reciprocity checks for Loads 6 and 8 are given below.
7 (1) 6 ; 0.175 cm.. 6 = 0.180 cm. 9 7 9 (2)
a
: 0.150 cm.,
6; = 0.150 c. 12The check (2) is obtained by symmetry.
It w i l l be noted that agreement is good, the max- imum error being 3 per cent. This does give some in-
dication of the reliabilityof these results. T h e recipro- city checks on Fig. 4 for Load 3, (final corrected curve), while not so accurate as the previous ones, are considered satisfactory.
was used to produce the final corrected curve in Fig. 4. 9
(3) g5 = 0.137 c m . , S
=
0.353 cm. This check is obtained by summing the true deflections 9 5of all beams for each position of the two trucks, i. e.
for Loads 3 , 6, and 8. Based on energy considerations (4) 6 = 0.182 cm,
,
6 = 0.191 cm.7 5 the sum. ( 1 8 ) should be constant. For beam 5 loaded
(Load 3) x 6 = 2.58 cm. For beam 9 loaded (Load 6)
(5) &I5 = 0.115 c m . ,
=
0.115 cm.S = 2 . 2 7 cm. For beam 7 loaded (Load 8)
ZS
=
1 0 $42.26 cm,
A@eement between thelattcr two is excellent, and (6)
s 5
= 0,082 cm.,
6' = 0.072 cm. therefore 2.265 cm. was assumed to be the correct 12 12L O A D DISTRIBUTION T E S T
-SUSSEX S T R E E T BRIDGE, O T T A W A , C A N A D A
ACCURACY OF MEASUREMENTS main assumptions
-
0 alone determines t h e distribution Although the maximum deflection measured wasonly of the order 0.20 cm. (0.080 in.) and deflections due to temperature variations were of the same order, the deflection curves are very consistent, most plotted points following a rather smooth curve. The accuracy of the results in general are d w to the high degree of precision with which i t was possible to read deflections using the Wilde NIII optical levels. The instruments can be read to 0.001 cm. (0.0004 in. ). For the condi- tions under which the test was carried out it is consi- dered t h a t the maximum error in reading was about 4 0 . 0 0 7 cm. ( f 0 . 0 0 3 i n . ) o r * 0 . 0 0 7 / 0 . 2 0 = * 3 . 5 per cent. As a running check during the test, duplicate readings on one point were taken using both levels. Comparison of these would suggest that the averagz er- ror in measurement was most likely about -1.5 per cent.
With regard t o the over-all accuracy of the -o,sults
as opposed to that of the measurements, there are so many factors involved t h a t an estimate would be some- what speculative. It is suggested that the reciprocity checks for Loads 6 and 8 (p. 6). the maximum error in which is 3 per cent, gives some indication.
COMPARISON WITH THEORETICAL ANALYSES The theories with which the experimental results are compared are due t o Y. Guyon (2) and C. Masson- n e t (3), both of whom are internationally recognized authorities in this field of structural analysis. Both theories are summarized in an article published in "The Structural Engineer" (4). The existence of other theor- e t i c a l approaches (5)(6)(7)(8)isrecowized but these two were selected as being representative and as having the merit of being presented in a form sufficiently simple for design office use.
In the theory of Guyon, the actual system of dis- creet interconnected longitudinal and transverse m e m - bers is reduced to an "elastically equivalent'" slab sys- t e m whose structural properties in the two orthogonal directions are uniformly distributed along their lengths. T h e relative rigidities in the two directions are related by the parameter 0, thus
where 2a = effective span 2b
=
effective width1. = moment of inertia of each beam !
=
moment of inertia of each diaphragm p beam spacingq = diaphragm spacing
lv a system in which the torsional resistance of beams and diaphragms is neglected
-
one of Guyon'sof load throughout the system.
The theory of Guyon has been extended by Masson- net to include the effects of torsion. He introduced a torsion parameter rr , analogous to the flexure parameter 0. Thus, oc is given by:
where G
=
shear modulus E = modulus of elasticityb
= torsional rigidity of each beam Jo = torsional rigidity of each diaphragm I, J , p and q are as previously defined.The curves in Figs. 7 t o 1 2 were constructed in ac- cordance with those two theories. A brief summary of the computations involved is given in Appendix B. In those Figures, deflections a r e expressed as multiples or submultiples of the factor K , where K is defined as tlie average deflection of the beams assuming the total ap- plied load to be unifornlly distributed across the width of the bridge a t midspan. Thus theory and experiment may be compared without regard for the magnitude of the loading, or the value of the modulus of elasticity, e t c . , on which the distribution is not dependent since relative, and not absolute deflections govern. In all these figures the effective beam positions ranging from -b to +b (see Appendix B) are given, since this is the form in which the theoretical curves a r e usually pre- sented.
In order to compare theory and experiment two val- ues for the parameter 0 , corresponding with two possi- ble values of the transverse rigidity, were selected somewlmt arbitrarily. In Figs. 7 to 9, 8
-
0.801 was obtained by assuming the diaphragms or transverse beams to be rectangular only, as shown in Appendix B.EL Figs. 1 0 to 1 2 , 0 = 0.681 was obtained by assuming
the diaphragms to have the form of T-beams, tlie flange o f e a c h ofwhich was formed by the upper flange of the longitudinal beams a s shown in Appendix B. The maximum possible width for this T-beam is 1 7 ft. 4 in. (i. e. the diaphragm spacing) but it was considered tlmt the width effective in bending should be t a k e n as 5 ft. in accordance with normal design assumptions for T - beams in bending. In Figs. 7 to 9, oc was calculated on
the basis of the transverse torsional rigidity as being contributed entirely by t h e rectangular diaphragms. Concerning the general shape of the e x ~ e r i m e n t a l curves, it will be observed that the maximuin or peak value of K for Loads 6 and 8 (Figs. 8 , 9, 1 1 , and 12) is in each case displaced slightly towards the edge of the bridge, relative to the corresponding theoretical curve.
JVORLD CONFERENCE ON PRESTRESSED CONCRETE
The possibility that the trucks were incorrectly locatedon the bridge can b2 ruledout since extreme care was taken to ensure that this did not occur. As a possible alternative explanation, it is suggested if, for some reason, one or more beams in the vicinity of beam 6 or beam 7 had a lower than average stiffness, i. e. modulus of elasticity, the effect on the curves would be as noted above.
It is quite clear that the theoretical curves for 0
=
0.681 correspond more closely with the actual curves than do those for 8 = 0.801, but the latter are included in this report mainly in order to show how neglect of the flanges in computing the transverse stiffness could r e s u 1 t in substantial overdesign of the longitudinal members. The carves for 0-
0.681-
particularly those from Massonnet-
are more satisfactory from a design standpoint, being, if anything, only slightly on the safe side. However, it is pointed out that as the load posi- tion changes from beam 9 through beam 7 to beam 5.the discrepancy between theory and expe-iment becomes wider. Emapolaihg, it follows that were, say, beam 2 loaded, the theoretical K factor would be significantly larger than the actual, even if the torsional resistance effect were included. Even for the most severe loading case studied, Fig. 10, and considering beam 1 , the fol- lowing differences are obtained:
K actual " 1.725
K Massonnet = 1.960 i. e. + 13.6 per cent
K Guyon = 2.100 i. e. 4 21.7 per cent
In drawing this comparison between the actual and theoretical distributions, i t should be understood that whereas the former is a result of the application of four point loads distributed along a length of the span, the larter results from the application of one midspan point load, which is a more severe loading condition. The differences between the theoretical and experimental curves are due, in part, to this effect and are therefore somewhiit exaggerated.
It follows that in the design of a bridge on which the anticipated live load is highly eccentric, the in- fluence of torsion is extremely important, and definite economies can be effected by taking advantage of it.
However, in the case of a normal highway bridge this highly eccentric type of loading is not normally the critical loading, which usually occurs when all traffic lanes are loaded simultaneously. In that case not only does the effect of torsion have little influence on the distribution, but there is much less need for such dis- tribution since the loading is already fairly evenly ap- plied across the span.
Throughout the foregoing discussion, it has been assumed that the bridge under live load, is: working in the 'elastic range", i. e.
,
at iess than The crackingload of all the constituent members and joints. The de- velopment of cracks or opening of joints would un- doubtedly be accompanied by progressive changes in the structural chuacteristics of the span in the two or- thogonal directions, and would invalidate any theor- etical computation of the distribution from the point of cracking up to the ultimate load carrying capacity of the span
-
a quantity which would be dependent on many factors, such as, the nature, position. physical dimension, etc., of the load. While the importance of this aspect of design is reco y i z e d , it is considered out- side the scope of this paper to discuss i t further.1. Although the maximum deflection of the bridge un- der the applied loading was only 0.20 cm.
.
this was sufficiently large to permit Accurate determination of the load distribution characteristics of the test span by the use of precise optical levelling. 2. Comparison of the actual behaviour or the bridgewith that according to the theories of Guyon and Massonvet has shown that the latter is more precise and less conservative than the former, although both err on the safe side. The theory of h4assonnet when applied to the design of a normal highway bridge will generally lead t o a n economical szuctwe. In the case of a bridge on which the live load is ex- s c t e d to be eccentric, the mafn supporting mem- bers will have inherent in them a safety factor some- what larger than calculated.
ACKNOWLEDGMENTS
The authors wish to express their gratitude to the following authorities and individuals, for their help and cooperation in carrying out the work reported in this paper: Department of Works, City of Ottawa; De- partment of Public Works, Government of Canada; Key Construction Ltd.
,
General Contractor and Precom- pressed Concrete Engineering Co. Ltd. This paper is published with the premission of Mr. H. C. Ross, Act- ing Director of Research. Hydro-Electric Power Com- mission of Ontario and Mr. RF. Legget, Director, Div- ision of Building Research, National Research Council of Canada.(1) "Materials and Structures", E. H. Salmon, Long- mans, Green & Co., London, 1948.
(2) "The Calculation of Wide Multiple Beam Bridges with Diaphragm Stiffeners
".
Y. Guyon, Annales des Ponts e t Chausses, Paris, 1946.LOAD DISTRIBUTION TEST
-
SUSSEX STREET BRIDGE, O T T A W A , C A N A D A
Bridges taking into account their resistance to tor- sion", C. Massonnet. Publications, International Association for Bridge and S m c t m a l Engineering, Zurich, 1950.
(4) "Load Distribution in Prestressed Concrete Bridge Systems", P. B. Morice and G. Little, The Struc- tural Engineer, March 1954.
(5) "The Calculation of Grfflage Beams
",
F. Leonhardt and W. Andta. Julius Hoffman Press, Stuttgart. 1950.(6) "A Method for Calculating GrfUage Beams", M. Hetenyi, S. Timoshenko, 60thAmiversary Volume,
On the basis of the two fbregoing assumptions it follows that it is legitimate to consider the span as a simply supported beam whose effective moment of inertia is equal to that of one of the 18 constituent beams, i. e. 182,000 in. 4, and whose midspan deflection under the applied loading is equal to the sum of the deflections ( z g ) of these 18 beams, i. e. 2.265 cm. It can be shown that the midspan deflection of this hypothetical beam is given by,
where, New York, 1938.
(7) "The Theory of Plates and Shells", S. Timoshenko, il
-
midspan deflection McGraw-Hill, New York, 1940. E = modulus of elasticityI = effective moment of inertia
(8) "The Design and Analysis of Openwork Prestressed
PI, P2 = point Ioads Con Crete Beam Grillages", T. 0. Eazarides, Civil
a l e a2
=
distance of Ioads from one supportEngineering and PubIic Works Review, June 1952.
L = span (9) "Theory of Elasticity", S. Timoshenko, McGraw-
Hill, New York, 1934 APPENDIX A
The test span loaded with two trucks is shown diagram- matically below.
The front and rear axle loads are respectively 6,500 lb. and 25,170 Ib. for each truck. The diaphragms are shown a t pobrs B, D, E and G.
In order to obtain a value for the modulus of elasticity two assumptions were made, viz.,
(1) a l l the disnibution of load took place a t the dia- phragms, and
(2) ehe distribution of load at diaphragms B and G had precisely the same characteristics as that which todk place a t diaphragms D and E.
Neither of those assumptions is strictly speaking cottect, but they are sufficientlyaccurate for the purpose of this computation, Converting the 6,500 3b. loads to effec- tive loads a t the adjacent diaphragms, ake loading on ehe span then becomes that shown below:
Here, 6 ~ 2 . 2 6 5 cm I
=
182,000 in. 4 P i , P2 = 5,300 1b. 26,300 lb.,
respectively a l e a2 17.33 ft. 34.66 ft.,
respectively L = 86. 65 ft.Solving expression (1) for the modulus of eIasticity E, E 8,034,000 psi
APPENDIX B
COMPUTATION OF THEORETICAL DISTRIBUTION OF LOAD
The various sections w i d their stcuctutal properties fkom which the theoretical distribution of load was computed are given below:
LONGITUDINAL BEAMS
Moment of Inertia, I 182,000 in.4 Torsional Rigidity, Io* = 14,600 in.
W O R L D CONFERENCE ON PRESTRESSED CONCRETE
Beam Spacing. p 43 in.spnn, 2Span 2a
=
86.65 ft.9 For method of calculation see Ref. (9)
sitions, ranging between -b and t b in increments of b/4, for 0
<
0<
3. Where the experimental load and beam positions do not correspond with those selected by Guyon, linear interpolation was used to determine the actual value of K. The resultant distribution curves DIAPHRAGMS (TRA NSVERSE BEAMS) were then plotted in Figs. 10 to 12. Substituting in ex- (a) RECTANGULAR DIAPHRAGMS pression (1) the values corres~onding with the same longitudinal beams, and the rectangular diaphragms, Moment of Inertia, J=
53,400 in. 4 0 = 0.801Torsional Rigidity, Jon 11.200 in. 4
In the same manner as before the distribution curves
*
m
Diaphragm Spacing, q = 17.33 ft.corresponding with this value of 0 were plotted in Figs. Span, 2b
=
32.50 ft.7 to 9.
(b) T -BEA M DIAPHRAGMS
Moment of Inertia, J = 101,000 in. 4 Torsional Rigidity, JoD
-
11,200 in. Diaphragmspacing, q 17.33 ft.Span, 2b = 32.50 ft.
@) TBEORY OF MASSONNET
In this theory an attempt was made to take into'account the effect of torsion on the distribution. Massonnet in- troduced a parameter, a
,
which includes the torsional resistance of both longitudinal and transverse members, thus;As before, substituting in this expression the values cor- responding with the T-beam and rectangular diaphragms the respective values of the parameter are:
W = 0.0587 and M = 0.0806
These values are based on the assumption that Poisson's ratio for concrete = 0.16, so that G
=
0.43 E.*
This value, equal to that in (a) above was used, since The results of this second theoretical treatment are also use of the actual value, which is only slightly h i a e r , presented graphically, (5), (6), the variables once again will not affect the end resdt significantly. being load position, beam position and 0. Whereas in the theory of Guyona
0, i. e. no torsion, in the(a) THEORY OF GWON
As stated previously, in this theory the relative rigid- ities of the bridge in the two orthogonal directions in a horfzontal plane are related by the parameter 0, thus;
Substituting in this expression the values corresponding with the longitudinal beams and the T-beam dia- phragms
Thus it became an easy matter to determine the distri- bution of load since Guyon has presented his results in graphical form (4). (6). In these curves, values of K (as defined previously) are given for beam and load po-
theory of Massomet a = l, i.e.ful1 torsion. (Fulltorsion as used in this context is defined as the torsional resis- tance developed by an isotropic slab). However, in the case of interconnected beam systems, such as that un- der consideration, in general 0 <CX< 1. Massonnet there-
forecalculated the factor Kfor various values of 8 , and found that for practical purposes it was sufficiently ac- curateto use thevalue of K as obtained from the inter- polation formula,
Kw = KO + ( K,
-
KO)*where KO, K1 and Kcc are the K factors corresponding to Ct = 0, 1 and W , respectively.
The Massonnet curves in Figs. 7 to 12 thus were ob- tained by abstracting the K1 factors from the theoreti- cal curves and applying the interpolation correction as indicated above.
L O A D DISTRIBUTION TEST
-SUSSEX S T R E E T BRIDGE, O T T A W A , C A N A D A
TABLE I MEASURED DEFLECTIONS-
Point Number MIDSPAN DEFLECTION-
cm No Load One Truck OnBeam 5 No Load Loading I 1 INotes: (a) Deflections shown posirive are upward (b) Point numbers refer to those in Fig. 1
BEAM NO. I 2 3 4 5 6 7 Two Trucks OnBeam 5 -0.2 13 -0.195 -0.172 -0.158 -0.107 -0.047 -0.006 b0.029 90.036
to.
032 3 0 DEFLECTION PINS No Load LO. 055to.
087 40.165 t0.195to.
239to.
260-
to.
256 90,206to.
104 5 NO Load 40.048to.
090 r0.116to.
134to.
153 *O. 159to.
157 t0.127 i0.060 4 1Fig,
1
Sketch of Test
Span Showing Beam
5
Loaded (Load 3 )
20-7 Two 71 ucks OnBeam 9 -0.012