Publisher’s version / Version de l'éditeur:
Technical Translation (National Research Council of Canada), 1962
READ THESE TERMS AND CONDITIONS CAREFULLY BEFORE USING THIS WEBSITE. https://nrc-publications.canada.ca/eng/copyright
Vous avez des questions? Nous pouvons vous aider. Pour communiquer directement avec un auteur, consultez la
première page de la revue dans laquelle son article a été publié afin de trouver ses coordonnées. Si vous n’arrivez pas à les repérer, communiquez avec nous à PublicationsArchive-ArchivesPublications@nrc-cnrc.gc.ca.
Questions? Contact the NRC Publications Archive team at
PublicationsArchive-ArchivesPublications@nrc-cnrc.gc.ca. If you wish to email the authors directly, please see the first page of the publication for their contact information.
NRC Publications Archive
Archives des publications du CNRC
For the publisher’s version, please access the DOI link below./ Pour consulter la version de l’éditeur, utilisez le lien DOI ci-dessous.
https://doi.org/10.4224/20331424
Access and use of this website and the material on it are subject to the Terms and Conditions set forth at Early Stages of Concrete
Vironnaud, L.
https://publications-cnrc.canada.ca/fra/droits
L’accès à ce site Web et l’utilisation de son contenu sont assujettis aux conditions présentées dans le site LISEZ CES CONDITIONS ATTENTIVEMENT AVANT D’UTILISER CE SITE WEB.
NRC Publications Record / Notice d'Archives des publications de CNRC: https://nrc-publications.canada.ca/eng/view/object/?id=fa80332a-54bc-4d13-a589-22d3c1e3ade2 https://publications-cnrc.canada.ca/fra/voir/objet/?id=fa80332a-54bc-4d13-a589-22d3c1e3ade2
PREFACE
A method of measurement has been developed t h a t makes it possible t o check t h e dimensional v a r i a t i o n s of a pure cement p a s t e o r of a mortar, f i f t e e n minutes a f t e r it has been placed i n a mould. The influence of various t e s t conditions ( v e n t i l a - t i o n , humidity, thickness of specimen) were included i n t h i s study, Since very l i t t l e research has been done on t h e l i n e a r v a r i a t i o n s t h a t occur during t h e f i r s t twenty-four hours of cement hydration, and since e f f o r t s a r e being made i n t h e Division of Building
Research t o develop
a
method t o measure t h e l i n e a r v a r i a t i o n of cement from t h e moment of wetting, t h i s work i s deemed of g r e a t i n t e r e s t t o t h e Division.T h i s t r a n s l a t i o n has, t h e r e f o r e , been prepared not only f o r use within t h e Division but a l s o f o r t h e general information of those i n Canada concerned with t h e technology of concrete. The Division i s indebted t o M r . D.A. S i n c l a i r of t h e
NRC
Translations Section f o r preparing t h i s t r a n s l a t i o n .Ottawa
March, 1962
R.F, Legget Director
NATIONAL RESEARCH COUNCIL OF CANADA Technical Translation 1019
Title : The early stages of concrete
( ~ e premier age du b6ton)
Author:
L.
VironnaudReference: Annales de lllnstitut Technique du Bgtiment et des
Travaux Publics, (154): 1003-1016, 1960
TKE EARLY STAGES OF CONCRETE Summary
The method of measurement t h a t has been developed makes i t p o s s i b l e t o check t h e dimensional variations. of
a pure paste, a mortar o r a concrete from t h e point when it has been placed i n a mould ( t o within f i f t e e n minutes). After t h e study of t h e f a c t o r s involved i n t h e t e s t con- d i t i o n s (influence of t h e bottom of t h e mould, t h e thick- ness of t h e t e s t , v e n t i l a t i o n and hygrometry), some graphs
show t h e r e s u l t s of experiments on concretes exposed t o v e n t i l a t i o n ( i n r e l a t i o n t o t h e nature of t h e cement, t h e water and ccment contents, t h e grain-size composition and t h e reinforcements).
A t e s t on t h e behaviour of coatings on a support i s described; i t permits measuring t h e time a t t h e end of which a s l a b of concrete covered with a coating and sub-
jected t o c e r t a i n conditions of v e n t i l a t i o n w i l l crack. Introduction
Studies of shrinkage and expansion of concrete generally begin with t h e s t r i p p i n g of t h e specimens, i , e ,
24
hours o r even48
hours a f t e r mixing. Very l i t t l e research has been done on t h e l i n e a r v a r i a t i o n s t h a t occur during t h e f i r s t 24 ~ O W S , e s p e c i a l l y t h eperiod t h a t precedzs hardening,
However, building firms s o m e t h e s complain of cracks t h a t ap- pear while t h e concrete i s s t i l l i n t h e fonnwork, o r of coatings
t h a t s h a t t e r * almost immediately a f t e r t h e i r a p p l i c a t i o n . We thought i t would be i n t e r e s t i n g , t h e r e f o r e , t o t r y t o determine t h e behav- l o u r of mortars and concretes a t t h e very beginning of t h e i r exis- tence, and t h a t i s why M r . LIHermite proposed a s t h e t i t l e of t h i s exposition "The Early Stages of Concreten.
M r . Lefevre, Engineer a t t h e Service ~ a t e ' r i a u x du C .E,B,T,P., has developed an apparatus by which measurements can be made on a green concrete f a c e t h a t has not y e t s e t , then continuing them as long as desired. I n p r a c t i c e , t h e s e measurements a r e l i m i t e d t o
*
Trans. Note: The French word "fafen$age" suggests break-up i n t o a mozaic p a t t e r n .t h e f i r s t 24 hours, because it i s very easy t h e r e a f t e r t o t a k e r e a d i n g s by t h e methods applied f o r shrinlcage, thereby f r e e i n g t h e apparatus f o r another specimen.
These measurements can be made by exceedingly t e c h n i c a l t e s t procedures more p a r t i c u l a r l y designed f o r c o a t i n g s . It i s t h e n a
question of verif'ying t h e i r b e h a v i ~ , ~ .. Q,n ( I v a r i o u s supports and under
v a r i o u s c o n d i t i o n s .
From a l l t h e s e t e s t s talcen t o g e t h e r it i s p o s s i b l e t o g e t a more exact p i c t u r e of t h e phenomena which accompany t h e s e t t i n g
and t h e f i r s t s t a g e s hardening t h e concrete.
1. Measurement of t h e Linear V a r i a t i o n s of Green Concrete 1.1 Apparatus
1.11 P r i n c i p l e
The p r i n c i p l e i s simple. W e observe, as a f u n c t i o n of t h e
time, t h e displacement of ttvo r e f e r e n c e marlcs placed a Icno~in d i s * t a n c e a g a r t on t h e open, h o r i z o n t a l f'acc of t h e spccknen. The sum of t h e displacements g i v e s t h c t o t a l l i n c a r v a r i a t i o n bcttiecn t h e r e f e r e n c e marlcs a t t h e time considered.
What i s involved, t h e r e f o r e , i s a s u r f a c e measurement* on t h e pure ccment p a s t e , mortay o r concrctc. This measuretnent should be- g i n a s soon a s p o s s i b l e a f t e r p l a c i n g i n t h e form. Generally speak- ing, t h e s e measurements continue f o r 24 hours. A f t e r t h i s time t h e specimen w i l l have hardened and r e c o u r s e may be had t o t h e methods normally a p p l i e d t o shrinkage and expansion.
1.12 Apparatus d e t a i l s
The apparatus w a s conceived and developed by M r . C . Lefevre, Engineer a t t h e S e r v i c e ~ a t & i a u x du C.E.B.T.P.
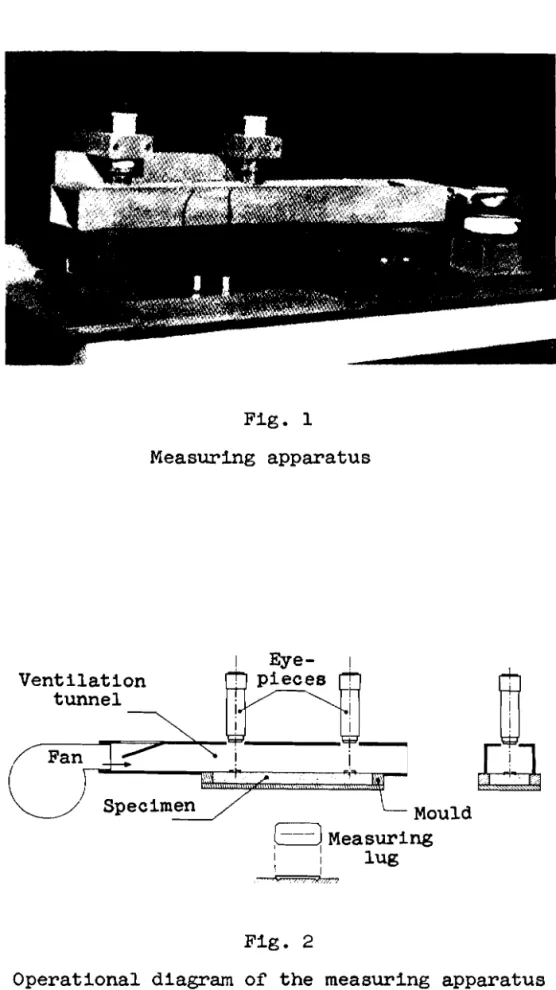
Pig. 1 i s a photograph of t h e apparatus and P i g . 2 a schematic diagram i l l u s t r a t i n g how i t works. The following i s a s t e p by s t e p
*
Iiowever, although t h e measurement tdces p l a c e on t h e s u r f a c e t h i s does not mean a p r i o r i t h a t t h e v a r i a t i o n s of t h e specimen s k i n a r e not measured. The e f f e c t on t h e r e s u l t s of t h e specbnen t h i c k n e s s (1.32) and of t h e c h a r a c t e r of t h e form bottom (1.31) w i l l be discussed f u r t h e r below.d e s c r i p t i o n :
A m e t a l l i c mould permits production of a r e c t a n g u l a r specimen with an open h o r i z o n t a l s e c t i o n of
7
x
28 cm. The mould may be 2 o r7
cm t h i c k , depending on t h e d e s i r e d t h i c k n e s s of t h e specimen.The pure cement p a s t e , t h e mortar o r t h e concrete a r e placed i n t h e mould according t o t h e manner contemplated, As soon a s t h e open f a c e i s f l u s h with t h e top of t h e mould t h e measuring s t u d s a r e put i n p l a c e along t h e h o r i z o n t a l a x i s of t h e s u r f a c e .
The s t u d s c o n s i s t of small p l a t e s of white i r o n , r e c t a n g u l a r i n shape, 1
x
2 cm. A f i n e l i n e i s engraved along t h e i r h o r i z o n t a l a x i s and t h e f o u r corners of t h e r e c t a n g l e a r e bent back at r i g h t angles. The corners t h u s p e n e t r a t e s e v e r a l m i l l i m e t r e s i n t o t h e body of t h e sample and prevent t h e p l a t e l e t s from s l i d i n g on t h e open f a c e . The l a t t e r t h u s follow t h e movements of t h i s s u r f a c e . They a r e placed so t h a t t h e l o n g i t u d i n a l , engraved l i n e s a r e per- pendicular t o t h e l o n g i t u d i n a l a x i s of t h e specimen. They a r e 20 cm a p a r t , measured t o an accuracy of approximately 1 mm. T h i s ac- curacy i s s u f f i c i e n t because t h e measurements of t h e displacement a r e r e f e r r e d t o a standard l e n g t h of 1 rn, a s i n t h e case of shrink- age ( e r r o r = 5/1000).The mould i s t h e n introduced i n t o a r i g i d framework comprising a t a b l e and a g a n t r y c a r r y i n g two eye-pieces a d i s t a n c e of 20 cm a p a r t . The measuring p l a t e s must be beneath t h e eye-pieces i n such a way that t h e engraved l i n e s a r e seen i n t h e micrometric s c a l e s
of t h e eye-pieces. The i n i t i a l measurements t a k e p l a c e immediately. It has been noted, and i s assumed f o r a l l subsequent experiments, t h a t f i f t e e n minutes e l a p s e between t h e f i l l i n g of t h e mould and t h e i n i t i a l reading. T h i s i s t h e time t h a t i s r e q u i r e d t o put t h e p l a t e s i n place, i n s t a l l t h e mould i n t h e framework, c l o s e t h e ven- t i l a t i o n cover over t h e mould, a d j u s t t h e s c a l e s and c a r r y out t h e i n i t i a l r e a d i n g s , It i s a delay which appears d i f f i c u l t t o reduce. Unquestionably, during t h i s s h o r t space of time t h e s u r f a c e i s sub- jected t o v a r i o u s environmental conditions of t h e room, but i f t h e room temperature and humidity a r e kept constant t h e s e conditions w i l l be t h e same f o r a l l specimens t h a t a r e t o be compared,
After making t h e i n i t i a l measurement t h e f a n placed a t one end of t h e v e n t i l a t i o n tunnel
i s
s t a r t e d , and t h e v e l o c i t y of t h e a i r flow over t h e specimen i s adjusted by means of a s h u t t e r . Ports i n t h e tunnel permit the eye-pieces t o pass through and a small3.5
v o l t lamp i s provided t o illuminate t h e i n t e r i o r of t h e tunnel when readings a r e made. From then on it i s merely a matter of carrying out readings a t known i n t e r v a l s of time. The length v a r i a t i o n s r e - f e r r e d t o a sample length of 1
m
are calculated and p l o t t e d graphi- c a l l y a s a function of time f o r a period generally fixed a t24
hours. Note that t h e curves a r e drawn i n semi-logarithmic coordinates. The i n i t i a l measurement ( f i f t e e n minutes a f t e r t h e specimen has been placed) i s not p l o t t e d and t h e times inscribed on t h e diagrams a r ecounted from t h e i n i t i a l measurement. To a c e r t a i n extent, there- f o r e , we have neutralized a quar5er of an hour i n t h e l i f e of t h e
specimen, a time which i s not taken i n t o account a t a l l . We a r e emphasizing t h i s point i n order t o explain why a l l t h e curves do not o r i g i n a t e a t zero. I n t h e quarter of an hour following the i n i - t i a l measurement l i n e a r v a r i a t i o n s of t h e specimen may already have taken place.
1.13
Ventilation tunnelIt may be wondered why a v e n t i l a t i o n tunnel i s needed, but our previous experiments, e s p e c i a l l y on cracking rings, have shown us t h e importance of t h e v e n t i l a t i o n f a c t o r , i . e . renewal of t h e a i r around a wet specimen, even when t h e l a t t e r i s s i t u a t e d i n a room with constant temperature and humidity. That i s why M r . Lef e w e wanted t o n e u t r a l i z e t h i s parameter and has thus equipped h i s device with a t u n n e l . i n which he could be sure of t h e velocity of t h e a i r flow. T h i s wooden tunnel with an
8 x
5
cm cross-section open a t both ends i s placed on top of t h e mould. A t one end i s a low-powerc e n t r i f i c a l blower ( i n t h i s case a
35
watt hair-dryer). A control s h u t t e ri s
used t o reduce t h e cross-section of the blower so a s t o obtain a desired v e l o c i t y of t h e a i r filaments. The o t h e r end of t h e tunnel opens i n t o the room, and a t t h i s end we measure the a i r v e l o c i t y f o r each experiment by means of a d i f f e r e n t i a l , paddle- wheel type manometer. The equipment employed i s not capable of pro-ducing high v e l o c i t i e s ; we have not exceeded
3
m/s, i . e . about 10h/h.
It must be remembered, however, t h a t we a r e working i n a room v ~ i t h constant temperature and humidity, generally 20°C and 50% r e l . humidity. We believe t h a t i n t h i s way we have obtained completely reproduceable conditions by which we a r e a b l e t o place t h e specimens and t o c a r r y out our measurements under i d e n t i c a l conditions. It w i l l be seen t h a t t h e r a t e of renewal of t h e a i r on t h e open f a c e of t h e specimen has a very s t r o n g influence on the behaviour of t h e specimen and t h a t t h e measurements can t h u s vary very widely.1.14 Measuring accuracy
The readings a r e taken a t c e r t a i n i n t e r v a l s and it may be ask- ed whether a p a r t of t h e phenomenon does not escape i n v e s t i g a t i o n . For t h e present M r . Lefevre has not been a b l e t o achieve t h e re- cording of t h e v a r i a t i o n s , but since he h o w s t h e general course t h a t t h e phenomenon follows, he takes h i s readings a t t h e most i m - portant moments, i . e . every f i f t e e n minutes during t h e first f o u r hours and every hour f o r t h e next t h r e e hours, a f t e r which a s i n g l e measurement 24 hours l a t e r i s s u f f i c i e n t . Generally speaking t h e readings a r e not extended f?urther, but it i s very easy t o do so. The specimen i s furnished a t t h e time of pouring with lugs f o r t h e r e g u l a r shrinkage measurements and t h e l a s t reading i s taken with L e f e v r e t s apparatus when t h e specimen i s 24 hours old, before t h e
specimen i s s t r i p p e d . The i n i t i a l retractometer measurement i s then made immediately a f t e r s t r i p p i n g . After t h i s t h e measurements a r e continued a s long a s necessary. It should be noted, howcver, t h a t t h e evaporation conditions have changed. During t h e first 24 hours, evaporation by v e n t i l a t i o n i s possible only on t h e top face of t h e specimen. After t h i s time, i f we pass on t o t h e usual con- d i t i o n s of shrinkage, evaporation t a k e s place without v e n t i l a t i o n on a l l f a c e s , but t h e f a c t remains t h a t one of thefktces w i l l have had a d i f f e r e n t h i s t o r y from t h e o t h e r s . F i n a l l y , t h e conditions of measurement a r e not t h e same. During t h e f i r s t day t h e measure- ments a r e c z r r i e d out on t h e surface. Subsequently, they a r e car- r i e d out along t h e a x i s of t h e specimen. This i s why it i s not
necessary, perhaps, t o combine t h e two measurements, but i s p r e f e r - a b l e t o consider them s e p a r a t e l y ,
The reading accuracy of t h e displacement of a l u g i n an eye- piece i s g r e a t e r than 5p/m, but we have assumed t h i s f i g u r e and taken as t h e maximum l i m i t i n g e r r o r , 10 p on t h e readings of our two l u g s 20 cm a p a r t . We t h u s g e t a maximum e r r o r of 50 p/m f o r t h e t o t a l v a r i a t i o n s obtained. The l a t t e r e a s i l y exceed a m i l l i - metre and sometimes reach a centimetre. The accuracy, very d e f i n i t e -
l y g r e a t e r than
5$,
seems q u i t e adequate t o u s f o r t h e measurement of t h e v a r i a t i o n s .1.2 Development of t h e measuring programme
The f i r s t measurement took p l a c e under r a t h e r a r b i t r a r y condi- t i o n s : temperature 20°C; r e l a t i v e humidity 50%; a i r v e l o c i t y 1 m/s. We t r i e d a pure cement p a s t e CPB 250/315 2 cm t h i c k mixed t o p l a s t i c
consistency; a p l a s t i c mortar of t h e Rilem-Cembureau of
7
cm t h i c k - ness anr2 a concrete containing 350 kg/m3 of cement, again of 7 cm thickness.The measured r e s u l t s a r e p l o t t e d i n F i g .
3 .
The phenomenon follows s u b s t a n t i a l l y t h e same course f o r a l l t h r e e specimens. Pure p a s t e and mortar show a s l i g h t elongation a t t h e beginning, anda f t e r an hour r e v e r t t o t h e i r o r i g i n a l l e n g t h , They t h e n undergo very r a p i d shrinking up t o t h e f o u r t h o r f i f t h hour, a f t e r which t h e phenomenon becomes s t a b i l i z e d and from t h e n u n t i l t h e 24th hour t h e specimens show only very s l i g h t a d d i t i o n a l shrinkage,
Concrete shows t h e same general behaviour, but without t h e i n i - t i a l expansion; t h e shrinkage i s l e s s i n t e n s e , but s t o p s f o r a l l p r a c t i c a l purposes a f t e r t h e f o u r t h hour.
The maximum values a t t a i n e d by t h e t h r e e specimens d i f f e r wide- l y : 6.6 mm/m f o r t h e pure paste; 4.4 mm/m f o r t h e mortar and 1 . 4 mm/m f o r t h e concrete,
These i n i t i a l r e s u l t s convinced u s of t h e importance of t h e shrinkage during t h e f i r s t 24 hours and we have r e t a i n e d t h e maximum values a s c h a r a c t e r i s t i c of t h e specimen. However, we b e l i e v e it i s a l s o necessary t o consider t h e curve as a f u n c t i o n of time i n o r d e r
t o have an accurate idea of t h e c r i t i c a l period of shrinkage,
I n our r e s e a r c h programme, t h e r e f o r e , we s h a l l seek t o d e t e r - mine t h e f a c t o r s which on t h e one hand a f f e c t t h e maximum shrinkage value and on t h e o t h e r hand determine t h e c r i t i c a l period of t h e phenomenon. We must examine t h e conditions by which t h i s period can be prolonged o r by which t h e cracking t h a t r e s u l t s from it can be remedied. T h i s w i l l involve a study of t h e concrete components
(cement, water, sand, e t c . ) .
Before s t a r t i n g t h i s i n v e s t i g a t i o n , however, we s h a l l have t o be c e r t a i n about t h e conditions of our t e s t s , Some of them have been a r b i t r a r i l y e s t a b l i s h e d and we s h a l l t h e r e f o r e have t o d e t e r - mine w h a t v a r i a t i o n s a r e introduced by changing t h e humidity, t h e a i r flow v e l o c i t y and t h e temperature ( t h e l a t t e r parameter has not been s t u d i e d a t a l l ; a l l measurements were c a r r i e d out a t 20°c).
F i n a l l y , t h e r e a r e f a c t o r s which can f a l s i f y t h e measurements and about which it i s necessary t o be c e r t a i n before beginning t h e experiment. What i s t h e e f f e c t of t h e l a y e r thickness over which t h e a i r flows? This thickness i s c e r t a i n l y of some importance. How does t h e specimen behave on t h e bottom of t h e mould? I s t h e r e an adherence, o r i s t h e r e complete freedom of movement, o r a condi- t i o n intermediate between tlzese ttio extremes? These a r e t h e ques- t i o n s that we have attempted t o r e s o l v e i n developing t h e method, i , e . t o determine t h e influence of t h e f a c t o r s inherent i n t h e t e s t method.
1.3
Study of t h e f a c t o r s r e l a t i n g t o t h e t e s t conditions I n t h i s p a r t of t h e i n v e s t i g a t i o n w e have used:a s pure cement p a s t e s , those mixed t o t h e standard trowel consistency;
a s a mortar, t h e ~ ~ ~ / ~ i l e m / ~ e r n b u r e a u , mixed mechanically; a s t h e concrete, one of Seine aggregate:-
S/A =
1
-
350 k g cement and bl/C =0.5
21.31 Effect of t h e bottom of the mould
I s t h e adhesion between the bottom of t h e s p e c h e n and t h e mould well defined under our t e s t conditions, o r can it modify t h e behaviour of t h e open face? The bottom of t h e rnould i s o i l e d before pouring, but i s t h e o i l f i l m continuous?
We made two measurements on the pure paste, using two moulds of 2 cm thickness; t h e bottom of one was o i l e d i n t h e normal manner, while t h e paste was poured i n t o the other without any o i l . After two hours of measurement t h e f i r s t specimen, which had begun t o ex- pand, underwent a s l i g h t shrinkage; the second specimen showed no
change. Four hours a f t e r placing, t h e f i r s t specimen had shrunk more than
5
mtn/m, while t h e second one (on t h e unoiled bottom) show-ed only c e r t a i n s l i g h t tendencies ( 0 . 1 t o 0.2 rnrn/m), although it cracked suddenly i n t o two pieces. Adhesion t o the bottom had re- s t r i c t e d t h e movement and t h e cracking was a consequence of t h i s . The Z i r s t specimen did not break, but it assumed the shape of a
c l r c u l a r a r c pressing i n t h e c e n t r e against t h e mould. The extremi- t i e s r o s e about 1 mrn and t h e hardened specimen a t t h e age of 24
hours was e n t i r e l y f r e e i n i t s mould.
This experiment t e s t i f i e s t o t h e p o s s i b i l i t y of t h e paste ad- hering t o t h e bottom, but does not prove the e f f e c t i v e n e s s of our o i l i n g t h e bottom f o r a l l cases. Me t h e r e f o r e decided t o repeat t h e t e s t s i n order t o be a b l e t o judge t h e r e l i a b i l i t y of t h e method. With t h e bottoms simply o i l e d we obtained very reproduceable values with t h e same cement and t h e same quantity of water: we obtained, f o r example, 8 -65
-
8 -90-
8.95 and 9 nnn/m. Not only a r e t h e maxi- mum values t h e same, but t h e graphs a r e very close t o each o t h e r and r e f l e c t t h e same phenomena.With t h e mortar (and
7
cm thickness) we v e r i f i e d the non-ad- hesion on t h e bottom. One specimen was c a s t on t h e o i l e d bottom, while t h e o t h e r was placed on a perforated p l a t e resembling a cheese g r a t e r with t h e roughness up. Under t h e t e s t conditions we obtained a shrinkage of 4 mm/m f o r t h e f i r s t specimen and no v a r i a t i o n f o r t h e second (however the l a t t e r d i d not c r a c k ) . The e f f e c t of bot- tom shrinkage i s obvious.However, we wished t o confirm t h e s e r e s u l t s i n a way that would be i n d i s p u t a b l e , Specimens of concrete of
7
cm thickness were pour- ed, one on an o i l e d bottom and t h e o t h e r on a sheet of s o f t rubber 0.5 cm t h i c k placed on t h e bottom of t h e mould. Under our t e s t conditions ( a i r flow v e l o c i t y 2.5 m/s) we obtained i d e n t i c a l curves of v a r i a t i o n and s i m i l a r t o t a l shrinkage values (2.70 and 2.75 rnm/m),We t h e r e f o r e b e l i e v e that we can c a r r y out our t e s t s simply by o i l i n g t h e mould, without any o t h e r s p e c i a l precautions. We have i n f a c t a specbnen t h a t i s p e r f e c t l y f r e e t o shrink i n i t s mould without danger of undergoing supplementary shrinkages, However,
i f anyone t h i n k s t h a t l o c a l adhesions may occur i n t h e mould they may e a s i l y r e a s s u r e themselves by pouring t h e i r specimen on s h e e t s of s o f t rubber. This does not complicate t h e execution c f t h e t e s t i n any way.
1.32 E f f e c t of t h e thickness of t h e v e n t i l a t e d l a y e r
The evaporation on t h e h o r i z o n t a l open f a c e of t h e specimen draws t h e water from t h e lower l a y e r towards t h i s open face, and t h e thickness of t h e specimen must thus presumably have some e f f e c t , s i n c e t h e o t h e r f i v e f a c e s a r e not subjected t o evaporation. We have v e r i f i e d t h i s .
F i r s t we poured a 2 cm l a y e r of pure cement paste, and then one of 7 cm. The measurements did not d i f f e r from each o t h e r u n t i l t h e t h i r d hour. A f t e r an i n i t i a l s l i g h t expansion, t h e specbnens begin t o shrink towards t h e end of t h e second hour and both reach 0.6 mm/m a t t h r e e hours. The curves then s e p a r a t e very d i s t i n c t l y . A t f i v e hours t h e shrinkages become s t a b i l i z e d a t approxbnately
0.8
mm/m f o r t h e7
cm l a y e r and 1.6 mm/m f o r t h e 2 cm one, (There was no v e n t i l a t i o n a t 50% r e l , humidity.) The values a r e t h u s doubled when t h e thickness i s reduced from7
cm t o 2 cm ( s e e Fig.4 ) .
We d i d not continue t h e t e s t s of t h i s parameter, and have assumed t h e following:a thickness of 2 cm f o r measurements on pure p a s t e s and mortars; a thickness of 7 cm f o r concretes.
It should be borne i n mind, however, t h a t merely changing t h e thickness of a concrete u n i t may double t h e e f f e c t s of shrinkage due
t o evaporation.
1.33
The e f f e c t of v e n t i l a t i o nWith t h e apparatus employed, various a i r flow v e l o c i t i e s up t o
3
m/s could be r e a l i z e d . The a i r flows were very mild. A s a l r e a d y seen, it was merely necessary t o vary t h e I n c l i n a t i o n of t h e shut- t e r i n s t a l l e d i n t h e v e n t i l a t i o n tunnel i n o r d e r t o o b t a i n a i r flows of t h e d e s i r e d vel,ocity. The v e l o c i t y i s measured a t t h e t u n n e l e x i t .We t e s t e d t h e following v e l o c i t i e s on a p a s t e of pure cement: 0
-
0.6 m/s and 1 m/s i n an atmosphere of50$
r e l . humidity and 20°C.The g e n e r a l course of t h e phenomena i s t h e same, but t h e g r e a t - e r t h e v e l o c i t y t h e more pronounced it becomes. A f t e r s l i g h t i n i t i a l expansion, t h e specimens s h r i n k between 1 and 2 hours; a t
5
hours they have become p r a c t i c a l l y s t a b i l i z e d , but t h e t e r m i n a l values d i f f e r widely (F'ig.5)
:1.6 m / m i n t h e s t i l l atmosphere;
6
mm/m f o r an a i r flow of 0 -6 m/s;7.4
mm/m f o r an a i r flow of 1 m/s.Thus i n an atmosphere of t h e same r e l a t i v e humidity a r a t h e r weak a i r flow can i n c r e a s e t h e shrinkage by a s much a s a f a c t o r of
4,
during t h e same period of time. This shows how dangerous t h e e f f e c t of wind may be. T h i s has confirmed our f i n d i n g s , obtained previously from experiments on t h e cracking of pure p a s t e r i n g s . Renewal OF t h e a i r adjacent t o t h e specimens i s of prime importance i n t h e cracking and shrinkage phenomena.On t h e mortar we found shrinkages of
5.6
mm/nl. f o r a flow of 1 m/s; 10 mm/m f o r a flow of3
m/s.Under t h e s e c o n d i t i o n s t h e shrinkage values doubled. With our apparatus w e cannot o b t a i n an a i r flow i n excess of
3
m/s. However, Mr. Dutron a t t h e Laboratoire du Groupement d e s Producteurs de C i - ments de Eelgique obtained much h i g h e r values with flows of t h e o r d e r of 8 rn/s, which a r e by no means excessive.t h e following shrinkage values ( s e e Pig.
6 ) :
1.1 mm/m i n s t i l l a i r ;
1.6 mm/m f o r a flow of 0.6 m/s; 2 m / m f o r a flow of 1 rn/s; 2.3 mi/m f o r a flow of 2.5 m/s.
The divergences a r e not a s g r e a t a s before, but t h e shrinkage can be increased by a s much a s 2.5 times with a flow of
2.5
m/sover an open concrete s u r f a c e i n an atmosphere of 507; r e l . humidity. A l l t h e s e r e s u l t s prove t h e very g r e a t importance of v e n t i l a - t i o n on t h e r e s u l t s . T h i s i s why we t h i n k t h a t t h e measurements cannot be v a l i d u n t i l t h e v e l o c i t y of' t h e a i r flow over t h e s u r f a c e of t h e specimen has been defined and measured f r e q u e n t l y .
For our f u t u r e t e s t s w e have adopted a value of 1 m/s. This r e p r e s e n t s a very l i g h t wind ( l e s s t h a n
4
lan/h). It might be p r e f - e r a b l e t o use tv;o v e l o c i t i e s , a small one o r even s t i l l a i r , which does not o f t e n apply on s i t e , and another comparatively high one of t h e o r d e r of 10 m/s, f o r example. We would have t o modif'y t h e appa- r a t u s , but t h e r e s u l t s would enable u s t o understand t h e s u s c e p t i b i - l i t y of green concrete t o cracking.1.34 E f f e c t of h u n i d i t y
A l l s t u d i e s on shrinkage have deflned t h e i n f l u e n c e of t h e degree of conservation humidity on t h e measured values. We had no wish t o r e p e a t a study of t h i s nature; we merely took i n t o account t h e o r d e r s of magnitude of t h e v a r i a t i o n s t o which t h i s parameter can l e a d . A s an exception, t h e r e f o r e , we made a few measurements i n atmospheres of 85% r e l . humidity.
On a concrete, employing a i r flow v e l o c i t i e s of 0 amd 2.8 111/s,
'Je obtained t h e following shrinkages i n rnrn/m: R e l a t i v e l m i d i t y of
t h e surrounding a i r
No v e n t i l a t i o n
1
1.1I
0.5A i r v e l o c i t y 2.5 m/s 2
-8
1.1The phenomena s t i l l follow t h e same course ( ~ i g . 71, but a t
a t t h e moment t h e concrete i s placed, but one f i n d s delays of 1 hour and 30 minutes f o r t h e 2.5 m/s flow up t o 2 hours 30 minutes when t h e r e i s no a i r flow. The shrinkages a r e much slower and we cannot even be c e r t a i n t h a t they a r e s t a b i l i z e d a t 24 hours.
F i n a l l y , according t o t h e above t a b l e , t h e t o t a l shrinkage values a r e much smaller, a t l e a s t h a l f and sometimes almost a t h i r d of those obtained i n an atmosphere of 50% r e l . humidity. This mere- l y confirms t h e important i n f l u e n c e of t h e conservation humidity. A l l our experiments were c a r r i e d out a t 50% r e l . humidity.
1.4 Study of f a c t o r s having t o -. do with mortars and concretes
--
.-T h i s study took place under t h e following experlmental condi- t i o n s , which w e have chosen i n accordance with t h e r e s u l t s of Sec- t i o n
1.3:
temperature 20°C; r e l a t i v e humidity 50$; a i r v e l o c i t y 1 m/s; l a y e r t h i c k n e s s e s employed: pure p a s t e : 2 cm mortar: 2 cm concrete: 7 crn 1.41 Cernent ---The t y p i c a l curve f o r a pure cement p a s t e i s reproduced i n Fig.
8.
There i s a s l i g h t expansion f o r t h e f i r s t hour (0.5 rnrn/m), then very r a p i d shrinkage (more than 7 mm/m i n l e s s than3
h o u r s ) . S t a b i l i z a t i o n i s a t t a i n e d a f t e r approximately t h e f i f t h hour; i n f a c t , fro115
t o 211 hours t h e shrinkage i s very s l i g h t , of' t h e order of 0 . 1 t o 0.2 mm/nl. A l l t h e curves have t h i s general shape; only t h e i n d i v i d u a l values vary.Few measurements were made on t h e pure cement p a s t e . However, twelve cements of d i f f e r e n t c h a r a c t e r were observed a f t e r being mixed. This i s c e r t a i n l y too small a number t o permit comparison
of t h e c h a r a c t e r s of cement. However, w e can draw c e r t a i n conclu- s i o n s . The curves show r a t h e r s i m i l a r shapes, but t h e shrinkages commence a t d i f f e r e n t times a s do t h e s t a b i l i z a t i o n s ( t h e s c a t t e r being of t h e same order a s t h a t of t h e time of commencement and
t e r m i n a t i o n of s e t t i n g ) ; t h e s l o p e s of t h e p a r t s of t h e curves c o r - responding t o t h e c r i t i c a l p e r i o d s of s h r i n k a g e a r e n o t a l l i d e n t i - c a l . T h i s would seem t o i n d i c a t e t h a t t h e s l o p e cannot be c o n s i d e r - ed a c h a r a c t e r i s t i c of t h e v e n t i l a t i o n t r e a t m e n t . F i n a l l y , t h e t e r - minal v a l u e s observed a r e v e r y d i s s i m i l a r : from
4
t o 11d
m
depend- i n g on t h e cement. However, t h e m a j o r i t y (two t h i r d s ) a r e s i t u a t e d between6
and 8d m .
Two cements a t t a i n e d 10 and 11 m J m , t h e s e b e i n g s p e c i a l cements of v e r y f i n e g r i n d . Two o t h e r s a r e p l a c e d a t 4 and5 d m .
Nothing i s known of t h e f i n e n e s s of t h e s e and n o t h i n g i s b e i n g done t o f i n d a l i n k between t h e s e s h r i n k a g e v a l u e s and t h e f i n e n e s s o r any o t h e r c h a r a c t e r i s t i c of t h e s e cements.In a d d i t i o n , t h e pure p a s t e s were czixed t o a water c o n t e n t de- terrnined by t h e s t a n d a r d c o n s i s t e n c y . We wished t o o b t a i n a n i d e a of t h e p o s s i b l e d i f f e r e n c e s between d i f f e r e n t cements, b e a r i n g i n mind t h a t t h e s t u d y w a s t o be undertaken on t h e c o n c r e t e s themselves.
1.42 Mortar
I n t h i s f i e l d t h e s t u d y i s v e r y fragmentary. We nterely wished t o determine whether t h i s rnethod of measurement could c o n t r i b u t e t o a wider i n v e s t i g a t i o n . T h i s i n v o l v e s p o s s i b l e improvements i n t h e
t r a d i t i o n a l c o a t i n g s u b s t a n c e s made from m o r t a r s i n c o r p o r a t i n g hy- d r a u l i c b i n d e r s . A nore d e t a i l e d and complete programrne w i l l be de- veloped and undertaken l a t e r .
A s tie have had t o produce f i v e v e r y d i f f e r e n t t y p e s of m o r t a r s f o r t e s t i n g t o g e t h e r w i t h r e g a r d t o t h e c o n s i s t e n c y and p l a s t i c i t y of c o a t i n g m o r t a r s ( t e s t s c a r r i e d o u t under t h e auspice:: of an i n t e r - n a t i o n a l Rilem C . I . B . committee) we s u b j e c t e d t h e n t o o u r method of measureclent
.
The corlipositions of t h e nlortars d i f f e r d i s t i n c t l y from each o t h e r and t h e nleasurements are 1il:eorise d i s t i n c t i v e . I n a d d i - t i o n , vre wanted t o examine t h e i n f l u e n c e of a n i n i t i a l p r o t e c t i o n of t h e c o a t i n g s a g a i n s t p o s s i b l e e v a p o r a t i o n : f o r t h r e e hours a f t e r t h e y had been mixed t h e m o r t a r s were k e p t covered w i t h trct c l o t h s ando n l y at t h e end of t h i s time rrere t h e y s u b j e c t e d t o v e n t i l a t i o n i n t h e 509; r e l a t i v e humidity atri~osphere
.
The ~ n o r t a r s th u s t r c a t e d renairied a l m o s t s t a b l e f o r a n average of two hours b e f o r e shovring d i s t i n c t s h r i n k a g e s . The l a t t e r came about v e r y r a p i d l yw i t h i n t h e space of an hour, T h e r e a f t e r , g e n e r a l l y speaking, s t a b i l i z a t i o n s e t i n . P i g . 9 g i v e s an example of t h e curves ob- t a i n e d , The specimen which has been t r e a t e d , i . e . on which v e n t i - l a t i o n has been delayed, c e r t a i n l y shows a smaller maximum shrink- age t h a n t h e c o n t r o l specimen, a t h i r d o r even a h a l f l e s s , T h i s i s an advantage, but t h e r e may be one v e p j s e r i o u s disadvantage t o t h i s method, f o r i n t h e s h o r t time d u r i n g which shrinkage of t h e t r e a t e d specimen occurs t h e s l o p e i s much s t e e p e r than f o r t h e slow
inkag age of t h e c o n t r o l specimen. Thus, i f t h e mortar has not
acquired s u f f i c i e n t t e n s i l e s t r e n g t h cracks may appear i n t h e t r e a t - ed mortar. I n Fig. 9 t h e d i f f e r e n c e s of s l o p e of t h e two curves during t h e c r i t i c a l p e r i o d of shrinkage a r e g r e a t , and
i t
i s t h e t r e a t e d sample which p r e s e n t s t h e g r e a t e s t danger of cracking, although during a very s h o r t time t o be sure, i . e . i n t h e space of only one hour, it undergoes a shrinkage of 1.6mm/m,
t h e con- t r o l specimen a t no time underwent an hourly shrinkage g r e a t e r than 0.9 rm/m.We do not g i v e t h e curves of t h e f i v e measured mortars, but t h e r e s u l t s a r e contained i n t h e following t a b l e .
According t o t h e s e p r e l i m i n a r y r e s u l t s , t h i s method of measure- ment enables u s t o judge t h e c o a t i n g mortars from t h e p o i n t of view of t h e i r very short-term s u s c e p t i b i l i t y t o cracking and t o e v a l u a t e t h e e f f e c t i v e n e s s of s k i l l of a p p l i c a t i o n o r of a d d i t i v e s . Where Composition of mortar ( i n p a r t s by volume)
Binder :
{
cementlime
R
ILJI?$I2
mm
sand: c r u s l ~ e d limestonegraded Seine s i l i c a limestone
1 2 1
-
-
4-
\?/C i n p a r t s by weight 1.08 1.25 1.10Maximum shrinkage (24 hours i n mrn/m) I
1.10
---
1.61.5
Control mortar 4.9'3.3
Treated mortar ( v e n t i l a t i o n r e t a r d e d 2 0.3 0 3 4 5 1-
5
-
-
1/2 '1/3 3.4 0.9 f o r 3 hours) 1-
-
-
6 1/23
-
-
I
I
2133
I-
-
the latter are concerned caution is indicated, for the method gives shrinlcage values of treated mortars, and generally these values in- crease with the amount of the product incorporated, but then the mortar is modified. Its strength is not indicated by this measure- ment. that tie obtain is the deformation to which it will be submit-
ted under given conditions, but we still do not know, by this method, how the coating will react to this greater shrinkage, and in certain cases this reaction may be favourable. That is why this measure- ment must be supplemented by a technological test which will be de-
scribed later, or by tensile strength or modulus measurements.
1.43
ConcretesWe shall now consider the influence of the concrete parameters: character of the cement, quantity of water added, quantity of sand added, granulometry, but without regard to the character of the ag- gregates and the placing. The latter factor tias the same for all our specimens, i.e. two minutes vibration on the small table so as to measure the
~ 6 b 6
workability.1.431
-
Character of the cementWe
produced the same type of concrete(350
kg cement-
td/C =0.5
-
S/P. = 2--
Seine aggregate) with cements of different character: artificial cements (old CPB and new CPAC-
HRI-
super) ferrocements, blast furnace cements (250/315 and 160/250), slag cements(250/315
and 160/250). The curves all have substantially the same shape. The total shrinlcages at 24 hours range between
1.6
and 2.5 mm/m without showing accumulation for a particular value ( ~ i g . 10).The measurements pertain to too small a number of cements for classification purposes. The other characteristics of these cements were not examined (mechanical strength, specific area, etc .)
.
tJe cannot conclude that one type of cement is more predisposed than another to large initial shrinlcages, but direct measurement on the concrete intended for use at a building site, and carried out for various types of cement, permits a choice of the most suitable solu- tion. One should not consider only the maximum values, but also the shape of the curve. In fact, while the curves show almosti d e n t i c a l shape, t h e s t a r t of t h e period of l a r g e shrinkages may vary between 0 hours and
3
hours a f t e r p l a c i n g . Furthermore, t h e s l o p e of t h i s p a r t of t h e curve i s not s t r i c t l y t h e same f o r a l l . There may be some advantage i n choosing t h e concrete which beginss h r i n k i n g very l a t e but extends i t s shrinkage over a longer p e r i o d , The danger of cracking may be reduced by t h i s .
Our subsequent experiments were not c a r r i e d out w i t h t h e same cement and u n f o r t u n a t e l y we had two d i f f e r e n t cements, a s can be seen
in
Fig. 11 and 12. The c o n c r e t e S/A =$$
i s t h e same; t h e W/C v a l u e s a r e v a r i a b l e , and each f i g u r e r e l a t e s t o a p a r t i c u l a r cement: one g i v e s a rnaxirnum of 2.4 mm/m f o r VJ/C =0.65,
t h e o t h e r 1.6 f o r W/C = 0.55. Thus t h e e f f e c t of t h e cement i s g r e a t , but i t must bes t u d i e d s y s t e m a t i c a l l y i n concrete, w i t h tJ/C v a r i a b l e , T h i s i s wliy our first study a t bJ/C c o n s t a n t i s i n s u f f i c i e n t . EIowever, we mere- l y wanted t o d i s c o v e r whether t h e i n i t i a l parameter o r s t a t e of t h e cement had g r e a t i n f l u e n c e on t h e measurements,' o r whether i t could be d i s r e g a r d e d i n an i n v e s t i g a t i o n f o r t h e development of t h e method.
1.432 Q u a n t i t y of water added
The following c o n c r e t e s were made with Seine aggregates ( g r a v e l s 5/20 mrn
-
sand0/5
rnm).
The measurements were c a r i e d out f o r f o u r o r f i v e v a l u e s of \J/C; t h e 1naxb11wn v a l u e s a s shown on t h e curves of Fig. 11 ( f o r ce- ment A ) and Pig. 1 2 (cement D ) . A s i n d i c a t e d i n t h e preceding sec- t i o n , changing t h e cement considerably increased t h e maximwn value.
The curves of t h e diagrams show t h e same tendency, T o t a l
shrinkage a t 24 hours i n c r e a s e s f i r s t rrith t//C, then becomes s t a b i - l i z e d and d e c r e a s e s when ?,I/C r e a c h e s high v a l u e s (very wet c o n c r e t e s ) .
T h i s was observed i n a l l our experiments. Thc c h o i c e of
!1T/C
canI11 1/2 350 A Concretes made S/A i n p a r t s by weight Cement: dosage Cement: t y p e V I 2/3 350
-
BIV
-
-
-
-1/2350
3 V1/3
350 B I1 1/2 200 A 112 500 At h u s reduce t h e value of t h e shrinkage by a q u a r t e r o r a t h i r d o r even a h a l f . EIowever, t h e curves show an anomaly: f o r l a r g e v a l u e s of \J/C t h e t o t a l shrinkage i s reduced. To e x p l a i n t h i s
we
s t u d i e d t h e curves f o r t h e shrinkage v a r i a t i o n with t h e time. For t h e d i f - f e r e n t cement dosages and d i f f e r e n t granulometries they a r c Inore o r l e s s i d e n t i c a l , and i n Fig. 13 we have shown only those p e r t a l n i n g1
t o S/A =
2,
cement A-
dosage 350 lc6/m3.The specimen containing t h e most water d i d not begin s h r i n k i n g u n t i l two hours a f t e r t h e o t h e r s . The concrete, which was very wet f o r p l a c i n g by v i b r a t i o n , became covered with a l a y e r of l a i t a n c e i n t h e m e t a l l i c mould. The l a t t e r evaporated f i r s t , but during t h i s period t h e concrete j u s t below it apparently d i d not lose' any water and t h u s underwent no change i n l e n g t h . A f t e r t h a t t h e evaporation reached t h e open f a c e of t h e concrete and shrinkage began. Presum- ably, t h e r e f o r e , t h e l a y e r of excess water a c t e d a s a covering. T h i s displacement of t h e curves with r e s p e c t t o time seems t o
ex-
p l a i n t h e phenomenon. tJe wished t o v e r i f y t h i s by followilzg t h e same procedure t h a t we used f o r t h e mortars. For a concrete of average \J/C we covered a specimen with x e t r a g s f o r t h e f i r s t t h r e e hours and subjected i t t o v e n t i l a t i o n only afterwards. We repeated t h e experiments f o r s e v e r a l cements and s e v e r a l tJ/C values. The same phenomenon was observed. One i n s t a n c e only i s i l l u s t r a t e d i n Fig. 14. t h e n shrinkage begins t h r e e hours l a t e r it comes about
q u i t e r a p i d l y , s i n c e i t ceases a t approximately t h e same time as f o r t h e c o n t r o l concrete, but i t s maxilnwn value i s reduced ( i n t h i s case from 1.5 t o 1.05 rmn/m), rvhich i s by no means n e g l i g i b l e . tJe d e f i n i t e l y f i n d a s i m i l a r i t y with t h e decrease of shrinkage when \J/C i s very l a r g e . The l a y e r of s u r f a c e water p r o t e c t s t h e concrete a g a i n s t t h e v a r i a t i o n s of l e n g t h due t o evaporation, but we do not examine t h e problem f o r t h e o t h e r a s p e c t s which may be involved.
To sum up, t h e choice of t h e IJ/C may reduce t h e m a x i m u m value of t h e shrinkage.
1.433 Cement dosage
The c o n c r e t e s I, I1 and I11 of t h e preceding s e c t i o n revealed t h e importance of ceinent dosage. Fig. ,11 sununarizes t h e m a x i n u n
values obtained f o r v a r i a b l e W/C values. Three curves a r e obtained (one f o r each dosage) f o r which t h e l a r g e s t shrinkages a r e observed. We then note t h a t t h i s shrinkage i n c r e a s e s l i n e a r l y with t h e dosage: from 0.8 mm/m f o r 200 kg of cement, it becomes 1.6 f o r 350 kg of cement and 2.4 f o r 500 kg.
The cement dosage i s t h u s an important f a c t o r . We d i d not r e - peat t h e s e measurements with o t h e r t y p e s of concrete and d i f f e r e n t
cements, but t h e s e would produce s i m i l a r r e s u l t s . We a r e not i n t e r - e s t e d i n i n c r e a s i n g t h e dosage. For concrete and cement A, p u t t i n g 50 kg cement more i n c r e a s e s t h e shrinkage by about 0.3 m / m ; with o t h e r cements o r o t h e r compositions, t h i s i n f l u e n c e may s t i l l be g r e a t e r , because cement A gave some of t h e s m a l l e s t shrinkage values t h a t we observed.
1.434 Granulometry
Concretes I V , V and V I d i f f e r i n t h e i r S/A values. They range from a c l a s s i c a l concrete of approximately 800 l i t r e s g r a v e l and 400 l i t r e s sand t o a concrete containing t h e maximum amount of sand. We v a r i e d t h e \J/c values, because t h e concretes cannot be compared a t \J/C c o n s t a n t . Fig. 12 swnrnarizes t h e maximum shrinkage values. Increasing t h e amount of sand appears t o be u n s e t t l i n g whenever it i s accompanied by a r a t h e r s u b s t a n t i a l i n c r e a s e i n t h e water dosage. The shrinkage i s increased approximately by a f a c t o r of 4/3, but i f t h e \f/C values a r e kept approximately t h e same f o r a l l our concretes, i . e . i f we s t i c k t o dry concretes, t h e shrinkage values do not i n - crease p e r c e p t i b l y .
We made no systematic i n v e s t i g a t i o n of t h e e f f e c t s of t h e
granulometry, but have contented o u r s e l v e s with recording t h e above r e s u l t s . The method of measurement can f u r n i s h valuable i n d i c a t i o n s of t h e behaviour of any concretes during t h e f i r s t 24 hours of i t s l i f e
.
1.44 Reinforced concrete
The above measurements apply t o l a y e r s of concrete
7
cm i n t h i c h e s s . Generally, however, t h e r e i s no such t h i c k n e s s around reinforcements. Now, we have seen t h a t t h e n a t u r e of t h e mouldbottom g r e a t l y a f f e c t s t h e measured v a l u e s of t h e shrinkage because of t h e f a c t t h a t it may r e s t r i c t t h e movements of t h e specimen.
We t h e r e f o r e wished t o o b t a i n quickly a n i d e a of t h e shrinkage r e s t r i c t i o n t h a t could be produced by reinforcements under c o n d i t i o n of v e n t i l a t i o n i n a d ~ j atmosphere. For concrete of 350 kg cement,
1
S/A =
F ,
W/C = 0.65. However, u s i n g a d i f f e r e n t type of cement from t h a t employed i n t h e preceding t e s t , we poured a c o n t r o l spec- imen (without r e i n f o r c e m e n t s ) , one i n c o r p o r a t i n g a deformed r o d 20 mrn i n diameter placed so a s t o be covered by 2 crn concrete,and one w i t h two defomned r o d s 12 mrn i n d i m e t e r s e p a r a t e d l a t e r a l l y by 2.5 cm of c o n c r e t e and covered w i t h 2 cm of concrete ( i . e . t h e upper p a r t of t h e reinforcements i s 2 cm below t h e evaporation sur f a c e ) . The maxixwn shrinkages found a r e ( F i g .15):
1.95 mm/m f o r t h e c o n t r o l ;
0.65 mm/m f o r t h e specimen c o n t a i n i n g one rod; 0.35 mm/m f o r t h e specimen c o n t a i n i n g two r o d s .
The phenomena a g a i n show t h e same p a t t e r n . The shrinkages begin and end a t a p p r o x i ~ n a t e l y t h e same time, but t h e i r maximum v a l u e s d l f f e r s h a r p l y , The presence of reinforcements n e a r t h e s u r f a c e reduces t h e shrinkage t o one q u a r t e r and even a s i x t h of t h e i r v a l u e , T h i s i s very favourable i n reducing t h e r i s k of crack- ing, but t h e n i t appears t h a t measurement of t h e pure concrete alone i s inadequate f o r t e s t i n g a t t h e b u i l d i n g s i t e , and t h e specimen must reproduce t h e t r u e reinforcement c o n d i t i o n s , T h i s i s a corn- p l i c a t i o n , but not a g r e a t one,
1.5
ConclusionsThe method of measurement developed can perform valuable s e r - v i c e . It sho~vs th e very considerable shrinkages of concrete t h a t can occur during i t s s e t t i n g , These shrinkages can be reduced i n v a r i o u s (reinforcements, r e s t r i c t i o n of t h e evaporation, choice of cenent, of W / C , t h e q u a n t i t y of sand, e t c ,)
.
The t e s t c o n d i t i o n swere a r b i t r a r i l y s e l e c t e d a d can q u i t e e a s i l y be rnodified f o r t h e r e a l i z a t i o l i of comparative . t e s t s . It would be u s e f u l , ho~vever, t o e s t a b l i s h standard values:
50:;
r e l a t i v e humidity and a flow of 1 r / s do not seem t o be a p r i o r i e s s e n t i a l c o n d i t i o n s , The a i rflorlr v e l o c i t y , i n p a r t i c u l a r , i s very moderate. Actually i t might be b e t t e r t o employ g r e a t e r v e l o c i t i e s t o study t h e behaviour of
concrete i n t h e presence of high winds t h a t might occur a t c e r t a i n b u i l d i n g s i t e s .
2 . Test of the Behaviour of t h e Coating on i t s Support
2.1 P r i n c i p l e and apparatus
The above method enables u s t o measure shrinkages under given conditions, but does not permit us t o p r e d i c t how t h e m a t e r i a l w i l l r e s i s t t h i s deformation. The measurement g i v e s u s v a r i o u s shrink- age values, but t h e s e must be i n t e r p r e t e d i n o r d e r t o a s s e s s t h e p r o b a b i l i t y of cracking under given c o n d i t i o n s . T h i s i s why M r . Lefevre thought t h a t another t e c h n o l o g i c a l t e s t t o examine t h e be- haviour of c o a t i n g mortars on t h e base should be added. This t e s t e s t a b l i s h e s time of' cracking f o r a c o a t i n g mortar placed i n a c e r - t a i n way and subjected t o c e r t a i n evaporation conditions.
The apparatus ( ~ i g . 1 6 ) c o n s i s t s of a m e t a l l i c mould of r e c - t a n g u l a r c r o s s - s e c t i o n 0.10
x
0.10 m and 1 m i n l e n g t h . I n t o t h i s we pour a l a y e r of concrete 0.08 cm thiclc which i s l e f t unsrnoothed a s it i s poured, and which i s l a t e r t o be covered by a l a y e r of 0.02 crn of t h e mortar t o be s t u d i e d .The whole apparatus i s placed i n a room a t 20aC and 507; r e l a - t i v e humidity and i s exposed t o t h e a i r from a f a n placed 1 m above t h e specimen. The a i r c i r c u l z t i o n t h u s c r e a t e d corresponds t o a wind speed of
3
m/s i n t h e v e n t i l a t i o n t u n n e l of our above measuring apparatus. Actually, i d e n t i c a l shrinlcages a r e obtained by p l a c i n g o u r apparatus e i t h e r 1 m below t h e f a n , o r i n t h e v e n t i l a t i o n t u n n e l u s i n g an a i r flow v e l o c i t y of3
m/s.The t e s t c o n s i s t s i n examining t h e open f a c e of t h e coating and n o t i n g t h e moment when cracking, i f any, becomes v i s i b l e t o t h e naked eye. The time o r i g i n i s taken a s t h e conclusion of t h e a p p l i - c a t i o n of t h e c o a t i n g t o t h e concrete base. The shrinkage of t h e c o a t i n g i s r e s t r i c t e d by t h e concrete support, and t e n s i l e s t r e s s e s can occur which may r e s u l t i n s u r f a c e cracking.
2.2 Study of c e r t a i n parameters
The very b r i e f study consisted i n t h e r a p i d i n v e s t i g a t i o n of c e r t a i n parameters t h a t a r e of i n t e r e s t f o r t h e p l a c i n g of c o a t i n g s and i n determining t h e i r influence on t h e observed time of cracking.
2.21 M0rta.r dosage
Placed on a concrete support, w i t h a dosage of 350 kg cement and aged s e v e r a l days, t h e mortars were produced with CPB cement 250/315 and Seine sand 0/2 rnm:
mortar 1/1 cracked i n 20 minutes;
mortar 1/2 cracked i n one hour and t e n minutes; mortars 1/2.5 and
1/3
d i d not crack.2-22 Character of t h e cement
Mortar 1/2 was produced w i t h two d i f f e r e n t cements: CPB 250/
315
andHRI.
The craclcing times a r e : one hour and t e n minutes f o rCPB 250/315; 45 minutes f o r
HHI.
S i m i l a r l y , mortar 1/1 cracks i n one hour and 30 minutes f o r
a
CPAC cement, and 20 minutes f o ra
CPB cement.2.23 Thickness of coating
Mortar 1/2, with t h e same cement CPB 250/315, was a p p l i e d i n l a y e r s of
3,
2 and 1 cm t h i c k n e s s . The cracking times a r e as f o l - lotrs:35 minutes f o r j cm;
one hour and t e n minutes f o r 2 cm; no cracks f o r 1 cm.
2 -24 Reinforcements
-
We wished t o see whether t h e use of a mesh could reduce t h e danger of cracking. Under t h e conditions of t h e preceding t e s t s a mesh of t h e r a b b i t cage type was placed a t h a l f t h e depth of t h e
2 cm c o a t i n g of mortar 1/2. The time of cracking d i d not change, On t h e o t h e r hand, a welded l a t t i c e with square meshes of 5 mrn s i z e prevented cracking a l t o g e t h e r , a s d i d a r o l l e d metal g r i l l w o r k of 10 mm mesh s i z e placed a t h a l f t h e depth of t h e coating.
2.25 P r o t e c t i o n a g a i n s t e v a p o r a t i o n
Various specimens of mortar 1/2 w i t h a CPAC cement were pro- t e c t e d a g a i n s t e v a p o r a t i o n by wet r a g s f o r two and a q u a r t e r hours a f t e r t h e i r a p p l i c a t i o n . When t h e y were t h e n s u b j e c t e d t o v e n t i l a - t i o n t h e f o l l o w i n g c r a c k i n g times, measured from t h e time of a p p l i - c a t i o n of t h e c o a t i n g were observed ( ~ i g .
17
and18):
P r o t e c t i o n a g a i n s t e v a p o r a t i o n i s t h u s d e f i n i t e l y e f f e c t i v e i f i t i s a p p l i e d long enough. 1 h 30 min
3
hours no c r a c k i n g 11 2.26 I n f l u e n c e of t h e supportThe above t e s t s were lllade on a c o n c r e t e support which . w a s al- Specimen v e n t i l a t e d as soon as a p p l i e d
11 I I
2 h a f t e r a p p l i e d
I1 I I
4 "
II II11 I I 8 " !I I 1
ready s e v e r a l days o l d and had a very rough s u r f a c e . ( ~ f t e r t h e c o n c r e t e had been placed i t was warped w i t h a t r o w e l having a d i s - t o r t e d f a c e so t h a t t h e b l a d e l e f t c o n s i d e r a b l e grooves on t h e sur- f a c e . The i d e a v a s t o reduce t h e c a u s e s of d i s p e r s i o n due t o t h e s t a t e of t h e c o n c r e t e support by producing a v e r y rough s u r f a c e . )
The adhesion of t h e c o a t i n g depends, of course, on t h e s t a t e of t h i s support, b u t we contented o u r s e l v e s w i t h s t u d y i n g what t a k e s p l a c e w i t h very green c o n c r e t e . Ibe a g a i n t a k e mortar 1/2 w i t h ce- ment CPB 250/315 and apply it on very g r e e n s u p p o r t s . Elc have ob-
t a i n e d no cracliilzg u n l e s s o w s u p p o r t i n g c o n c r e t e had hardened f o r about
15
hours. A r t c r t h i s time t h e c o a t i n g cracked i n 1 hour and 1 0 minutes, r e g a r d l e s s of t h e age of t h e s u p p o r t . We a p p l i e d t h e c o a t i n g t o c o n c r e t e s of 0 .LL hours, 3 hours, 18 hours, 24 hours and48 hours age. For t h e f i r s t t h r e e t h e r e was no cracking; f o r t h e o t h e r t h r e e t h e sane c r a c k i n z time of 1 houi- 10 minutes was o b t a i n -
ed, which agpears t o be
a
s p e c i f i c v a l u e of mortar 1/2 produced i nt h i s lmg.
Sii.I;h 2 mortar 1/1 and ccrnent CPAC t h e sane phenomenon was ob-
c r e t e was l e s s than
4
hours old. A f t e r4
hours, t h e concrete crack- ed a t 1 hour and 30 miriutes. We t r i e d t h i s coating on supports of 0, 1, 2,3 ,
4 hours arid 30 minutes,5
hours and 15 minutes and5
hours and 30 minutes. For t h e f i r s t f o u r t h e r e was no cracking, even when v e n t i l a t i o n was continued f o r 24 hours. For t h e other four, t h e same times of 1 hour and 30 minutes were obtained f o r t h e cracking.
2.3 T e s t s on p l a t e s
The above specimen 1
x
0.1x
0.02 m may seem some~~hat abnormal f o r t h e study of coatings. There i s generally no such asymmetry between t h e two dimensions of t h e evaporation surface. This i swhy M r . Lefevre decided t o produce under exactly t h e same conditions a s above, p l a t e s of
0.5
x0.5
m and 0.08 m t h i c k . These were ofconcrete, and t h e 0.02 m above were f i l l e d with t h e coating m a t e r i a l . Two p l a t e s were prepared i n t h i s way and covered with a mortar 1/1 with t h e cement CPB from t h e t e s t recounted i n Section 2.21. Where t h e p l a t e was subjected immediately t o v e n t i l a t i o n a f t e r i t s prep- a r a t i o n ( t h e sand was one metre above i t ) cracks appeared i n
30
minutes ( s e e Fig. 1 9 ) . Using t h e fissurometer r u l e i t was possible t o estimate t h e width of t h e s e cracks. They varied from 0.1 t o 1
mm.
The time of cracking i s very s i m i l a r t o t h a t obtained on t h e rectangular mould (20 minutes).The second p l a t e was not exposed t o v e n t i l a t i o n . It remained i n t h e room a t 5076 r e l a t i v e humidity. It d i d not crack. It was l e f t i n t h e room f o r several months and a f t e r t h r e e months a f i n e network of cracks was observed ( s e e Fig. 2 0 ) . These cracks a r e very f i n e , not exceeding 0.1 mm width.
Although no o t h e r experiments were made on these p l a t e s , we wished t o r e p o r t t h e r e s u l t s , because t h i s technological t e s t on
square p l a t e s , it seems t o
us,
should be developed f o r t h e study of coating mortars.3.
B i b l i o g r a p h i c a l SummaryWe have proceeded t o make some b i b l i o g r a p h i c a l searches on t h i s s u b j e c t . The phenomenon was noted many y e a r s ago but i t s more o r l e s s d e t a i l e d study seems t o d a t e only from r e c e n t y e a r s , and it i s s t i l l a question l a r g e l y of t h e i n v e s t i g a t i o n of prototype apparatus.
I n a paper which appeared i n 1952 on t h e shrinkage of cements and concretes L'Hermite and Grieu presented some d a t a on shrink- age i n t h e f i r s t hours a f t e r mixing. Their apparatus enabled them t o make measurements of volume v a r i a t i o n s i n a closed atmosphere and t h e experimental curves were s i m i l a r t o t h e ones found by u s . The study undertaken a t t h a t time was abandoned because of t h e ex- perimental d i f f i c u l t i e s encountered i n p l a c i n g t h e pure p a s t e and i n t h e measurement i t s e l f .
We have found a few r e f e r e n c e s i n a communication of E. Meyer and K.E.C. Nielsen presented a t t h e I n t e r n a t i o n a l Congress of Manu- f a c t u r e d Concrete, 1957(2). The Danish engineers d i s t i n g u i s h e d be- tween s e v e r a l kinds of shrinkage, and i n p a r t i c u l a r t h e " p r e s e t
shrinkage" and t h e " p o s t - s e t shrinkage". The f i r s t , which i s a measure of t h e changes of volume during s e t t i n g , c e r t a i n l y c o r r e s - ponds t o what we a r e concerned with. However, t h e exact boundary between t h e s e two kinds of shrinkage i s r a t h e r d i f f i c u l t t o d e t e r - mine. On t h e b a s i s of our diagrams i t might be t h e moment when t h e
curve of l i n e a r v a r i a t i o n s becomes very f l a t .
These a u t h o r s r e f e r t o t h e r e s u l t s of e a r l y t e s t s made by Graf and reported i n Beton und Eisen i n 1921 and by E. Suenson i n Ingen- i o r e n i n 1923. The few values given cannot be compared w i t h o u r s because we do not h o w t h e exact conditions under which t h e t e s t s were c a r r i e d out (degree of humidity, v e n t i l a t i o n , temperature). However, it was e s t a b l i s h e d t h a t " p r e s e t shrinkage" was important f o r pure p a s t e s a t standard consistency, while it was not measurr a b l e f o r mortars mixed t o t h e consistency of wet e a r t h .
I n Belgium, M r . Dutron, D i r e c t o r of t h e Laboratoire du Groupe- ment des Producteurs de Ciments de Belgique, experimented w i t h