C E N T R E D' ÉT U D E S E T D E R E C H E R C H E S S U R L E D E V E L O P P E M E N T I N T E R N A T I O N A L
SÉRIE ÉTUDES ET DOCUMENTS
Community mills and women's empowerment in Burkina Faso
Claudio Araujo
Catherine Araujo-Bonjean
Victor Beguerie
Études et Documents n° 17
December 2018
To cite this document:
Araujo C., Araujo-Bonjean C., Beguerie V. (2018) “Community mills and women’s
empowerment in Burkina Faso”, Études et Documents, n° 17, CERDI.
CERDI
PÔLE TERTIAIRE 26 AVENUE LÉON BLUM F- 63000 CLERMONT FERRAND TEL. + 33 4 73 17 74 00 FAX + 33 4 73 17 74 28
2
The authors
Claudio Araujo
Associate Professor - École d’économie and Centre d’études et de recherches sur le
développement international - Université Clermont Auvergne, CNRS, IRD, CERDI, F-63000
Clermont-Ferrand, France.
Email address:
claudio.araujo@uca.fr
Catherine Araujo-Bonjean
CNRS Researcher - École d’économie and Centre d’études et de recherches sur le
développement international - Université Clermont Auvergne, CNRS, IRD, CERDI, F-63000
Clermont-Ferrand, France.
Email address:
catherine.araujo-bonjean@uca.fr
Victor Beguerie
PhD in Economics - École d’économie and Centre d’études et de recherches sur le
développement international - Université Clermont Auvergne, CNRS, IRD, CERDI, F-63000
Clermont-Ferrand, France.
Email address:
victor.beguerie@uca.fr
Corresponding author: Catherine Araujo-Bonjean
This work was supported by the LABEX IDGM+ (ANR-10-LABX-14-01) within the program “Investissements d’Avenir” operated by the French National Research Agency (ANR).
Études et Documents are available online at: https://cerdi.uca.fr/etudes-et-documents/
Director of Publication: Grégoire Rota-Graziosi
Editor: Catherine Araujo-Bonjean
Publisher: Mariannick Cornec
ISSN: 2114 - 7957
Disclaimer:
Études et Documents is a working papers series. Working Papers are not refereed, they constitute research in progress. Responsibility for the contents and opinions expressed in the working papers rests solely with the authors. Comments and suggestions are welcome and should be addressed to the authors.
3
Abstract
The Multi-Functional Platforms program consists of setting up powered community mills
managed by women in rural areas. By strengthening women’s capacities in areas traditionally
reserved for men, the program places women at the core of local development and places
emphasis on the empowerment of women. To assess the impact of community mills on
women’s empowerment, which is by its very nature a non-observable variable with multiple
dimensions, we propose an original operational framework based on Sen's capability theory.
We argue that community mills participate in women’s empowerment by giving them more
control over the decision-making process in all spheres of their life (agency freedom), and by
expanding their capability set (well-being freedom). We use structural equation modeling to
explore the relationship between these two unobservable latent variables, and to assess the
impact of community mills. The database is taken from a survey of 2,400 women living in 200
villages in Burkina Faso. The results are consistent with a positive impact of the program on
women’s empowerment. The results also confirm the validity of the approach for evaluating
a potentially important, but hard-to-value, intangible outcome of a development program like
individual empowerment.
Keywords
Capability, Agency, Structural equation model, Burkina Faso.
JEL Codes
1 Introduction
In Burkina Faso local cereals such as sorghum, millet, and maize are the staple foods of the ru-ral population. While urban consumers are turning to imported flour which is ready for use, rural families produce their own flour from local grains to make pastry, bread, cakes, and other processed foods.1 Within the household, women are responsible for primary grain processing (threshing, husking, and grinding) and meal preparation. The husband gives his wife the daily ration of cereals and she performs milling herself or bears the financial burden of milling from her own resources. She must also provide the other ingredients, mainly vegetables and condi-ments, necessary to cook meals.
The traditional method of grinding, still used today by women, is to pound the grain with a pestle in a wooden mortar, or to crush the grain using grinding stones. Before grinding, the cereal grain is first threshed, then moistened, and pounded to separate the edible grain from the husk. The grains are dried in the sun, then winnowed to remove the chaff, and soaked again before being ground. In rural areas, these chores, along with food production and water collec-tion, are the biggest human energy and human time consuming activities. They are carried out daily by women and girls. They are a considerable workload and a substantial source of fatigue (Ouattara, 2007). According to estimates for Burkina Faso, a woman spends two to three hours per day to process sorghum and millet for her family (Brew-Hammond and Crole-Rees, 2004).
Numerous development projects have attempted, without success, to initiate the develop-ment of a flour milling industry to process local cereals. However, an artisanal grain-processing sector has developed since the introduction of new mechanical flour milling systems in the 1970s. Privately owned hullers and grinders, operating on a small scale, have been established all over the country. In 2000, a joint regional project of the United Nations Industrial Develop-ment Organization (UNIDO) and the International Fund for Agricultural DevelopDevelop-ment (IFAD) started implementing Multi-Functional Platforms (MFP)2in villages that were not connected to the national electrical grid. MFPs are equipped with a small diesel engine to power dif-ferent types of milling machinery. The basic and most common version of the MFP only has a grinder. Advanced versions include additional elements such as a huller, an oil-press, and a battery charger. More recent MFPs turn a generator to produce electricity for lighting, for pumping water, and for powering welders, drills, and saws (Burn and Coche, 2001). The motor
1In our sample 99.75% of the households process cereals themselves.
2The Multi-Functional Platforms concept was developed in 1993. The project was first implemented in Burkina
Faso and Mali, and then extended to Côte d’Ivoire, Senegal, and Guinea. After a pilot phase, the project imple-mentation was transferred to local authorities. In Burkina Faso, the project became a national program in 2004:
Programme National Plates-formes Multifonctionnelles pour la Lutte Contre la Pauvreté. The program received the
and most of the equipment are imported from India or China. The technology and the func-tioning of the MFP are simple. Maintenance and repairs can be carried out by local craftsmen (Brew-Hammond and Crole-Rees, 2004).
Rather than their multifunctionality, which until 2010 was very limited, what differentiates MFPs from artisanal mills is the nature of property rights and their management. MFPs are assigned to a women’s group (Groupement Féminin Villageois), and managed by a committee made up of women (Comité Féminin de Gestion). The members of the management committee are given training in literacy, accounting, and financial management. Installation, operation, maintenance and repair of the MFPs are done by local technicians who receive specific training in mechanics, welding, electricity etc. The members of the women’s committee management are also trained to operate and maintain the MFP autonomously.
The MFP is expected to generate income that will contribute to a greater economic and financial independence of the women’s group. The MFP is also expected to contribute to the economic emancipation of users by increasing labor productivity in food processing. The mill frees up time, thus allowing women to reorganize their activities. They can allocate more time to income generating activities that will provide them with additional resources. But the expected benefits of the program are not restricted to the economic sphere, women may also devote more time to resting or to non-financial activities that they value, such as participation in social activities.
Furthermore, the MFP program is expected to contribute to changing attitudes and social relationships within the village community. By strengthening the capacities of the members of the management committee in many areas, including areas traditionally reserved for men, the program seeks to promote the social status of these women and to establish them as a model for their community. As a consequence of the notoriety the program confers upon them, and their increased skills, women are expected to be given more consideration, to be more involved in the decision-making processes both in their family and at the community level. The MFP is also a place for social interactions which participate in women’s emancipation and strengthen solidarity among them.
The MFP program that puts women at the core of local development draws on the theory of human development developed by Amartya Sen. Women are considered to be “active agents of change” that is “the dynamic promoters of social transformation that can alter the lives of both women and men” (Sen, 1999, 191). By enhancing women’s agency, which is a crucial aspect of “development as freedom”, the MFP program is expected to give women more power to act and to bring about beneficial change in their lives and in their community.
its empowering effect on women. According to the results, MFPs significantly reduce the work burden of women, but have no significant impact on their income nor on children’s education and nutritional status (Beguerie, 2015). Although disappointing, these results are not incon-sistent with an expansion of women’s agency. In a low income country like Burkina Faso, free agency of women is expected to have a direct bearing on their living conditions, but its impact goes well beyond well-being aspects. Ignoring the relationships between agency and well-being is reductive and may produce misleading results.
This paper specifically aims to assess the impact of MFPs on women’s empowerment, which is by its very nature a non-observable variable with multiple dimensions, and proposes an orig-inal operational framework. Drawing on Sen’s capability approach, we consider empowerment as a process which enhances women’s freedom to act and to achieve what they consider valu-able. We argue that MFPs participate in the empowerment of women by giving them more control over the decision making process in all spheres of their life (agency freedom), and by expanding their capability set (well-being freedom).
We use Structural Equation Modeling (SEM) to explore the relationships between these two unobservable latent variables, and to assess the impact of the MFPs. The database is taken from a household survey of 2,400 women living in 200 villages in Burkina Faso (see map - Figure A1 - in appendix). The survey which was undertaken in 2011,3provides a large set of indicators of agency achievements in the personal, economic, political, and social spheres, and indicators of the women’s quality of life and standard of living. The results confirm the interest of the approach for evaluating a potentially important, but hard to value, intangible outcome of a development program. They show a positive impact of the program on women’s empowerment, and are robust to a number of alternative specifications of the model.
The second section of the paper provides information on the social and economic effects of the program. The third section is devoted to the conceptual framework. The fourth section presents the key assumptions and the empirical model. The fifth section gives details of the database and displays the sample characteristics. The sixth section discusses the estimation results, and the last section offers conclusions.
3The survey has been conducted by a research team from the Centre d’Etudes et de Recherche sur le
Développe-ment International (CERDI) at Clermont-Fd, the Institut de Hautes Etudes Internationales et du DéveloppeDéveloppe-ment (IHEID) at Genève, and the Institut de Développement Rural (IDR) at Bobo-Dioulasso.
2 The economic and social impacts of Multifunctional Platforms
The mechanical mill has been a major innovation in agro-processing. Its use in West Africa has prompted many studies about its socioeconomic benefits (see for instance Sovacool et al., 2013). Most of the research is based on qualitative studies conducted by sociologists and economists. They show that mills, and more specifically community mills managed by women, contribute to women’s empowerment in two ways: by reducing their time constraint and improving their productivity, and by changing the social rules and customs that govern their position in the community.
Greater economic independence
MFPs are a direct source of income for a small number of employees - miller, technicians and guards - but they are expected to contribute indirectly to women’s income by increasing the productivity of their labor. Mechanical milling reduces the energy expenditure of women and the time they previously spent grinding. The time saved by each woman varies according to the quantity processed, which depends on the season, the household size, and the number of women in the household sharing the workload. The time saved is greater when the MFP does mechanical hulling in addition to grinding. The survey shows that the use of mechanical milling, releases seven to eight hours of women’s time per week (Beguerie, 2015).
The mechanical mill releases women’s time for other activities and does not necessarily lead to a reduction in their working time. Grain processing and cooking, collection of water for hu-mans and livestock, collection of firewood, and care of children are tasks that fall to women. They work in the fields during the rainy season, with and under the authority of their husband to produce food crops (millet, sorghum etc.) and cash crops (cotton) but the income from ac-tivities belongs to their husband. The women’s own income comes from plots, made available to them by their husband, which they cultivate during winter. On these plots they produce veg-etables (tomato, beans, eggplant, etc), condiments (pepper, okra, sorrel, etc), and some corn and rice that are primarily intended to meet family needs. Part of the women’s crops is har-vested and processed for sale on local markets. This is the case for shea nuts (which are ground and pressed for oil), millet, sorghum, sesame, beans, and peanuts which are processed in vari-ous ways (boiled, dried, crushed or ground) and used in the preparation of beer, cakes, donuts, pastry, and couscous to be sold.
From the MFP project designer’s perspective, productivity gains in grain processing should allow women to develop income generating activities; but the obstacles they face are numer-ous. A restricted access to production factors severely limits their productive capacity. Women
do not have the right to own land, and they depend on their husband for access to the tools they need for agricultural production (pick, hoe, etc) which are exclusively owned by men. Also, the MFP increases the financial burden borne by women. They have to pay for mechanical grind-ing whereas manual grindgrind-ing is a non-market service. Husbands give their wives the grains to be processed but they do not always give them the money to pay for mechanical grinding. Ac-cording to the survey, 25% of women have to use their own resources to pay for mechanical grinding.
Social advancement
The social impacts of MFPs seem to be more important than the economic ones. According to sociological studies, mechanical grinding alters social relationships inside and outside the family circle, and changes the role and place of women in their community. The social effects are especially important when the mill is operated by a group of women.
Geographical mobility of women and social interaction
The mechanical mill saves time for women and expands their living space. Manual grinding is a domestic activity that takes place on the family concession. By contrast, mechanical grinding takes place outside the domestic area. In our sample about 30% of the MFPs are installed in a public space devoted to the women’s group, and about 40% in a private space, usually the concession of the village head. Mechanical milling obliges the woman to leave her home and exposes her to public view, especially when the distance from the mill is large. So the nature and quantity of crops to grind are known to all, which provides information about the household’s activities and wealth. According to Ki (2000), milling grains outside the family exposes women to public scrutiny, but it is a source of pride, self-esteem and consideration from their peers. Women are proud to bring grains to the mill, especially when they have large amounts to grind. They place great importance on their physical appearance and dress to go to the mill with great care.
The MFP is also a meeting place that opens women to the outside world. Like the market place and the water well, it is a place for social interactions. Women exchange information, share personal experience with other village women, and sometimes share experience with women from neighboring villages (Ki, 2000). In the same way, the MFP is a factor for social inte-gration which strengthens solidarity and community spirit within the women’s group. Women agree to work together, think about their problems, and help each other. Finally, the encounters at the mill are also important leisure opportunities for rural women.
New roles for women
The MFP changes social relationships by giving women new roles with responsibilities and so-cial status. In a cultural context where metallurgy is reserved for men, the grain processing busi-ness, which is traditionally undertaken by women, becomes a men’s activity when it is mech-anized and takes place outside the domestic setting. The MFP challenges this gender division of labor. The members of the management committee (GFG) are trained in mechanics, they learn how to operate and carry out routine maintenance and repair by themselves. They are also given training courses in writing, accounting and management, before assuming their new functions.
Experience shows that women usually delegate the operation of the MFP to a man (Be-guerie, 2015). The miller of the MFP is usually a man even though women have been trained for this job. But the miller works under the supervision of the CFG’s women who control the flour quality and monitor income recording. In rare cases, women also leave the management of the MFP to a man. This is the case when they do not dare to break a social taboo or are being pressurized by men of the village.
As a general rule, the CFG’s women acquire new skills and responsibilities. President, sec-retary, and treasurer are positions that attest to a high level of qualifications and confer social status. The president is the interlocutor with donors, she participates in meetings with other village officials, and her power goes well beyond the women’s group. Women who participate in the management of MFPs are actors in their own lives, and examples for others. They are well integrated into their community, they are consulted and involved in the village life. They are more respected by their husband and the community members, including the village head and local authorities. They gain an economic and social power that gives them a sense of pride and strengthens their self-esteem (see Ouattara, 2007; Ki, 2000).
3 The conceptual framework
There is no consensus on the definition of empowerment and there have been many attempts to operationalize the concept in the economic literature (e.g. Ibrahim and Alkire, 2007).4 Most theoretical and empirical studies refer to the Amartya Sen’s capability approach, and consider empowerment as a process which allows a powerless group to gain agency (Trommlerova et al., 2015). Thus empowerment as an increase in agency is a process that enhances people’s free-doms to act and to achieve what they consider valuable. Drawing on this literature, we now
discuss four important aspects of agency freedom that were used to build the empirical model.
The multiple dimensions of agency
Sen considers people as responsible agents who act and bring about change to shape their own destiny (Sen, 1999). He distinguishes two distinct but interrelated aspects of a person that have both intrinsic values: the agency aspect and the well-being aspect. According to Sen, empow-erment should not be restricted to a process of expanding well-being freedom, but should be seen as a wider process that gives people more freedom to act as an agent.
In Sen’s words, agency freedom refers to “what the person is free to do and achieve in pursuit of whatever goals or values he or she regards as important” (Sen, 1985, 203). Agency freedom is freedom to take action in all spheres of life. It is a multidimensional concept that should be measured in various dimensions: economic, socio-cultural, family, legal, political, and psycho-logical (e.g. Narayan, 2005; Ibrahim and Alkire, 2007). Agency freedom is more general than well-being freedom since it is not tied to any type of aim. Well-being freedom is the freedom to achieve something specific - well-being. In this regard, Robeyns (2005) and Keleher (2014) pointed to the need to clearly distinguish three nested concepts: standard of living which is the well-being related to one’s own life; well-being which is the standard of living augmented by outcomes resulting from sympathies (well-being of others), and agency which is well-being supplemented with commitments, i.e., actions which are not beneficial to the agent herself.
It is important to note that agency is a broader concept than well-being but agency freedom does not subsume well-being freedom (Sen, 1985). A person’s well-being may be enhanced or diminished by his or her agency role, i.e., his or her capacity to make choices (Sen, 1985, 1992). On the one hand, agency is intrinsically valuable: “acting freely and being able to choose are, in this view, directly conductive to well-being” (Sen, 1992, 51). Thus, exerting agency, i.e. having the opportunity to make choices and using the opportunity to choose, enhances well-being. On the other hand, acting as an agent may reduce other aspects of well-being. In some circum-stances, agency achievement, i.e. being successful in the pursuit of one’s goals and objectives, may diminish one’s well-being (Sen, 1992, 56). As highlighted by Clark (2005), individuals of-ten have agency goals, for instance fighting for political rights, that transcend and sometimes conflict with personal well-being.
Conversely, well-being relates to agency in that individuals who are healthy, and/or have other personal advantages, have a greater power to act as an agent (Keleher, 2014). In Sen’s own words: “a person’s agency may affect his or her well-being and being well may help a person’s ability to act in pursuit of other objectives as well” (Sen, 1985, 208).
The control dimension of freedom
In Sen’s capability approach the process by which outcomes are attained is at least as important as the outcomes themselves. He distinguishes two elements of freedom: effective power versus control. Effective power refers to a person’s power to achieve chosen results. Control refers to a person’s ability to exert control over the process of choice.
This distinction between “having one’s objectives realized and participating in the realiza-tion of one’s objectives” (Sen, 1992, 56 - 58) is important for the definirealiza-tion of empowerment. Power can operate in the absence of any explicit agency. For instance, the formal and informal institutions that govern a community tend to ensure social reproduction and the achievement of social, cultural or economic outcomes without any exercise of agency (Kabeer, 2001). For Sen, “effective power” cannot be attributed to agency. Freedom as control requires a procedure of free decision giving the individual the opportunity to achieve his or her objectives (Sen, 1993, 522).
In the empirical literature most agency indicators aim to catch the control dimension of agency, i.e., a person’s ability to make autonomous choices. Agency as control over the decision process is measured through questions which aim to identify the person who usually makes decisions about resource allocation (Alkire, 2008). Such agency indicators do not provide infor-mation about whether the actions are successful in terms of the agency goals.
The achievement dimension of freedom
Individual decisional autonomy is at the core of agency, but the concept of agency freedom also incorporates the notion of achievement: agency freedom is “one’s freedom to bring about the achievements one values and which one attempts to produce” (Sen, 1992, 158). Authors such as Keleher (2014) and Kabeer (1999) have stressed the importance of the achievement dimension of agency that is often neglected in the empirical literature. Alsop and Heinsohn (2005) define empowerment as a person’s capacity to make “effective” choices, i.e., to transform choices into desired actions and outcomes. They measure agency achievement for women by indicators such as women’s mobility in the public domain or women’s participation in public action.
Like agency, Sen’s concept of well-being freedom has an achievement dimension. A person’s well-being freedom is defined by his or her capability set which consists of a combination of potential functionings (beings and doings) that he or she can choose to have (Sen, 1985). Well-being achievement is the set of achieved functionings. Functionings include elementary things such as being adequately nourished, being literate, being healthy and more complex ones such as being happy, having self-respect, taking part in the life of the community (Sen, 1992).
Measuring the freedom dimension of well-being and agency is often considered to be em-pirically impossible. Only a set of achieved outcomes of well-being and agency can be observed. Therefore, the difficulty is to extrapolate the freedom dimension of well-being and agency from a set of achieved outcomes.
The pre-conditions for exerting agency
The opportunity for an individual to exert agency depends on personal, social, and institutional factors, or preconditions, which define the opportunity structure (Narayan, 2002; Ibrahim and Alkire, 2007; Alsop et al., 2006). The opportunity structure encompasses the social, political, and economic opportunities that the individual faces (Sen, 1999). It determines whether the individual can use resources, goods and services, to achieve the desired outcomes (Alsop and Heinsohn, 2005). In other words, increased access to resources may not enhance agency free-dom if the social norms or other factors in their environment prevent individuals from using these resources purposefully.
Formal and informal institutions, such as laws, regulatory frameworks, norms, and customs which govern agents’ behavior are at the core of the opportunity structure. The opportunity to exert agency fruitfully also depends on individuals’ assets (material, human, social, and psy-chological) and command over the assets (through information, property rights, etc), and on collective assets, such as organizations and collective representations that determine individu-als’ capability to act together (see Narayan, 2005; Ibrahim and Alkire, 2007).
Robeyns (2005) distinguishes three groups of factors which are at work in the conversion of resources into achieved functionings:5personal conversion factors (physical and mental char-acteristics, knowledge and skills); social conversion factors (public policies, social norms, gen-dered division of work, societal hierarchies or power relations, customary laws and tradition); environmental conversion factors (climate, geographical location, etc). These conversion fac-tors impact both the capability set (opportunity to choose) and the preference formation (pro-cess of choice).
5The capability set of a person is determined by her resources (the commodity bundle), a conversion function
that converts commodities into characteristics, and a personal utilization function by which the person converts characteristics into functionings.
4 Main hypothesis and model setup
Multi-Functional Platforms are expected to participate in women’s empowerment by enhanc-ing their capacity to make autonomous choices (agency freedom) and by expandenhanc-ing their ca-pabilities (well-being freedom). To test these hypotheses we use a Structural Equation Model (SEM) that takes into account the unobservable and multidimensional aspect of agency and well-being freedom. The model we propose can be seen as an expansion of Krishnakumar (2007) and Krishnakumar and Ballon (2008) who were the first to use a SEM for operational-izing the capability approach. In the rest of this section we specify our assumptions and the econometric model.
The main hypothesis
We assume that MFPs enlarge the opportunity structure for women thereby contributing di-rectly to their agency freedom. MFPs may also contribute indidi-rectly to women’s empowerment by expanding their well-being freedom, which in turn is expected to impact on their power to make choices.
By giving time to women and freeing them from some traditional social rules, MFPs are ex-pected to have a direct positive impact on women’s agency freedom. Women can use the time saved to develop income generating activities or any social or nonmarket activities. Their free-dom to choose between alternative activities is all the greater as the MFP strengthens their po-sition in the decision making process. As noted above, the MFP program is expected to change the social rules and customs that govern women’s positions in their family and community. Women acquire new skills and knowledge and get improved social status that should give them greater self-esteem, more self-confidence and more power to act freely.
Greater self-determination is expected to be an important means to achieve higher well-being, but MFPs also have a direct impact on women’s well-being by alleviating their workload. Using the MPF to husk and grind grain into flour frees women from exhausting tasks and en-ables them to start cooking food earlier in the day. As a consequence of more timely meal prepa-ration, family members, especially children, should be better fed (Sovacool et al., 2013). MFPs may also contribute to enlarging women’s capabilities by increasing the profitability of their income generating activities based on the processing of agricultural products like shea butter. Higher incomes and increased agency freedom will give them more freedom to choose from a larger set of functionings. In return, increased well-being freedom is expected to give women greater power to act as agents.
Agency freedom and well-being freedom cannot be measured directly, but outcome indi-cators are observable. We select a wide range of achievement indiindi-cators representing the do-mains in which women are assumed to exert agency and the dimensions of well-being they are assumed to value. As stressed by Alkire (2008) the choice of achievement indicators cannot be completely free of value judgments as to the domains in which women value an expression of power. To minimize this source of bias, we select the maximum number of indicators available in the data.
Indicators of agency achievements are selected to reflect the various dimensions of agency, in the personal, economic, social, and political spheres of life. In contrast to many empirical studies which focus on the ability of women to make decisions with respect to the household’s expenditures, we also consider women’s ability to change aspects of their own life and to induce change at the community and political level. For well-being, we focus on basic capabilities that are assumed to be of the highest importance for the majority of women in rural Burkina Faso. Basic capabilities are a subset of all capabilities. They refer to the basic needs that must be met to survive and escape poverty (Sen, 1987). Being adequately nourished, being in good health, and being adequately sheltered, are generally considered as elementary functionings that are strongly valued by all at an early stage of development (Robeyns, 2005).
The Path diagram
Figure 1 gives a graphical representation of the relationships between the main concepts that are at the core of our analysis. Observed variables are in boxes; unobserved variables are in circles. Straight single-head arrows represent hypothesized causal relations between two vari-ables, in the direction shown by the arrow. Two straight single-head arrows connecting two variables signify reciprocal causation. Curved lines with two arrowheads represent correlations between exogenous predictor variables or between disturbances that are not explained by the model.
Agency and Well-being are the two interrelated endogenous and unobservable variables of interest (latent variables). They are determined simultaneously and influence each other. An expansion in agency is expected to enhance well-being, and an increase in well-being may help in expanding agency. Agency and Well-being are determined by exogenous and observable vari-ables that define the opportunity structure (left part of the diagram). They are measured at the individual, household and community level. They encompass indicators of the woman’s hu-man and material assets, indicators of her position and power relations within the household, as well as household and community (village) characteristics. The presence of a MFP in the
vil-lage is considered as an exogenous factor of the opportunity structure that strengthens women’s ability to make autonomous choices and enlarges their capability set.
Agency and Well-being are assumed to cause a set of observed variables, the achievement indicators (right part of the diagram). The agency achievement indicators are in four categories. They aim to catch the degree of a woman’s self-determination in the economic and personal sphere of life, and the degree of a woman’s involvement at the community and political level. The indicators of well-being achievements catch the quality of health, education, nutrition and housing.
Figure 1: Path diagram: 2 latent
Agency Well-being Woman’s assets Woman’s position in the household Household’s characteristics Village’s characteristics Self-determination in economic sphere Self-determination in personal sphere Community commitment Political commitment Health Education Nutrition Housing ε1 ε2 ξ1 ξ2 ξ3 ξ4 ξ5 ξ6 ξ7 ξ8 Path model Measurement model
The model
The model combines a structural part and a measurement part. The structural part, also re-ferred to as the path model, consists of simultaneous equations which represent the causal relationships between the endogenous unobserved variables (η) and the exogenous observed variables (x). This is a non-recursive model, with a feedback loop between the two latent vari-ables. The measurement model relates the latent endogenous variables to observed indicators (y). The latent variables are mediators; they are response variables in some regression equa-tions and predictors in other equaequa-tions. For instance, Agency is hypothesized to be a mediator between the opportunity structure and well-being achievements.
In Figure 1 the arrows from the latent variables to endogenous indicators represent linear regression coefficients or “factor loadings”. Because the latent do not completely explain ob-served variation in indicators, each obob-served indicator is associated with an unobob-served mea-surement error (ξ). The endogenous latent are partially explained by the model; ε are random disturbances in the equations. The arrows from the exogenous predictors to the latent represent coefficients in linear multiple regressions.
In matrix notation the general model specification, with continuous variables and linear relationships, is given by:6
η = Γη + Bx + ε (1)
y = Λη + ξ (2)
Where:
η is a (m ×1) vector of latent endogenous variables. x is a (q ×1) vector of observable exogenous variables. y is a (p × 1) vector of indicators of the latent endogenous variables. Γ is a (m × m) matrix of structural parameters linking latent endogenous variables to each other.Λ is a (p ×m) matrix of factor loadings linking indicators to latent variables. B is a (m × q) matrix of structural parameters relating latent endogenous variables to exogenous variables. The matrix (I –B ) is nonsingular. ε is a (m × 1) vector of structural disturbances; E(ε) = 0 and E(εε0) =Ψ. ξ is a (p × 1) vector of measurement errors in the endogenous indicators; E(ξ) = 0 and E(ξξ0) =Θ. ξ is uncorrelated withε.
The unknown parameters are estimated by the maximum likelihood estimator,7minimizing a fitting function based on the discrepancy between the sample covariance matrix of observed
6See Bollen (1989)
variable (S) and the covariance matrix implied by the model (Σ) that can be expressed as a func-tion ofθ the vector of unknown parameters to be estimated (Σ = Σ(θ)).The fitting function is (Kirby and Bollen, 2009):
FM L= l n|Σ(θ)| + t r [Σ−1(θ)S] − ln|S| − k + [ ˆz − µ(θ)]0Σ−1(θ)[ ˆz − µ(θ)] (3) θ tincludes the regression coefficients (Γ,Λ,B) and the measurement-error covariance (Θ and Ψ); µ(θ) is the vector of model implied means; ˆz is the vector of sample means of the observed variables; k is the number of observed variables.
The parameters are consistent and asymptotically normal if all variables (observed and la-tent) follow a multivariate normal distribution. This assumption does not hold when using non-continuous variables, which is the case: the observed dependent variables involve a com-bination of continuous and categorical data. To overcome this issue, we use two alternative estimation strategies. First, working on a large sample (N >200) we use non-parametric boot-strap resampling to obtain corrected p-values (Bollen and Stine, 1993; Kline, 2016). We also test for the robustness of the results by using robust maximum likelihood estimation and the Satorra and Bentler (1994) correction. Second, we use a generalized linear model to take into account the distributional properties of the outcome variables (continuous, binary, ordinal, count, or multinomial).
To ensure that the model is identified we refer to the identification rules established by Bollen (1989). Two necessary, but not sufficient conditions must be satisfied: the model’s de-grees of freedom must be at least zero8and every latent variable, including disturbances and error terms, must be scaled. To meet the latter condition, when estimating the model one load-ing factorλ (in matrix Λ) for each latent variable is set to 1, and the path coefficient for error variables is also set to 1. Additional requirements are given by the two-step identification rule, which consists of assessing that the measurement part, then the structural part of the model are identified. Our model satisfies the two parts of the two-step rule: each factor (Agency and Well-being) having more than two indicators, the measurement parameters of the model are identified by the two-indicators rule; applying the rank condition, which is a necessary and suf-ficient condition, we can show that the path model is identified (Bollen, 1989, 101-103). The two-step rule being satisfied and the degrees of freedom positive we conclude that the whole model is over-identified.
8The degrees of freedom is given by1/
2(p + q)(p + q + 1)–t, with t the number of free and constrained elements
5 The village selection and the database
This section briefly describes the MFP program and the survey, and presents the main statistical features of the sample.
The main features of the program
The Multi-Functional Platform program started in 2004, after a four year pilot phase. The pro-gram began in the East region of Burkina Faso before expanding in the Center-East, Boucle du Mouhoun, Center-West and North. More than 300 units were installed in the 2000-2009 period.
The program’s villages are not randomly chosen. They have to pass a selection process coor-dinated by the program’s regional office (Agence Locale de Réalisation). A women’s association wishing to have a MFP deposes a request to the regional office. The decision to attribute a MFP to the requesting group depends on the result of an evaluation process (Etude de Faisabilité Participative) carried out by independent consultants. The main criteria of selection are: the financial capacity of the village, the market size, and the management capacity of the group. The selection process also takes into account the poverty level of the village, the existing access to energy, and the infrastructures. The presence of an active women’s group is important, but the crucial point for the allocation of a MFP is a strong social cohesion within the village.
The women’s association which will have a MFP contributes to its financing and deals with the construction of the necessary building. The MFP is installed by local craftsmen trained by the program. After the installation phase, the units become autonomous and do not receive other grants for operating. As a general rule, a village cannot have more than one MFP.
The sample characteristics
Our data come from a survey conducted in June 2011 of 2,400 households located in 200 villages in Burkina Faso (Figure A1 in appendix). Out of the 200 sample villages, 133 have a working MFP, which was installed between 2005 and 2010. These villages were randomly selected, respecting the regional distribution of the program. The other villages were selected randomly from a list of potential future MFP sites. These villages’ request to obtain a MFP was under examination at the time of the sample design.
12 households per village were randomly selected using the “itinerary method”, i.e., accord-ing to their distance from the village center. This procedure allows the different areas of the
village to be equally represented in the sample. The household head and one of his wives were surveyed. All children below five years were weighed and their height measured.
Sample descriptive statistics for the achievement indicators, and the exogenous variables of the model are provided in Table A1 in appendix A. The sample villages are of relatively small size with an average population of about 2,000 people. They are located in remote areas, away from major access roads (on average 48 km from the nearest paved road). Although isolated, virtually all villages have a school and are covered by a phone network. Just under 80% of the villages have at least one private mill.
The main socio-economic characteristics of the households are typical of a low-income country. They are comparable to the national averages for households living in rural parts of Burkina Faso. The birth rate is high (more than 5 children per woman), the child mortality rate is high (0.129 on average), and the rate of chronic malnutrition within young children is high (34.6%). The average age of children going to school for the first time is 6-7 years, which corre-sponds to the legal school age, but the ratio of children of school age going to school (enrollment rate) is low (54% on average).
The literacy rate is low, and there is a marked gender difference to the detriment of women - 20% of women are literate against 30% for men. Women are on average 10 years younger than their husbands, their mean age at first marriage is about 17 years, and they have their first child two years later. Women participate actively in economic, political and social activities. More than 80% of them are engaged in income generating activities. Almost all women are mem-bers of at least one village association. More than 60% of women voted in the last presidential elections in 2010. They devote more than 6 hours per day to domestic work, 3 hours to income generating activities, and just over an hour to leisure activities.
6 Estimation results
We first estimate a non-recursive model allowing the two latent variables to covary, then we ex-plore the causality between Agency and being and focus on a recursive model, with Well-being as a determinant of Agency. We use a large set of measurement indicators for the latent variables and test the robustness of the results across different sub-sets of measurement indica-tors. We also test the robustness of the results using alternative specifications for the structural part of the model.
Main results
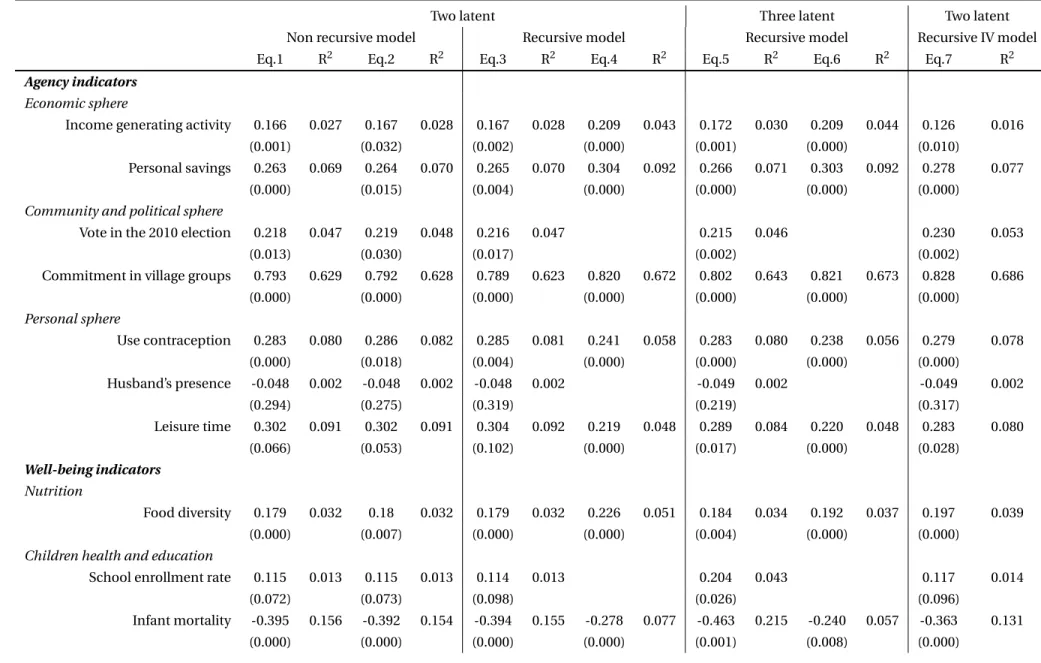
The estimation results for the measurement equations are provided in Table 1. Correspond-ing results for the structural equations are provided in Table 2. The path coefficients are given in standardized form, i.e., in standard deviation units. Each indicator being associated with only one latent, the standardized coefficients in measurement equations are the correlation co-efficients between the indicator and the latent. In the structural equations, the standardized partial regression coefficients are the beta weights; they can be compared to infer the relative predictive power of each variable.
The measurement equations include seven observed indicators of agency achievements and twelve indicators of well-being achievements (Table 1). Among agency measures, carry-ing out an income generatcarry-ing activity and holdcarry-ing personal savcarry-ings are two indicators of the woman’s self-determination in the economic sphere. Increasing leisure time and using con-traception are considered as reflecting self-determination in the personal sphere. Conversely, the presence of her husband during the interview is considered as a lack of autonomy of the woman. Commitment to village associations and having voted in the last presidential election, are taken as indicators of the woman’s involvement at the community and political level. The latent Agency is expected to contribute positively to all these indicators except to the indicator “husband’s presence during the interview” which should be negatively correlated to Agency.
The indicators of well-being achievements include the height for age z-score, which catches the health status, and the mortality rate of the woman’s children. The enrollment rate catches the educational status of her children. The latent Well-being is expected to contribute positively to these two observed indicators. The woman’s age at first child is expected to be positively cor-related with the woman’s welfare while the number of births (by the woman’s age) and the time she devotes to domestic work are expected to be negatively correlated with her welfare. A di-etary diversity score measures the household access to food. Housing conditions are measured by indicators for wall, roof and floor strength, access to improved water source and improved sanitation facilities. These indicators of food access and living conditions are expected to be positively correlated to the latent Well-being.
Table 1: Measurement equations results
Two latent Three latent Two latent
Non recursive model Recursive model Recursive model Recursive IV model
Eq.1 R2 Eq.2 R2 Eq.3 R2 Eq.4 R2 Eq.5 R2 Eq.6 R2 Eq.7 R2
Agency indicators
Economic sphere
Income generating activity 0.166 0.027 0.167 0.028 0.167 0.028 0.209 0.043 0.172 0.030 0.209 0.044 0.126 0.016
(0.001) (0.032) (0.002) (0.000) (0.001) (0.000) (0.010)
Personal savings 0.263 0.069 0.264 0.070 0.265 0.070 0.304 0.092 0.266 0.071 0.303 0.092 0.278 0.077
(0.000) (0.015) (0.004) (0.000) (0.000) (0.000) (0.000)
Community and political sphere
Vote in the 2010 election 0.218 0.047 0.219 0.048 0.216 0.047 0.215 0.046 0.230 0.053
(0.013) (0.030) (0.017) (0.002) (0.002)
Commitment in village groups 0.793 0.629 0.792 0.628 0.789 0.623 0.820 0.672 0.802 0.643 0.821 0.673 0.828 0.686
(0.000) (0.000) (0.000) (0.000) (0.000) (0.000) (0.000) Personal sphere Use contraception 0.283 0.080 0.286 0.082 0.285 0.081 0.241 0.058 0.283 0.080 0.238 0.056 0.279 0.078 (0.000) (0.018) (0.004) (0.000) (0.000) (0.000) (0.000) Husband’s presence -0.048 0.002 -0.048 0.002 -0.048 0.002 -0.049 0.002 -0.049 0.002 (0.294) (0.275) (0.319) (0.219) (0.317) Leisure time 0.302 0.091 0.302 0.091 0.304 0.092 0.219 0.048 0.289 0.084 0.220 0.048 0.283 0.080 (0.066) (0.053) (0.102) (0.000) (0.017) (0.000) (0.028) Well-being indicators Nutrition Food diversity 0.179 0.032 0.18 0.032 0.179 0.032 0.226 0.051 0.184 0.034 0.192 0.037 0.197 0.039 (0.000) (0.007) (0.000) (0.000) (0.004) (0.000) (0.000)
Children health and education
School enrollment rate 0.115 0.013 0.115 0.013 0.114 0.013 0.204 0.043 0.117 0.014
(0.072) (0.073) (0.098) (0.026) (0.096)
Infant mortality -0.395 0.156 -0.392 0.154 -0.394 0.155 -0.278 0.077 -0.463 0.215 -0.240 0.057 -0.363 0.131
(0.000) (0.000) (0.000) (0.000) (0.001) (0.008) (0.000)
Table 1 – Continued
Two latent Three latent Two latent
Non recursive model Recursive model Recursive model Recursive IV model
Eq.1 R2 Eq.2 R2 Eq.3 R2 Eq.4 R2 Eq.5 R2 Eq.6 R2 Eq.7 R2
Height for Age Z-score 0.204 0.041 0.206 0.042 0.205 0.042 0.204 0.041 0.190 0.036
(0.001) (0.003) (0.006) (0.014) (0.002)
Woman’s tiredness
Domestic working time -0.196 0.038 -0.194 0.038 -0.197 0.039 -0.268 0.073 -0.308 0.095 -0.202 0.041
(0.003) (0.011) (0.004) (0.006) (0.000) (0.005)
Age at first child 0.139 0.019 0.143 0.021 0.142 0.020 0.222 0.048 0.084 0.007
(0.060) (0.037) (0.050) (0.019) (0.243)
Child per age -0.426 0.181 -0.423 0.179 -0.424 0.180 -0.278 0.078 -0.516 0.262 -0.257 0.066 -0.359 0.129
(0.000) (0.000) (0.000) (0.000) (0.002) (0.006) (0.000)
Living condition indicators
Housing Solid roof 0.237 0.056 0.238 0.057 0.238 0.057 0.203 0.041 0.139 0.019 0.293 0.086 (0.001) (0.002) (0.001) (0.001) (0.000) (0.000) Cement floor 0.702 0.493 0.704 0.496 0.703 0.494 0.708 0.502 0.714 0.512 0.748 0.560 0.715 0.512 (0.000) (0.000) (0.000) (0.000) (0.000) (0.000) (0.000) Hard walls 0.413 0.171 0.414 0.171 0.413 0.171 0.414 0.171 0.417 0.175 0.430 0.185 0.464 0.216 (0.000) (0.000) (0.000) (0.000) (0.000) (0.000) (0.000) Basic amenities
Access to drinking water 0.394 0.155 0.393 0.154 0.394 0.155 0.394 0.155 0.425 0.180 0.373 0.139 0.386 0.149
(0.000) (0.000) (0.000) (0.000) (0.001) (0.000) (0.000)
Improved sanitation 0.169 0.029 0.170 0.029 0.170 0.029 0.122 0.015 0.145 0.021
(0.013) (0.015) (0.009) (0.044) (0.028)
No obs 600 600 600 1777 600 1775 462
Notes: Standardized coefficients. Bootstrapped p-values for 1000 replications are in parenthesis
The inclusion of health and education indicators reduces the sample to 600 observations corresponding to mothers with young children aged 0 to 5 years, and children of school age 7 to 12 years old. To enlarge the sample size and test the robustness of the results to the choice of measurement indicators, we use a restricted set of indicators, dropping the education and the health indicators, and five others whose contribution to their latent is low. Using this restricted set of indicators, the sample size increases from 600 to 1,777 observations (Eq.4 and Eq.6).
In all measurement equations (Table 1) the latent Agency and Well-being have the expected sign and are, with few exceptions, significantly correlated with the measurement indicators.9 The latent Agency is strongly correlated with commitment to village associations: Agency ex-plains more than 60% of the variance of this indicator. The latent Well-being is mostly associ-ated with indicators of housing quality: the floor quality (R2> 0.49), the wall quality (R2> 0.17), and improved sanitary facilities (R2> 0.15). The human dimension of well-being is mainly as-sociated with the infant mortality rate and the number of births per age.
Estimation results for the structural equations highlight the main drivers of Agency and Well-being and their relationships (Table 2). In the first specification, we explore whether a correla-tion exists between the two latent. The results show that they are strongly and positively corre-lated, with covariance equal to 0.445 (Eq 1). In the second specification, we test for a bi-causal relationship between Agency and Well-being. Because the two latent are not significant in the reverse causality model (Eq2.) the model is re-specified as a more simple recursive one. Since Agency is not significant in the Well-being equation we use a recursive model with Well-being a predictor of Agency. This model is estimated for the complete set of measurement indicators (Eq. 3) and for the restricted set of indicators (Eq.4).
9The coefficient of the indicator « Husband’s presence » is never significantly different from zero in the
Table 2: Structural equation results
Two latent Three latent Two latent recursive
Non recursive model Recursive model Recursive model IV model GSEM
Eq.1 Eq.2 Eq.3 Eq.4 Eq.5 Eq.6 Eq.7 Eq.8
Agency Wellbeing Agency Wellbeing Agency Wellbeing Agency Wellbeing Agency Q.of Life Liv. Cond. Agency Q.of Life Liv. Cond. Agency Wellbeing MFP Agency Wellbeing
Latent variable Wellbeing 0.216 0.408 0.369 0.323 0.414 0.356 2.411 (0.750) (0.031) (0.000) (0.071) (0.018) (0.036) (0.016) Agency 0.236 (0.672) Living conditions 0.826 0.741 (0.001) (0.000) cov(Well-B, Agency) 0.445 (0.009)
Woman’s place in the family
Woman literate 0.015 0.004 0.012 0.113 0.038 0.032 0.016 0.076
(0.766) (0.946) (0.810) (0.000) (0.516) (0.578) (0.777) (0.001)
Diff. in age with HH -0.14 -0.115 -0.113 -0.059 -0.121 -0.065 -0.105 0.011
(0.01) (0.108) (0.039) (0.020) (0.042) (0.011) (0.089) (0.810) Age of the HH -0.091 -0.054 -0.076 -0.101 -0.076 -0.065 -0.094 (0.047) (0.449) (0.085) (0.000) (0.11) (0.023) (0.066) Husband characteristics Literate 0.101 0.117 0.099 0.062 0.094 0.070 0.074 0.099 (0.057) (0.149) (0.080) (0.021) (0.069) (0.022) () (0.305) (0.023) Cattle breeder 0.062 -0.044 0.075 -0.058 0.081 -0.045 0.093 -0.02 0.073 -0.064 0.090 -0.075 0.072 -0.002 0.000 0.603 -0.206 (0.188) (0.272) (0.246) (0.371) (0.093) (0.254) (0.001) (0.331) (0.146) (0.169) (0.001) (0.005) (0.291) (0.965) (0.992) (0.488) (0.005) Trader 0.008 0.084 -0.011 0.085 -0.028 0.085 -0.031 0.051 -0.007 0.101 -0.023 0.065 -0.02 0.073 0.013 1.331 0.125 (0.856) (0.069) (0.903) (0.085) (0.544) (0.073) (0.169) (0.050) (0.874) (0.025) (0.264) (0.025) (0.649) (0.157) (0.766) (0.116) (0.024)
Institutions, social rules
Muslism 0.136 0.116 0.136 0.104 0.134 0.107 0.120 0.140 (0.013) (0.213) (0.011) (0.000) (0.010) (0.000) (0.072) (0.004) Gourmanché 0.216 0.216 0.217 0.155 0.229 0.155 0.101 0.037 (0.012) (0.046) (0.019) (0.006) (0.014) (0.011) (0.283) (0.580) Villages’s characteristics Multi-F Platform 0.116 0.017 0.113 -0.015 0.109 0.018 0.064 0.025 0.112 0.070 0.126 0.427 (0.016) (0.712) (0.095) (0.867) (0.026) (0.706) (0.016) (0.344) (0.021) (0.007) (0.027) (0.036)
Change in the village’s chief -0.319
(0.000)
Private mill -0.025 0.062 -0.039 0.071 -0.052 0.064 -0.043 0.037 -0.038 -0.004 -0.053 0.044 -0.044 0.014 0.043 -0.182 -0.012 (0.590) (0.199) (0.635) (0.226) (0.345) (0.234) (0.094) (0.178) (0.504) (0.958) (0.132) (0.420) (0.453) (0.818) (0.349) (0.453) (0.497)
School 0.021 0.019 0.020 0.050 0.084 -0.001 0.016 0.172
(0.704) (0.763) (0.655) (0.010) (0.113) (0.987) (0.622) (0.003)
Dist.from paved road -0.019 -0.151 0.011 -0.148 0.040 -0.149 0.040 -0.158 0.026 -0.084 0.102 -0.244 0.072 -0.282 -0.087 0.000 -0.001 (0.736) (0.025) (0.913) (0.043) (0.468) (0.018) (0.197) (0.000) (0.664) (0.374) (0.069) (0.003) (0.380) (0.001) (0.123) (0.964) (0.000) Dist. from Reg. capital -0.166 -0.188 -0.126 -0.148 -0.089 -0.189 -0.098 -0.106 -0.059 -0.289 -0.059 -0.151 -0.082 -0.049 0.171 -0.058 -0.067 (0.007) (0.005) (0.329) (0.173) (0.183) (0.005) (0.003) (0.002) (0.419) (0.003) (0.200) (0.038) (0.281) (0.554) (0.000) (0.778) (0.000) Population -0.083 0.011 -0.084 0.029 -0.086 0.010 -0.096 0.016 -0.106 0.084 -0.151 0.137 -0.053 0.040 -0.066 -0.173 0.018 (0.064) (0.802) (0.202) (0.678) (0.114) (0.836) (0.000) (0.538) (0.060) (0.206) (0.000) (0.029) (0.366) (0.452) (0.153) (0.077) (0.014) Regional dummies yes yes yes yes yes yes yes yes yes yes yes yes yes yes yes yes yes yes yes
mc2 0.555 0.497 0.62 0.568 0.642 0.494 0.55 0.597 0.614 0.685 0.506 0.545 0.954 0.504 0.639 0.484 0.219
No obs 600 600 600 1 777 600 1775 462 2251
HH: household head; Q. of Life: quality of life; Liv. Cond: living condition.
Eq.1 to Eq.7. Standardized coefficients and bootstrapped p-values for 1000 replications in parenthesis. Eq. 7. IV Model: Instrumental variable model. MFP regression includes an intercept.
Eq.8. GSEM: generalized structural equation model. Unstandardized coefficients and robust p-values in parenthesis.
mc2 is the Bentler-Raykov squared multiple correlation coefficient (mc2 = R2 for recursive models).
In specifications Eq.3 and Eq.4 Well-being is a stable and significant determinant of Agency, supporting the hypothesis that a woman’s ability to act as an agent is enhanced by her human and physical capital. In addition to Well-being, which strongly determines Agency, the presence of a Multi-Functional Platform in the village contributes positively and significantly to women’s self-determination. The standardized coefficient of MFP varies from 0.064 to 0.116 while the unstandardized coefficient (not presented here) remains stable across the four equations rang-ing from 0.011 to 0.013. By contrast, the presence of a private mill in the village does not have any significant impact on women’s agency. As expected, the age difference between the woman and her husband, which is taken as an indicator of inequality in conjugal relationships, con-tributes negatively to woman’s agency. Conversely, the results show that a woman’s agency in-creases with the educational level of her husband (caught by the dummy “literate”). As regards the role of economic activity, women whose husbands are cattle breeders appear to have more freedom to act, everything else being equal.
The introduction of dummies for ethnic group and religion reveals heterogeneity in women’s capacity to exert agency according to the social norms and customs associated with ethnicity and religion. The distance from the capital city of the region, which catches the remoteness of the village, contributes negatively to agency. More surprisingly, women’s agency decreases with increasing size of village (population). The explanation may be that women’s commitment in the community, the main component of agency, is less important in large villages.
According to the results, the presence of a Multi-Functional Platform in the village is not as-sociated with higher (or lower) well-being. The variable MFP never contributes significantly to the well-being regression equation, and the presence of a private mill does not either. Women’s well-being increases with their education level (being literate) and decreases with the age of the household head. Women whose husband is a trader tend to achieve a higher level of well-being. As regards village characteristics, the presence of a school tend to be a significant marker of higher well-being. However, the coefficient of this variable appears to be unstable across the estimations. Unsurprisingly, the remoteness of the village (measured by the village distance from a paved road) impacts negatively on women’s human and physical capital. Last, regional dummies show that geographic disparities in well-being are strong.
Model fit
With a minimum of 600 observations in the most complete specification, our sample satisfies the “minimum sample size” rule of Kline (2016). According to this rule, the sample size should be no less than 200 observations, and preferably no less than 400, to provide unbiased
param-eters and accurate model fit. To assess whether the model fits the data we compute a standard set of absolute, incremental, and parsimony fit indices (see Table 2 and 3 for the results and the appendix B for their interpretation).
The overall coefficient of determination for the specifications 1 to 4 is high (> 0.80) suggest-ing good fit of the model to the data (Table 3). Agency is fairly well determined by the model with a coefficient of determination (or mc2) ranging from 0.555 to 0.642 according to the model specification (Table 2). Well-being is less accurately estimated with mc2ranging between 0.494 and 0.597 (Table 2). The RMSEA varies between 0.062 and 0.065 (Table 3) indicating an ade-quate fit to the data although our model fails the close-fit test (Pclose < 0.05). Because the upper limit of the 90% confidence interval of the RMSEA is lower than 0.10, the poor-fit hypothesis is rejected for all specifications. The SRMR is always lower than 0.08, which is the cut-off for poor fitting models. The low value of the CFI and TLI indicate poor goodness of fit. However, these indices are not informative when the average correlation between variables is low (Kenny, 2015), which is the case for our sample. The RMSEA for the baseline model, in which all endoge-nous variables are uncorrelated, is equal to 0.106. It is less than the cut-off (0.158) indicating weak correlation in the dataset.
Alternative specifications
In addition to considering different set of measurement indicators, we check the sensitivity of the results to four alternative specifications of the model.
First, the results appear to be robust to alternative covariance specifications. The results given in Table 2 are produced for pairwise covariance across the indicators’ measurement er-rors set to zero. We drop this hypothesis to take into account for possible omitted variables common to some indicators. Specifically, we allow for non-zero error covariance between the measurement errors of Personal savings and Income generating activity, among Infant mortal-ity ratio, Age at first child and Births per age, and among Roof, Wall, Soil qualmortal-ity and Improved sanitary facilities. The results for the predictive power of the determinants of Agency and Well-being remain unchanged and the model’s goodness-of-fit improves (see Table A2 and A3 in the appendix).
Table 3: Fit indices
Two latent Three latent Two latent
Non recursive model Recursive model Recursive model Recursive IV model
Eq.1 Eq.2 Eq.3 Eq.4 Eq.5 Eq.6 Eq.7
Absolute fit RMSEA 0.062 0.062 0.062 0.065 0.059 0.066 0.059 RMSEA_SB 0.062 0.062 0.062 0.064 0.059 0.066 0.059 RMSEA 90% CI [0.059; 0.066] [0.059; 0.066] [0.059; 0.066] [0.062; 0.068] [0.056; 0.063] [0.064; 0.068] [0.055; 0.063] Pclose 0.000 0.000 0.000 0.000 0.000 0.000 0.000 SRMR 0.059 0.059 0.059 0.048 0.056 0.051 0.060 Overall CD 0.811 0.827 0.810 0.814 0.878 0.973 0.839 Baseline comparison CFI_SB 0.469 0.468 0.468 0.604 0.488 0.525 0.519 TLI_SB 0.413 0.411 0.412 0.527 0.433 0.448 0.457 Information criteria AIC 35934.78 35937.33 35936.19 76997.23 34218.12 81706.591 26926.94 BIC 37148.33 37155.28 37149.75 78378.87 35629.53 83367.50 28134.53 No Obs 600 600 600 1777 600 1775 462
CI: Confidence Interval.
_SB: The RMSEA, CFI and TLI being dependent on the assumption of joint normality of the observed variables, they are computed by using the Satorra–Bentler scaled chi-squared statistic robust to non-normality (Satorra and Bentler, 1994).
Second, we consider an alternative model specification, which differentiates between two dimensions of well-being: the woman’s quality of life and her material living conditions. Thus we estimate a three latent variable model (Agency, Quality of life, Living conditions) with Living conditions a determinant of Quality of life. The indicators of Quality of life achievements are: the health status and schooling of children, the time spent by the woman in domestic work and her number of children per age. The indicators of Living conditions are those which catch housing quality and access to basic amenities. In this specification the exogenous determinants of living conditions are geographical dummies, and some characteristics of the household head.
The estimation results correspond to Eq.5 and Eq.6. The overall coefficient of determina-tion (CD) increases significantly (Table 3). The CD for Agency (Table 2) also increases, but less. With CD higher than 0.9 in Eq.6, the latent Quality of life appears to be correctly measured. The results for the measurement part of the model are close to the previous one with respect to the contribution of each latent to its indicators.10 The results for the structural part of the model show that Living conditions strongly determines the latent Quality of life with a standardized coefficient greater than 0.7. The dummy variable for the presence of a Multi-Functional Plat-form in the village is significant and positive in the Agency equation but not significant in the Quality of life equation, which confirms the previous result about the positive effect of MFP on women’s agency. The presence of a private mill in the village is not significant in the Agency equation, neither is it a significant predictor of a woman’s quality of life.
Third, to take into account a potential endogeneity bias due to non-random selection of the villages in the program, we consider MFP as an endogenous variable in the two latent model. We introduce into the MFP equation an exogenous variable which is expected to affect the vil-lage assignation to the program, but to have no effect on women’s agency and well-being. The main criterion for the selection in the MFP program being social cohesion in the village, we consider as a potential instrument a variable which catches a change in the village’s chief in the three years preceding the implementation of the program, i.e., a change that occurred between 2002 and 2004. In Burkina Faso, the village chiefs can be seen as guarantors of social cohesion among villagers. They play a key role in maintaining public order, in conflict resolution, and in promoting economic development (e.g. Bado, 2013). A change in the village head is therefore a potential threat to community cohesion, which may compromise the allocation of a MFP to the village.
10Note that the R2associated to Domestic working time, an indicator of the woman’s quality of life, improves so
Table 4: Measurement equations results for the two latent GSEM
Agency indicators Famlily link Eq.8 No obs Well-being indicators Famlily link Eq.8 No obs
Economic sphere Nutrition
Income generating activity Bernoulli logit 1 2292 Food diversity Ordinal probit 1 2291
Personal savings Bernoulli logit 0.603 2268 Children health and education
(0.000) school enrollment rate Gaussian identity 0.166 1484
Community and political sphere (0.003 )
Vote in the 2010 election Bernoulli logit 0.045 2252 Infant mortality Gaussian identity -0.211 2257
(0.025) (0.000)
Leader of a village group Bernoulli logit 0.117 2205 Height per age Z-score Gaussian identity 0.900 1045
(0.001) (0.000)
Commitment in village groups Poisson log 0.085 2266 Woman’s tiredness
(0.000) Domestic working time Gaussian identity -1.917 2159
Personal sphere (0.000)
Use contraception Bernoulli logit 0.204 2287 Age at 1st child Gaussian identity 1.103 2088
(0.000) (0.001)
Husband’s presence Bernoulli logit -0.249 2257 Children per age Gaussian identity -0.067 2263
(0.000) (0.000)
Leisure time Gaussian identity 0.050 2159 Housing
(0.078) Solid roof Gaussian identity 0.352 2285
(0.000)
Cement floor Gaussian identity 0.977 2286
(0.000)
Hard walls Gaussian identity 0.236 2288
(0.000) Basic amenities
Access to drinking water Bernoulli logit 3.808 2287
(0.000)
Improved sanitation Bernoulli logit 1.408 2289
(0.000) Unstandardized coefficients. Robust p-values are in parenthesis.
Estimation results for the instrumented regression correspond to Eq.7 in Table 1, 2 and 3. The MFP variable, which was not significant, is dropped from the Well-being equation. The number of observations decreases due to missing values in the instrument but the results are roughly unchanged. As expected the instrument variable enters significantly and negatively in the MFP equation indicating that a change in the village’s chief before the implementation of the program, is negatively correlated with the village’s assignment to the program. The imple-mentation of a MFP in the village still has a significant and positive impact on women’s agency, and the unstandardized coefficient of MFP is stable.11
Fourth, we estimate a Generalized Structural Equation Model (GSEM) to take into account the distributional properties of the outcome variables (normal for continuous data, Poisson for count data, Bernoulli (logit) for binary data, ordinal (probit) for ordinal data). The estimations are produced by the ML method via numerical integration.12 Unfortunately, numerical inte-gration requires considerable computational resources, which means that estimation time and model convergence are issues that prevent wider use of this estimation method. Another lim-itation is the lack of fit indices associated with estimations (Kline, 2016). The results for the GSEM correspond to Eq.8 in Table 2 and Table 4. They corroborate the previous ones: the latent Well-being and the dummy MFP are significant and positive predictors of women’s agency.
Distribution of agency and well-being
The predicted values of latent variables (factor scores) are estimated from the three latent model with the larger set of measurement indicators (Eq.5). They are normalized on a 0-1 scale. Figure 2 shows the distribution of the normalized scores for Agency, Quality of life and Living condi-tions. The factor Quality of life is almost symmetrically distributed with a wide peak around the mean and thin tails. By contrast, the distribution of Agency in the sample is asymmetric, posi-tively skewed; indicating frequent small values of the index and few extreme values on the right tail. The distribution of Living conditions is even more positively skewed, more concentrated toward minimum values.
11The unstandardized coefficient of MFP is 0.013 in the non-instrumented model against 0.010 in the
instru-mented model
12The model is estimated using the Generalized Structural Equation Modeling (GSEM) estimation option in
Stata. The numerical integration is carried out with mean–variance adaptive quadrature in combination with Gauss–Hermite integration.
Figure 2: Distribution of normalized factor scores (a) Agency 0 50 100 150 200 Frequency −.1 0 .1 .2
factor score: Agency
(b) Quality of life 0 50 100 150 200 Frequency −.4 −.2 0 .2 .4
factor score: Quality of life
(c) Living conditions 0 50 100 150 200 250 Frequency −.2 −.1 0 .1 .2


![[PDF] Connexion aux bases de données VB](data:image/gif;base64,R0lGODlhAQABAIAAAP///wAAACH5BAEAAAAALAAAAAABAAEAAAICRAEAOw==)