Publisher’s version / Version de l'éditeur:
Vous avez des questions? Nous pouvons vous aider. Pour communiquer directement avec un auteur, consultez la première page de la revue dans laquelle son article a été publié afin de trouver ses coordonnées. Si vous n’arrivez pas à les repérer, communiquez avec nous à [email protected].
Questions? Contact the NRC Publications Archive team at
[email protected]. If you wish to email the authors directly, please see the first page of the publication for their contact information.
https://publications-cnrc.canada.ca/fra/droits
L’accès à ce site Web et l’utilisation de son contenu sont assujettis aux conditions présentées dans le site LISEZ CES CONDITIONS ATTENTIVEMENT AVANT D’UTILISER CE SITE WEB.
Journal of the Acoustical Society of America, 79, 6, pp. 1827-1832, 1986-06
READ THESE TERMS AND CONDITIONS CAREFULLY BEFORE USING THIS WEBSITE. https://nrc-publications.canada.ca/eng/copyright
NRC Publications Archive Record / Notice des Archives des publications du CNRC :
https://nrc-publications.canada.ca/eng/view/object/?id=ea168c9f-a649-42ad-9188-d307a0239c4c https://publications-cnrc.canada.ca/fra/voir/objet/?id=ea168c9f-a649-42ad-9188-d307a0239c4c
NRC Publications Archive
Archives des publications du CNRC
This publication could be one of several versions: author’s original, accepted manuscript or the publisher’s version. / La version de cette publication peut être l’une des suivantes : la version prépublication de l’auteur, la version acceptée du manuscrit ou la version de l’éditeur.
Access and use of this website and the material on it are subject to the Terms and Conditions set forth at
Acoustical comparison of three theaters
Bradley, J. S.
Ser I
TH1
N21d
--.
Ad,.
c . 2
National Research
Conseil national
BLDG
r(*
Council Canada
de recherche$ Canada
--Institute for
lnstitut de
Research in
recherche en
Construction
construction
Acoustical Comparison
of Three
c heat em
by J.S. Bradley
ANALYZED
Reprinted from
Journal of the Acoustical Society of America
Vol. 79, No. 6, June 1986
p. 1827
-
1832
(IRC Paper No. 1394)
Price $2.00
NRCC 261 74
Trois salles de spectacle comprenant une avant-scene et une
arche sont Svaluges
3 l'aide de mesures acoustiques encore peu
utilisges. Les caractgristiques de chaque salle sont examindes
et incluent une fosse d'orchestre partiellement recouverte et
un &ran
rgverbdrateur.
Un modele informatique permet de
dgterminer les effets nuisibles d'un
trop grand nombre
Acoustical comparison or three tneaters
.
S .Bradley
Tational Research Council of Canada, Division of Building Research, Ottawa, Canada KIA OR
(Received 1 April 1985; accepted for publication 2 1 February 1986)
Three theaters, including both thrust stage and proscenium arch designs, are evaluated using acoustical measures not yet in common use. The unique characteristics of each theater are considered and include a partially covered orchestra pit and a music shell. A computer model is used to estimate the detrimental effects of excessive ceiling lighting holes.
'ACS numbers: 43.55.Gx, 43.55.H~
NTRODUCTION
Although the sclerlce or auuiwrium acvustics has made definite progress over the past 20 years, little of this new knowledge is yet used quantitatively by acoustical consul- tants. Much work is required before the new results can be ipplied in practical situations. This paper reports evalua- ions of three theaters using acoustical measures and tech- liques not yet in common use. It is hoped that such studies vill provide the practical information required to advance he application of current knowledge to the design aild as- ,essment of theaters.
.
ACOUSTICAL MEASURESOver the past 80 years the acoustical design of auditoria
-
nas been based almost entirely on an optimum reverberation time RT. Only recently has the inadequacy of RT as a single design parameter become apparent. The work of Haas1 first established the importance of strong early reflections for peech intelligibility When he showed that most early reflec- ions are not perceived separately but as an enhancement of he direct sound. Subsequent work by Lochner and Burger2 howed that, in the absence ofinterfering noise, speech intel- ~gibility is related to the ratio of the sum of the energy in the arly reflections to the unwanted late-arriving sound energy. leveral such early-to-late-arriving sound energy ratios have leen proposed, but they are found to be very highly intercor- elated.3 C8, , the ratio of the early sound energy arriving in the first 0.08 s after the direct sound to the later-arriving I sound energy, has been found to be a good correlate of sub- jectively assessed clarity and definition for music.495 New I research suggests that the 0.08-s early sound interval is alsosuitable for speech intelligibility s t ~ d i e s . ~
Pioneering work by Schroeder' first demonstrated that the subjectively perceived decay time is better related to the initial part of the decay rather than to the conventional esti- mates of reverberation time obtained from the entire decay curve. Accordingly, EDT (early decay time), the RT calcu- lated from the mean decay rate during the first 10 dB of the decay, has been used to better predict the degree of perceived reverberance in a room. Like C8, and subjective impres- sions, EDT varies from seat to seat in an auditorium.
tional reverberation time, and background sound levels. Each quantity was obtained in octave bands for a number of combinations of source and receiver position in each theater. All measures were obtained from digitally recorded pistol shots8 and subsequent computer processing. The gun radiat- ed substantial sound levels in an omnidirectional manner in the octave bands from 125 to 8000 Hz. The computer pro- gram digitally filtered the pulses into octave bands, and from simple energy summations the early-to-late-arriving sound energy ratios were calculated. The Schroeder integrated-im- pulse technique was used to calculate EDT and R T values by least-squares fits to the resulting decay curves. Speech intel- ligibility tests were also performed in each theater using a Fairbanks rhyme test and tape recorded speech.
II. THE THREE THEATERS
The three theaters investigated were the National Arts Centre (NAC) Theater in Ottawa, and the Festival and Avon Theaters in Stratford, Ontario, Canada. The Festival Theater is the largest, with a volume of 9400 m3 and seating for 2262 people. It has a thrust stage, audience seating form- ing a 220" angle round it. The Avon Theater is an older theater of conventional proscenium arch design having a volume of 4600 m3, excluding ihe stage house, and seating for 1107 people. In the NAC Theater a thrust stage can be added in front of the conventional proscenium arch stage, reducing the number of seats from the maximum of 967. The NAC Theater has a volume of about 7000 m3, excluding the stage house. All three theaters have a single balcony. The Avon Theater also has a partially covered orchestra pit, and the NAC Theater a movable stage shell that can be added for performances involving small musical groups. Cross sec- tions of the three theaters are shown in Figs. 1-3. The NAC Theater was built in 1967 with N. Papas and Associates as acoustical consultants. The Festival Theater was built in 1957; R. H. Tanner, the acoustical consultant, reported his design considerations in this j ~ u r n a l . ~ The Avon Theater was built in about 1900 and has been modified a number of times since then.
Ill. BASIC ACOUSTICAL COMPARISONS
The principal measured quantities reported in this pa- In spite of the importance of the newer acoustical mea- per are C8, , the 0.08-s early-to-late-arriving sound ratio (or sures, very low background noise levels are still probably the Klarheitsmass) , EDT, the early decay time, RT, the conven- most important factor in achieving high acoustical quality 1827 J. Acoust. Soc. Am. 79 (6), June 1986 0001 -4966/86/061827-06$00.80 @ 1986 Acoustical Society of America 1827
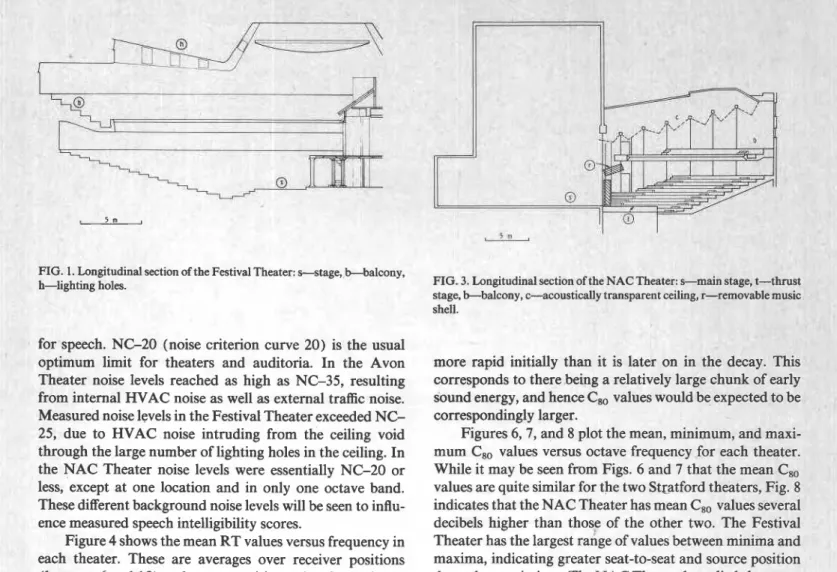
FIG. 1. Longitudinal section of the Festival Theater: s-stage, b-balcony, h-lighting holes.
for speech. N G 2 0 (noise criterion curve 20) is the usual optimum limit for theaters and auditoria. In the Avon Theater noise levels reached as high as NC-35, resulting from internal HVAC noise as well as external traffic noise. Measured noise levels in the Festival Theater exceeded NC- 25, due to HVAC noise intruding from the ceiling void through the large number of lighting holes in the ceiling. In the NAC Theater noise levels were essentially NC-20 or less, except at one location and in only one octave band. These different background noise levels will be seen to influ- ence measured speech intelligibility scores.
Figure 4 shows the mean RT values versus frequency in each theater. These are averages over receiver positions (between 6 and 15 ) and source positions ( 1 to 3 )
.
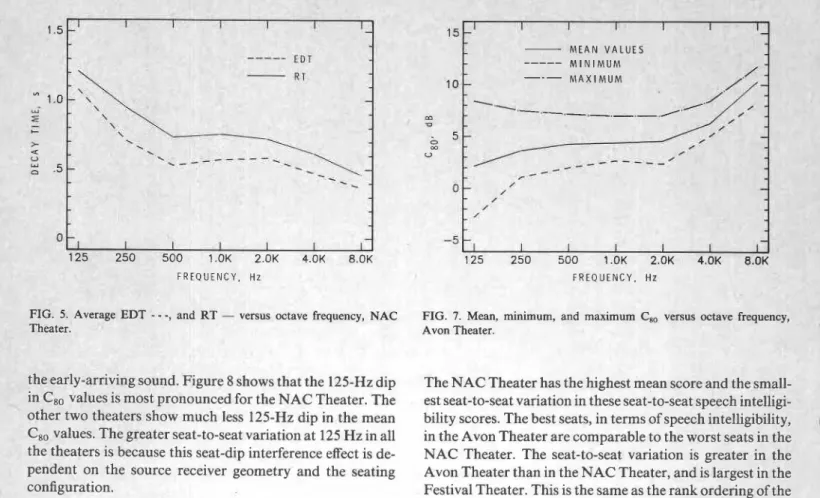
At inter- mediate frequencies the Festival Theater is slightly more re- verberant than the Avon Theater, but both Stratford the- aters are a little more reverberant than the NAC Theater. Measurements in the Festival and Avon Theaters indicate that the overall average EDT values are only slightly shorter than the RT values. Figure 5 shows that in the NAC Theater the overall average EDT values are distinctly less than the corresponding RT values. This theater would be perceived to be less acoustically live, or less reverberant, than the mea- sured RT values indicate. Of course, for the EDT values to be shorter than the RT values the decay of sound must beFIG. 2. Longitudinal section of the Avon Theater: s-stage, b-balcony, p-orchestra pit.
1828 J. Acoust. Soc. Am., VOI. 79, NO. 6, June 1986
FIG. 3. Longitudinal section of the NAC Theater: s-main stage, t-thrust stage, b-balcony, c-acoustically transparent ceiling, r-removable music shell.
more rapid initially than it is later oi decay. TI
corresponds to there being a relatively large chunk of e a sound energy, and hence C,, values would be expected to correspondingly larger.
Figures 6,7, and 8 plot the mean, minimum, and maxi- mum C,, values versus octave frequency for each theater. While it may be seen from Figs. 6 and 7 that the mean C,, values are quite similar for the two Stratford theaters, Fig. 8 indicates that the NAC Theater has mean C,, values several decibels higher than those of the other two. The Festival Theater has the largest range of values between minima and maxima, indicating greater seat-to-seat and source position dependent variations. The NAC Theater has a little less seat- to-seat variation in acoustical quality than the Avon Theater, although the two are of similar size and seating. The differences in the curves of Figs. 6-8 at 125 Hz can be attri- buted to variations in the seat-dip effect. It is known that sound passing over audience seating at near-grazing inci- dence is selectively attenuated at lower frequencies. '0,'' This
can show up as a dip in the frequency response of the early- to-late-arriving sound ratios due to the excess attenuation of
n in the ( iis
I I I I I I
----
A V O N THEATER k .-
F E S T I V A L T H E A T E R 4F R E Q U E N C Y . H z
FIG. 4. Average reverberation time versus octave frequency for the three theaters.
I I I I M E A N V A L U E S
--- M I N I M U M 10 M A X I M U M
F R E Q U E N C Y . H z F R E Q U E N C Y . H z
FIG. 5. Average EDT
- -
-, and RT - versus octave frequency, NAC FIG. 7. Mean, minimum, and maximum C,, versus octave frequency,Theater. Avon Theater.
the early-arriving sound. Figure 8 shows that the 125-Hz dip in C,, values is most pronounced for the NAC Theater. The other two theaters show much less 125-Hz dip in the mean C,, values. The greater seat-to-seat variation at 125 Hz in all the theaters is because this seat-dip interference effect is de- pendent on the source receiver geometry and the seating configuration.
These results represent conditions in the unoccupied theaters. A procedure to estimate C,, values for occupied conditions is available12 based on the expected change in RT values. As the NAC Theater chairs appeared to be more
a absorptive than those of the other two theaters, the expected
occupied RT values can only be approximately estimated. I Although the new acoustical measures reveal much
I concerning the physics of the sound in the theaters, it is de-
I sirable to be able to relate these measures to speech intelligi-
I bility test scores obtained in each theater. Figure 9 gives the mean and range-of-speech intelligibility scores in each of the
I three theaters with a common source level of 50 dB A at 1 m.
F R E Q U E N C Y . H z
The NAC Theater has the highest mean score and the smal est seat-to-seat variation in these seat-to-seat speech intellig bility scores. The best seats, in terms of speech intelligibilit in the Avon Theater are comparable to the worst seats in tl-, NAC Theater. The seat-to-seat variation is greater in the Avon Theater than in the NAC Theater, and is largest in the Festival Theater. This is the same as the rank ordering of the seat-to-seat variation in the C,, values.
The speech intelligibility test results seem to be ex- plained by the differences in background noise levels, C,, values, and the basic size and configurations of the theaters. Thus the lower scores and greater variations in the Festival Theater are caused by greater than optimum noise levels and the lower and more varied C,, values, which in turn are a result of the larger size of this theater and of the geometry of the thrust stage configuration. Because of its 2/3 circular plan and thrust stage design, there is a lack of strong early reflections and the direct sound is the major component of the early sound. Of course, the strength of the direct sound is strongly influenced by the distance and direction from the person speaking.
The Avon Theater had the lowest mean scores, probably due largely to excessive background noise but also to lower
I I I I I I I
-
MEANVALUES ----
MINIMUMQ t l
,
,
I I I I I 125 I 2% 500 l.0K 2.0K 4.OK 8.OK F R E Q U E N C Y . H zFIG. 6. Mean, minimum, and maximum C,, versus octave frequency, Fes- FIG. 8. Mean, minimum, andmaximum C,, versus octave frequency, NAC
tival Theater. Theater.
n 1 -
,
,
0 - m U lo - - /' STAGE SHELL - WlTH- -- WITH, OUT STAGE SHE1
5 L
-
125 . . . .. 2.OK 4.OK
F R E Q U E N C Y . H z
FIG. 1 1 . C,, versus octave frequency on-stage m NAC heater: - - -
shell, - with shell.
N A C F E S T I V A L . A V O N T H E A T E R
The major purpose of a s
on-stage acoustical environment for musicians. Strong early reflections from the stage are necessary to enable the musi- cians to hear each other and to play together well. Individual pulse responses on stage showed that the shell created a number of new reflections that arrived up to about 0.025 s later than the direct sound. It is also desirable that a shell increase the sense, on stage, that the room is responding. Figure 11 shows that on-stage Cgo values decreased when the shell was added. One expects an added reflecting surface such as the music shell to add early reflections, but thev continue to bounce around the room and become late reflt tions. Thus the addition of the shell does not simply increa
Cso values because of increased early reflections. Both eal and late reflections are increased, and in this particular ca the balance changed so that CEO values decreased.
A similar effect was observed for EDT values, which 1000 Hz increased from 0.05 to 0.15 s on stage when the shell was added. These values are extremely small, but they give some quantitative indication of the function of the shell. The shell cannot create, on stage close to the source, the acousti- cal conditions that would be experienced by the audience in a live hall, but it can create an increased sense that the hall responds when the musicians play.
tage shell ride a bet1
FIG. 9. Mean, minimum, and maximum speech intelligibility scores in each theater.
Cg0 values and its long rectangular shape, which places some
of the audience further from the stage where they experience weaker speech levels.
IV. INDIVIDUAL CHARACTERISTICS
A. NAC Theater
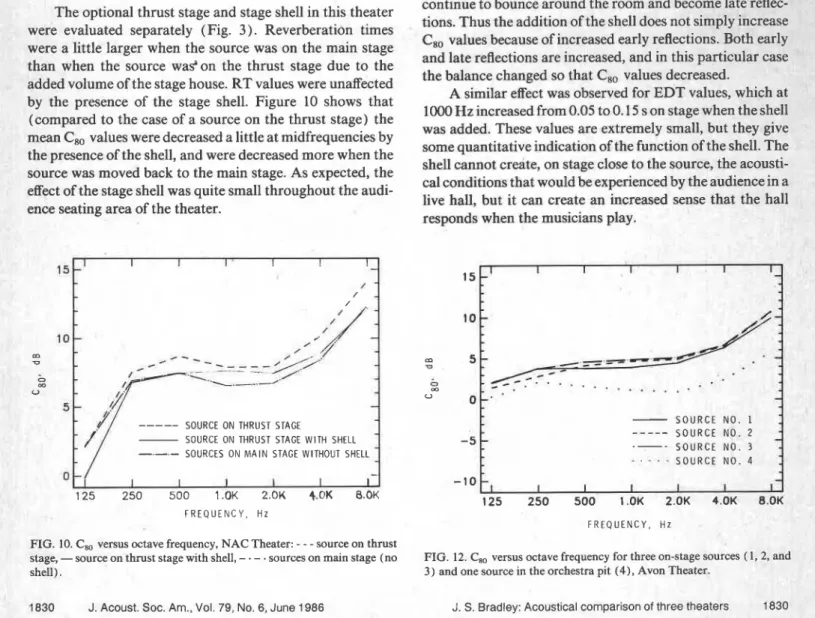
The optional thrust stage and stage shell in this theater were evaluated separately (Fig. 3 ) . Reverberation times were a little larger when the source was on the main stage than when the source wagon the thrust stage due to the added volume of the stage house. RT values were unaffected by the presence of the stage shell. Figure 10 shows that (compared to the case of a source on the thrust stage) the mean Cso values were decreased a little at midfrequencies by the presence of the shell, and were decreased more when the source was moved back to the main stage. As expected, the effect of the stage shell was quite small throughout the audi- ence seating area of the theater.
-
-
@-
--
-- A \ . -. -. -.-
ON THRUST STAGESOURCE ON THRUST STAGE WITH SHELL
-.-.-
SOURCES ON M A I N STAGE WITHOUT SHELL-
I 1 I 1 1 I 1 .
125 250 500 1 .OK 2.OK +.OK 8.OK
-
S O U R C E N O . 1 - - - S O U R C E N O . 2 S O U R C E N O . 3 . . . S O U R C E N O . 4 F R E Q U E N C Y . H z F R E Q U E N C Y , H ZFIG. 10. C,, versus octave frequency, NAC Theater: - - - source on thrust
stage, - source on thrust stage with shell, -
.
-.
sources on main stage (no shell).FIG. 12. C,, versus octave frequency for three on-stage sources ( 1 , 2 , , 3 ) and one source in the orchestra pit (4), Avon Theater.
and
J. S. Bradley: Acoustical comparison of three theaters 1 e 1830 J. Acoust. Soc. Am., Vol. 79, No. 6, June 1986
B. Avon Theater
The Avon Theater was unique among the three theaters in having an orchestra pit. The stage floor had been extended over the pit so that approximately half of it was covered. This arrangement is most undesirable acoustically because the radiation of sound from the pit is severely impeded and it is very difficult to obtain a balance throughout the theater between on-stage sources, such as singers, and the musicians in the pit, as well as making it more difficult for singers to properly hear the orchestra. Of course the control of the overall balance between singer and orchestra is the conduc- tor's prerogative, but if one component of this balance, the orchestral sound, varies throughout the theater it is impossi- ble to obtain the desired balance at all seats. In addition, partially enclosing the pit tends to increase sound levels there, so that it is excessively loud for the musicians. Conse- quently, they tend to play a little less loudly, and as sound- absorbing material is often added in partially covered pits, the result is that the orchestral sound becomes even weaker throughout the theater.
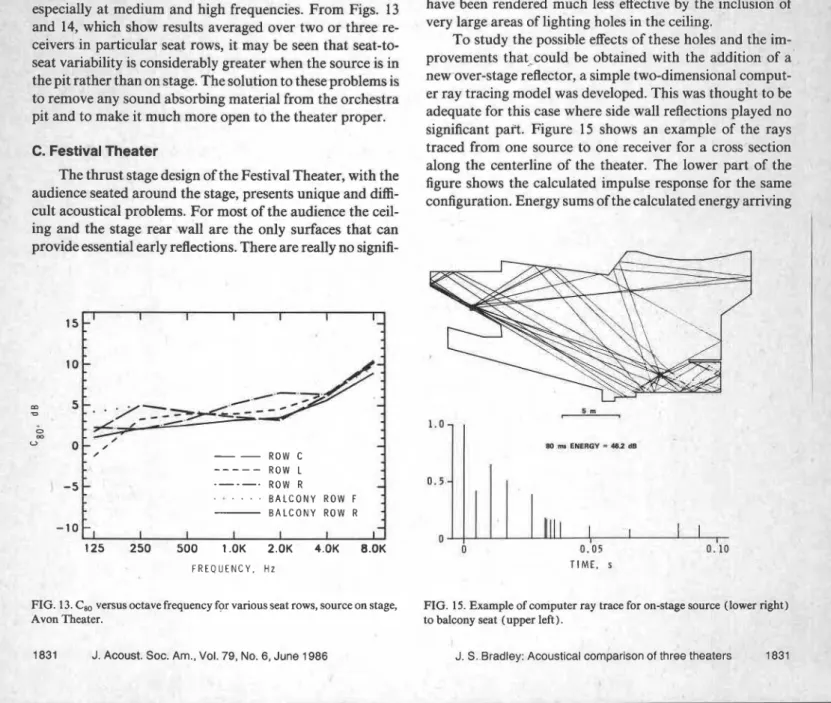
Figure 12 shows measured C,, values averaged over all audience seats for three on-stage source positions as well as one in the orchestra pit. When the source is in the orchestra pit, C,, values throughout the theater are distinctly lower, especially at medium and high frequencies. From Figs. 13 and 14, which show results averaged over two or three re- ceivers in particular seat rows, it may be seen that seat-to- seat variability is considerably greater when the source is in the pit rather than on stage. The solution to these problems is to remove any sound absorbing material from the orchestra pit and to make it much more open to the theater proper. C. Festival Theater
The thrust stage design of the Festival Theater, with the audience seated around the stage, presents unique and diffi- cult acoustical problems. For most of the audience the ceil- ing and the stage rear wall are the only surfaces that can provide essential early reflections. There are really no signifi-
- - -
R O W LR O W R
. . . B A L C O N Y R O W F
B A L C O N Y R O W R
F R E Q U E N C Y , H z
FIG. 13. C,, versus octave frequency for various seat rows, source on stage, Avon Theater.
1831 J. Acoust. Soc. Am., Vol. 79, No. 6, June 1986
I 1 I I I R O W C
- - -
R O W L R O W R . . . B A L C O N Y B A L C O N l R O W I R O W R F R E Q U E N C Y , H zFIG. 14. C,, versus octave frequency for various seat rows, source in or- chestra pit, Avon Theater.
cant side wall reflections in this theater, where the floor plan is approximately
4
of a circle and the stage is at the center of the circle. The important early reflections from the ceiling have been rendered much less effective by the inclusion of very large areas of lighting holes in the ceiling.To study the possible effects of these holes and the im- provements that-could be obtained with the addition of a new.over-stage reflector, a simple two-dimensional comput- er ray tracing model was developed. This was thought to be adequate for this case where side wall reflections played no significant paft. Figure 15 shows an example of the rays traced from one source to one receiver for a cross section along the centerline of the theater. The lower part of tl figure shows the calculated impulse response for the san configuration. Energy sums of the calculated energy arrivir
T I M E , s
FIG. 15. Example of computer ray trace for on-stage source (lower righ to balcony seat (upper left).
-
,
,
, - I I . , . V. CONCLUSION0
EXISTING
- - - NO LIGHT HOLES - The theaters studied represent a wide range of designs,
REFLECTOR
-
as well as being three of Canada's most successful. The com-parisons demonstrate the value of the newer acoustical mea- sures for examining particular problems associated with each of the three theaters. The accumulated experience of many more such studies is now needed for interpreting, us-
< MAIN FLOOR SEATS
,
BALCONY . ing, and refining these measures in designing new theatersE 1
and assessing existing ones. The simple computer models I
~ O ~ . I , ~ , ~ , I , ( . I . I . I . I . ~ .
-B D F H K M O P A C E used here once more affirm the need to develop sophisticated
S E A T R O W computer models for the precise and efficient design of the-
aters and auditoria.
FIG. 16. Calculated relative early energy level versus seat row through the
I
:enter section of the theater. ACKNOWLEDGMENTS
This paper is a contribution from the Division of Build ing Research, National Research Council of Canada, and i n the first 0.08 s were calculated for many combinations of with the approval of the Director of the Division. ource and receiver and various configurations of the
heater. Figure 16 gives an example of the results, showing now the relative early energy sums could be increased by
closing the lighting holes and adding a new over-stage reflec- 'H. Haas, "The influence of a single echo on the audibility of speech
tor. ~h~ integration of these features into the theater would (translation of the original German), J. Audio Eng. Soc. 20(2), 146-15
(1949).
require further practical considerations that be in- 'J. P. A, Lochner and J. F. Burger, "The influence of reflections on audit01 fluenced by the relative priorities of good acoustics versus ium acoustics," J. Sound Vib. 1 ( 4 ) , 426-454 (1964).
good lighting. 3J. S. Bradley, "New acoustical measures in a variable acoustics hall," i
Proceedings of the Ilth'ZCA, Paris, Vol. 7, 113-116 (1983).
To assess the quality Of a thrust stage theater 4 ~Reichardt and U, Lehman, "Optimierung . raumeindruck una
in more detail, the test methods require some further refine- durchsichtigkeit von musikdarbietungen durch auswertung von impulss-
ment. The early-to-late sound ratios obtained using an omni- challtests," Acustica 48, 174-1 85 ( 1981).
directional source can be considered to represent an average 'D. Gottlob, "Comparison of objective Acoustic parameters in concert
halls with results of subjective experiments" (translation of thesis origin-
of possible directions Of the 'peaking' ally in German, 1973), British Building Research Establishment, library
particular worst cases, it is necessary to use a source with translation 1895.
directional characteristics similar to those of a human 'J. S. Bradley, "Predictors of speech intelligibility in rooms," J. Acoust.
speaker. Early-to-late-arriving sound ratios were obtained Am. SUppl. 719
'B. S. Atal, M. R. Schroeder, and G. M. Sessler, "Subjective reverberation
using a loudspeaker 'Ource that approximated human time and its relation to sound decay," in Proceedings ofthe 5th ZCA, Liege,
tional characteristics, but this was not entirely successful Paper G32 (1965).
because of the difficulty of producing high-amplitude pulses 'J. S. Bradley, "Acoustical characteristics of guns as impulse sources," Can. Acoust. 13(2), 1 6 2 4 (1985).
to provide the necessary signal-to-noise ratios for
' 3 ~ . H. T ~" ~ A~design and perfomance ~~ ~ ~, of the Stratford (On- ~ ~ ~ ~ ~ ~ ~
earl~-to-late ratios and times, Larger tario) Festival Theater," J. Acoust. Sot. Am. 32,232-234 ( 1960).
could radiate more power, but would not have the desired '9. J. schultz and B. G. Watters, "Propagation of sound across audience
directional characteristics. A better approach would be to seating," J. Acoust. Sot. Am. 36,885-896 (1964).
use cross-correlation techniques and pseudorandom noise to llG. M. Sessler and J. E. West, "Sound transmission over theater seats," J. Acoust. Soc. Am. 36, 1725-1732 (1964). produce the required pulse responses. This method will be 12J. S. Bradley, "Experience with new auditorium acoustic measurements,"
attempted in future studies. J. Acoust. Soc. Am. 73,2051-2058 (1983).
T h i s p a p e r i s b e i n g d i s t r i b u t e d i n r e p r i n t form by t h e I n s t i t u t e f o r R e s e a r c h i n C o n s t r u c t i o n . A l i s t of b u i l d i n g p r a c t i c e and r e s e a r c h p u b l i c a t i o n s a v a i l a b l e from t h e I n s t i t u t e may be o b t a i n e d by w r i t i n g t o t h e P u b l i c a t i o n s S e c t i o n , I n s t i t u t e f o r R e s e a r c h i n C o n s t r u c t i o n , N a t i o n a l Research C o u n c i l o f C a n a d a , O t t a w a , O n t a r i o ,