HAL Id: hal-02916912
https://hal.inrae.fr/hal-02916912
Submitted on 18 Aug 2020
HAL is a multi-disciplinary open access
archive for the deposit and dissemination of sci-entific research documents, whether they are pub-lished or not. The documents may come from teaching and research institutions in France or abroad, or from public or private research centers.
L’archive ouverte pluridisciplinaire HAL, est destinée au dépôt et à la diffusion de documents scientifiques de niveau recherche, publiés ou non, émanant des établissements d’enseignement et de recherche français ou étrangers, des laboratoires publics ou privés.
obtained via expression of two florigen genes
Sara Castelletti, Aude Coupel-Ledru, Italo Granato, Carine Palaffre, Llorenç
Cabrera-Bosquet, Chiara Tonelli, Stephane Nicolas, Francois Tardieu, Claude
Welcker, Lucio Conti
To cite this version:
Sara Castelletti, Aude Coupel-Ledru, Italo Granato, Carine Palaffre, Llorenç Cabrera-Bosquet, et al.. Maize adaptation across temperate climates was obtained via expression of two florigen genes. PLoS Genetics, Public Library of Science, 2020, 16 (7), pp.e1008882. �10.1371/journal.pgen.1008882�. �hal-02916912�
RESEARCH ARTICLE
Maize adaptation across temperate climates
was obtained via expression of two florigen
genes
Sara Castelletti1☯¤a, Aude Coupel-LedruID2☯¤b, Italo GranatoID2, Carine PalaffreID3, Llorenc¸ Cabrera-BosquetID2, Chiara Tonelli1, Ste´phane D. NicolasID4, Franc¸ois TardieuID2, Claude WelckerID2, Lucio ContiID1*
1 Department of Biosciences, University of Milan, Milan, Italy, 2 LEPSE, INRAe, Univ. Montpellier, SupAgro,
Montpellier, France, 3 Unite´ Expe´rimentale du Maïs, INRAe, Univ. Bordeaux, Saint Martin de Hinx, France,
4 GQE—Le Moulon, INRAe, Universite´ Paris-Saclay, CNRS, AgroParisTech, Gif-sur-Yvette, France
☯These authors contributed equally to this work.
¤a Current address: Transactiva Srl, Parco Scientifico e Tecnologico "L. Danieli", Udine Italy
¤b Current address: University of Bristol, School of Biological Sciences, Bristol, United Kingdom
*Lucio.Conti@unimi.it
Abstract
Expansion of the maize growing area was central for food security in temperate regions. In addition to the suppression of the short-day requirement for floral induction, it required breeding for a large range of flowering time that compensates the effect of South-North gra-dients of temperatures. Here we show the role of a novel florigen gene, ZCN12, in the latter adaptation in cooperation with ZCN8. Strong eQTLs of ZCN8 and ZCN12, measured in 327 maize lines, accounted for most of the genetic variance of flowering time in platform and field experiments. ZCN12 had a strong effect on flowering time of transgenic Arabidopsis
thaliana plants; a path analysis showed that it directly affected maize flowering time together
with ZCN8. The allelic composition at ZCN QTLs showed clear signs of selection by breed-ers. This suggests that florigens played a central role in ensuring a large range of flowering time, necessary for adaptation to temperate areas.
Author summary
The cultivation of maize in temperate climates required the suppression of photoperiod sensitivity and the selection of a wide range of flowering time for the adaptation to local environmental constraints. Photoperiodic flowering requires the production of a systemic protein signal referred to as the florigen, which is transcriptionally activated in leaves. A key question is to what extent the expression of the florigen gene can explain flowering time variability of temperate maize, where photoperiod sensitivity has been eliminated by artificial selection. Our results reveal large variability in two related florigen genes which is strongly correlated with variability in flowering time. Using association genetics approaches we could detect genomic regions responsible for the expression of the two flo-rigens that precisely co-localise with flowering time-related regions, thereby supporting
PLOS
GENETICS
a1111111111 a1111111111 a1111111111 a1111111111 a1111111111 OPEN ACCESSCitation: Castelletti S, Coupel-Ledru A, Granato I,
Palaffre C, Cabrera-Bosquet L, Tonelli C, et al. (2020) Maize adaptation across temperate climates was obtained via expression of two florigen genes. PLoS Genet 16(7): e1008882.https://doi.org/ 10.1371/journal.pgen.1008882
Editor: Juliette de Meaux, University of Cologne,
GERMANY
Received: September 6, 2019 Accepted: May 22, 2020 Published: July 16, 2020
Peer Review History: PLOS recognizes the
benefits of transparency in the peer review process; therefore, we enable the publication of all of the content of peer review and author responses alongside final, published articles. The editorial history of this article is available here:
https://doi.org/10.1371/journal.pgen.1008882
Copyright:© 2020 Castelletti et al. This is an open access article distributed under the terms of the
Creative Commons Attribution License, which permits unrestricted use, distribution, and reproduction in any medium, provided the original author and source are credited.
Data Availability Statement: Genotyping data of
the panel used in this study are publicly available at this site:https://data.inra.fr/dataset.xhtml? persistentId=doi:10.15454/GAHEU0. Raw data and
the significance of quantitative changes in florigen levels in driving flowering time vari-ability. Markers associated with florigen expression/flowering time display significant sig-natures of selection indicating that variable patterns of florigen accumulation underpin the adaptation of temperate maize flowering.
Introduction
Maize was domesticated 9000 years ago in central Mexico from teosinte (Zea mays subsp. par-viglumis), a tropical plant that only flowers under short days [1]. In contrast to its wild ances-tor, modern maize shows a large geographic distribution from 0 to 50˚ N. Adaptation to temperate latitudes, with long days during summer, required breeders to first suppress the short-day requirement for floral induction, but a second adaptation was also required. Because the time to flowering strongly depends on temperature, it is shorter for a given non-photoperi-odic genotype at lower than at higher latitudes of the temperate area. A long intrinsic cycle duration is necessary to counteract this effect in warmest areas, thereby avoiding decreases in cumulated photosynthesis and biomass. Conversely, a short intrinsic duration is needed in the coolest areas to avoid grain filling to occur in Autumn with low light and temperature [2]. Accordingly, the range of time to flowering in current germplasm typically ranges from 35 to 90 days after sowing in a given site [3].
About ninety quantitative trait loci (QTLs) in the maize genome account for the natural diversity in flowering time [4–8] and most of them explain a small proportion of the pheno-typic variance, with prevalently additive effects [4]. The molecular characterization of a few large-effect alleles helped uncover key events underpinning the flowering adaptation of maize from tropical to temperate climates [9]. These alleles were found to regulate the expression of florigens, i.e. floral genes expressed in the leaf vasculature. Florigen proteins are members of the Phosphatidyl Ethanolamine Binding Proteins (PEBPs) family that include FLOWERING LOCUS T inArabidopsis and Heading date 3a in rice that move systemically to promote flow-ering at the shoot apex [10]. The maize genome encodes several florigen genes, includingZEA CENTRORADIALIS 8 (ZCN8) that acts as major florigen [9,11–13]. Its expression only occurs under short-day conditions in tropically adapted maize, but not in long days [13]. The uncou-pling ofZCN8 expression from short day-dependent activation occurred in a stepwise manner through the selection of mutations in theZCN8 expression regulatory processes. For example, independent transposon insertions at two relatedZmCCT genes (9 and 10) reduce maize flow-ering photoperiod sensitivity [14,15]. The active (expressed) alleles ofZmCCT9 and 10 of trop-ical maize delay flowering under long days by repressingZCN8 [13,16]. The gradual
northbound expansion of maize was also driven by variations at cis-regulatory sequences of theZCN8 promoter [9], which modify the binding landscape for different transcription factors [17]. AnotherZCN8 regulatory node involves ZmMADS69, which in turn represses the ZCN8 negative regulatorRelated to apetala2.7 (Rap2.7) [18]. BothZmMADS69 and Rap2.7 map within well-characterized QTLs of flowering time suggesting that allelic variations at these genes control part of the diversity of flowering time of temperate maize [19–22]. Classic muta-genesis screens also identified major genes that affect flowering time, thereby helping to refine theZCN8 regulatory pathway with additional components. These include Indeterminate1 (Id1) and delayed flowering 1 (dlf1) that encode, respectively, an upstream regulator required forZCN8 expression [23,24] and a bZIP transcription factor presumably required for ZCN8 protein signalling at the shoot apex [13,25].
BLUES of gene expression and phenotypes as well as the description of the lines used are publicly available at this site:https://data.inra.fr/dataset. xhtml?persistentId=doi:10.15454/XTHN7I
Additional relevant data are within the manuscript and its Supporting Information files.
Funding: This study was funded through
FLORIMAIZE “Role of florigen proteins in maize developmental reprogramming under drought stress” Project (FC ID 2013-1889; AF ID 1301-006) jointly supported by Agropolis Fondation (through the “Investissements d’avenir” programme with reference number ANR-10-LABX-0001-01”) and Fondazione Cariplo (for SC, ACL, IG, CP, LCB, CT, FT, CW, LC).http://www.fondazionecariplo.it/it/ progetti/ricerca/bando-congiunto-fondazione-cariplo-agropolis-fondation-ceres.html. Genotyping data used for the project were assembled within Amaizing project (French National Agency ANR-10-BTBR-01) (for LCB, IG, SN, FT, CW).https://anr.fr/ ProjetIA-10-BTBR-0001. Support for the phenotyping platform derived from the Projects PHENOME Emphasis (ANR-11-INBS-0012) (for LCB, FT, CW). https://anr.fr/ProjetIA-11-INBS-0012. The funders had no role in study design, data collection and analysis, decision to publish, or preparation of the manuscript.
Competing interests: The authors have declared
Although the above studies reveal a prominent role forZCN8 activation in the control of flowering time in short vs long days, its contribution to the genetic variability of flowering time in non-photoperiodic temperate maize varieties is less clear. Indeed, it has been argued that the variability in flowering time in temperate maize is controlled by other pathways that act in parallel to or downstream ofZCN8 transcriptional activation [26]. Two elements chal-lenge this view: (i) the downregulation ofZCN8 in temperate maize leads to a significant delay in flowering time (albeit less prominent compared toid1 or dlf1 mutants) [13,16,18], (ii) QTL mapping shows that flowering time is linked to allelic variations at a genomic region that har-boursZCN8 (also known as the Vgt2 QTL) [6,19,27,28].
A genome-wide study of temperate maize germplasm was necessary to reconcile these views on the potential role of florigen expression in the control of flowering time of temperate maize. Here we address this question by jointly measuring flowering time and the expression ofZCN8, and of two related genes with unknown variability, ZCN7 and ZCN12 [12], in a panel of 327 maize temperate lines. Our study revealed large variations inZCN8 and ZCN12 tran-script levels, which closely correlate to flowering time. Regulatory regions forZCN8 and ZCN12 coincided with flowering time QTLs and we detected signatures of selection for some of these regions. Collectively, these results suggest that the adaptation of maize within temper-ate regions derives from the control of florigen pathways.
Results
ZCN8 levels highly correlate with flowering time in temperate maize
We first measured the time from germination to pollen shedding on florets (anthesis), to the emergence of silks from the ear (silking) and also the final leaf number which reflects the dura-tion from germinadura-tion to floral transidura-tion, in four experiments in a phenotyping platform and in the field. Large variability was observed in two platform experiments for anthesis (BLUES ranging from 56 to 99 d20˚C), silking (from 57 to 101 d20˚C) and leaf number (from 13 to 25)(S1A and S1B Fig), resulting in narrow-sense heritability up to 0.80 (S1 Table). Field experi-ments provided similar results to those obtained in the platform (Fig 1A,S1C Fig,S1 Table).
Fig 1.ZCN8 contributes to flowering time variability in temperate maize lines. (A) Relationship between genotypic values for anthesis in field (2015–2016) and
platform (2014) experiments. (B) Anthesis time plotted againstZCN8 expression after the floral transition (platform experiment in 2014). (C) Relationship between
anthesis measured in the field (2015–2016) andZCN8 expression in the platform experiment (2014). In (A), (B) and (C) n = 313 lines. Genotypic values are BLUEs.
Anthesis time expressed in equivalent days at 20˚C after germination. The red triangle represents genotypic values for the reference line B73. Correlation coefficients are displayed together with their significance (���p < 10−4).
https://doi.org/10.1371/journal.pgen.1008882.g001
We then measured florigen expression of the same lines, in samples collected from fully expanded leaves of plants grown in the phenotyping platform. Samples were collected in the early morning at two dates, when leaves 4 and 7 reached ligulation, representingbona fide pre and post floral transition [13]. Care was taken to precisely record the harvest time of each indi-vidual sample and to record the developmental stage of every sampled plant, which slightly dif-fered between plants because of the genetic variability of the phyllochron [29]. Mixed models including a fixed effect of sampling date and time of day (both of them small,S2A–S2D Fig), together with spatial effects in the greenhouse, were used to extract genotypic values for each line (S3C and S3D Fig).
TheZCN8 expression displayed large genetic variability. The four biological replicates, ana-lysed at two sampling dates, provided highly correlated expression levels (up to r = 0.88) when values were normalised by those of the housekeeping genesUBIQUITIN-CONJUGATING ENZYME E2 (UCe) and ELONGATION FACTOR 1 ALPHA (EF1a) (S3A and S3B Fig).ZCN8 accumulation significantly increased between the two sampling dates (S4B Fig), consistent with previous studies [13], with higher heritability in the second than in the first date (h2= 0.64 and 0.58, respectively). Still, we could detect a significant correlation inZCN8 accumula-tion between the two sampling dates (r = 0.53,S4A Fig). We thus focused onZCN8 expression detected at the second sampling date (leaf 7 stage).
Anthesis time was significantly correlated with the BLUEs ofZCN8 (r = -0.6,Fig 1B) and so was the total leaf number (r = -0.65,S5A Fig). The ranking of genotypes forZCN8 was con-firmed in an independent platform experiment (year 2015) on a subset of genotypes (n = 4 rep-licates for 276 lines, r = 0.63,S5C Fig).ZCN8 transcript levels detected in the phenotyping platform were also highly correlated with flowering times measured in field experiments (Fig 1CandS5A and S5B Fig). For any given expression level at the second sampling date, lines characterised by a strong increase in expression flowered earlier than the other lines (r = -0.36,
S4C Fig). This suggests that constitutively high levels ofZCN8 and an increase in ZCN8 expres-sion during development both contribute to early flowering time in temperate maize.
ZCN12 is a novel regulator of maize flowering and it is co-expressed with
ZCN8
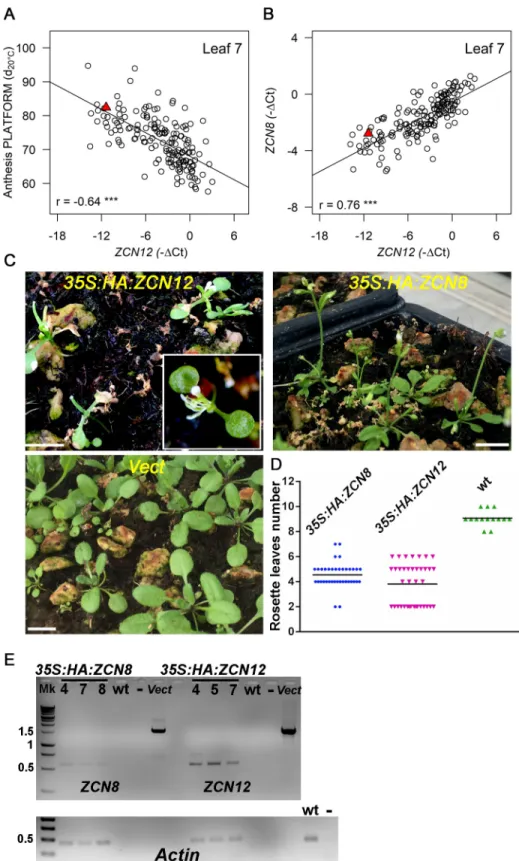
AlthoughZCN12 levels have not been documented so far for their role in flowering time, they showed high heritability (narrow-sense h2= 0.67,S1 Table) and displayed a strong correlation with anthesis time (r = -0.64,Fig 2A) and leaf number in all platform and field experiments (S6A Fig).ZCN12 expression also tightly correlated with that of ZCN8 (r = 0.76,Fig 2Band
S6B Fig), suggesting common regulatory mechanisms. This was in contrast to theZCN7 expression that displayed low heritability (narrow sense h2= 0.11,S1 Table) and a weaker cor-relation with flowering time (r = -0.31,S6C Fig) thanZCN8, despite synteny [30] and shared biochemical functions [31].ZCN7 and ZCN8 expressions were also weakly correlated (S6C Fig). The accumulation ofZmCONZ1, a putative upstream regulator of the florigen genes in maize [32], was not linked toZCN8 or ZCN7 expressions, nor with flowering time (S6D Fig).
In order to demonstrate the role ofZCN12 on flowering time, we cloned the ZCN12 gene for over-expression studies inArabidopsis thaliana. This demonstrated a strong florigenic activity for the ZCN12 protein. Transgenic lines overexpressingZCN12 flowered significantly earlier compared with control plants (Fig 2C–2E). Sixteen of the 40 transgenic plants showed an extremely early flowering phenotype characterised by the conversion of the shoot apical meristem in a terminal flower, with no observable vegetative leaves. The same transformation for theZCN8 gene also caused significantly earlier flowering, but with only two cases of extreme early flowering.
Fig 2.ZCN12 is a novel maize florigen co-regulated with ZCN8. ZCN12 expression correlates with anthesis time
(platform experiment 2014), (A), and withZCN8 expression (B). Genotypic values are BLUEs. Pearson’s correlation
coefficients are indicated with their significance (���, p < 10−4). The red triangle represents genotypic values for the
reference line B73. In (A) and (B), n = 173. (C) Arabidopsis T1 plants overexpressingZCN12 but not ZCN8 show an
extreme early flowering phenotype compared to empty vector transformation (Vect.); plants were photographed 3 weeks after sowing, horizontal bar, 1 cm. (D)ZCN8 and ZCN12 T1 over-expressing plants are earlier flowering than wild type
Direct roles of
ZCN12 and ZCN8 in the control of flowering time
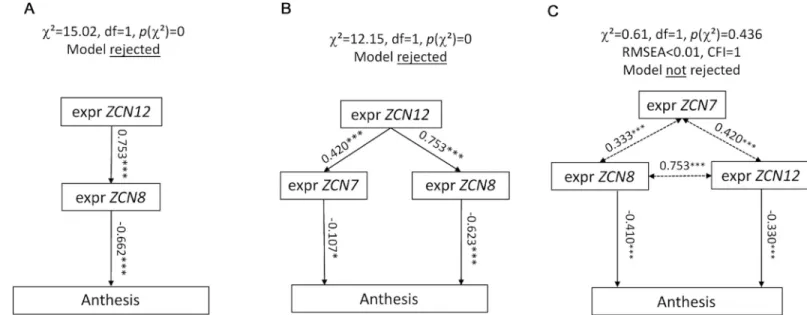
We then showed thatZCN12 had a direct effect on maize flowering time. Indeed, structural equation modelling rejected models in whichZCN12 had an upstream effect by controlling ZCN8 and/or ZCN7 expressions, which would in turn control anthesis (Fig 3A and 3B,S7A and S7B Fig). Conversely, our analysis supported models in whichZCN12 accumulation had a direct effect on anthesis time, with eitherZCN12 being controlled by ZCN8, or ZCN8 being controlled byZCN12 or co-variation of both genes (Fig 3C,S7C Fig). The latter models dis-played good indices of fit (RMSEA < 0.05, comparative fit index > 0.95). They were consid-ered as equally plausible, thereby supporting the existence of a two-tier florigen system in maize in whichZCN12 acts in parallel with ZCN8.
ZCN8 and ZCN12 regulators map to region controlling maize flowering
time
We then analysed to which extent genomic regions controlling florigens expression co-local-ised with regions controlling flowering time. A genome-wide association study (GWAS) iden-tified 570 QTLs which largely overlapped between field and greenhouse experiments (S2and
S3Tables), resulting in 214 meta-QTLs that harboured at least one QTL (Fig 4A) of flowering time, in either field or greenhouse experiments. An eQTL GWAS detected 52 meta-QTLs for ZCN8, among which half co-localised with flowering time QTLs. We also detected 85
meta-(p < 0.01, one-way ANOVA with post-hoc Tukey HSD test). Horizontal bars, mean values of rosette leaves number. n = 37, 38 and 14 for, respectively,35S:HA:ZCN8 35S:HA:ZCN12 and wild type (empty vector). (E) RT-PCR analysis on ZCN8/12 transcripts derived from independent T2 transgenic plants of the indicated genotypes. Amplification of vectors
(Vect) harbouring genomic versions ofZCN8 and ZCN12 afforded a positive control whereas untransformed wild type
and no DNA reactions (-) were used as negative controls. Actin expression was used for normalization (lower panel). Numbers on the left are kb based on DNA ladder (Mk) migration. Amplifications were conducted for 25 cycles.
https://doi.org/10.1371/journal.pgen.1008882.g002
Fig 3.ZCN12 directly affects anthesis. Three families of path diagrams were tested against the whole dataset (BLUEs, platform experiment of 2014). Models in which ZCN12 has an indirect effect on anthesis (A and B) were rejected, whereas models in which both ZCN8 and ZCN12 directly affect anthesis were accepted, with an
indirect effect ofZCN7 (C). Arrows, linear functional relationships between anthesis and florigen expression. Simple-headed arrows, relationships are considered as
causal by the model. Double-headed arrows, free correlations. Standardized path coefficients are indicated on each arrow with the level of significance (���: P < 0.001,
ns: not significant). Other models tested are displayed inS7 Fig.
Fig 4.ZCN eQTLs are major contributors to the genetic variance of flowering time. (A) ZCN-related QTLs overlap
with flowering time QTLs. Venn diagram highlights ‘meta-QTLs’ shared among flowering-related traits andZCN
transcripts accumulation. “Flowering” meta-QTLs are defined as regions containing at least one QTL among anthesis, silking, total number of leaves in at least one experiment (platform, field, years). “ZCN-” meta-QTLs are defined as
regions containing at least oneZCN- eQTL in at least one experiment (platform 2014–2015) and leaf stage. (B)
QTLs forZCN12 and 38 for ZCN7 (Fig 4A). 12 meta-QTLs were shared betweenZCN8 and ZCN12, of which 7 mapped to flowering time QTLs (Fig 4A). They also overlapped with flow-ering time QTLs detected in published studies [7] (S4 Table).ZCN eQTLs had a high contribu-tion to the genetic variance of flowering time as shown by mixed-models applied to individual experiments (S5 Table). Indeed, in the platform experiment of 2014, the 19ZCN eQTLs that co-localised with anthesis QTLs accounted for 57% of the genetic variance of anthesis in the platform experiment (vs 75% for all 43 QTLs of anthesis). Similar results were found when considering anthesis in the field, or total leaf number in each experiment (S5 Table).
We inspected theZCN eQTLs for the presence of candidate genes or QTLs already known to control flowering time. In the Bin 3.05 hotspot region known for flowering time regulation [21,33], we identified fiveZCN-related eQTLs which co-localised with at least one QTL of flowering time (S3 Table). An eQTL ofZCN8/12 (158.73–159.93Mb) was located at a genomic position compatible with the newly described transcriptional regulatorZmMADS69 (GRMZM 2G171650) [18,21,34] (Fig 4B and 4C). Another eQTL region (Bin 8.05) comprised the gene GRMZM2G700665 (also known as Rap2.7) (S8B FigandS4 Table), encoding a floral repressor [19] and negative regulator ofZCN8 [18].
Analysis of published whole-genome expression datasets [35] was used to check if tran-scripts whose expression correlated withZCN8 were over-represented at ZCN eQTLs posi-tions. We confirmed significant correlations between anthesis andZCN8/12/7 expression (n = 181 lines, r = up to - 0.54) (S9A–S9C Fig). Furthermore, these datasets revealed strong patterns of co-regulation not only betweenZCN8 and ZCN12 but also between ZCN8 and ZCN7 (n = 204 lines, r = up to 0.76) (S9D–S9F Fig). Additional 549 transcripts showed a signif-icant correlation withZCN8 expression levels (S6 Table). These were parsed in two clusters composed of genes with opposite trends toZCN8 gene expression and correspondingly oppo-site association with anthesis (S9G Fig). NeitherZmMADS69 nor Rap2.7 nor any other gene in the eQTLs regions within Bin 3.05 were co-expressed withZCN8, and co-expressed transcripts were not particularly enriched in eQTLs regions (S4 Table).
Signs of selection at
ZCN8 and ZCN12 eQTLs to control maize flowering
time
The genetic groups in the studied panel showed markedly different values ofZCNs expression levels and anthesis dates (S10A,S10B,S10D and S10E Fig), and clear co-expression ofZCN8 andZCN12 within each group (S10C and S10F Fig). The observed differences in flowering time between admixture groups may be due to selection by past breeding of temperate maize lines. Consistent with this hypothesis, we found significant differences, between the seven genetic groups, in allelic distribution at QTLs showing co-location betweenZCN8/12 expres-sion and flowering time (Fig 5A). Alleles for increased expression ofZCN8 and ZCN12 were more frequent in genetic groups bred for early maturity (Fig 5A). Hence, a pool of early matu-rity alleles was represented within all genetic groups, but in different proportions, suggesting that some combinations were preferentially selected in different groups.
Regional association plot for one meta-QTL on chromosome 3. Distribution of the -log10(pval) for all variants in the
region. The dotted grey line corresponds to–log10(pval) = 4.5 for anthesis-related traits evaluated in the field (purple)
and platform (orange) and 4 for the expression traits evaluated in the platform (green). (C), linkage disequilibrium (LD) heat map of all SNPs in the QTL showing the local LD (r2) between all the variants; Black lines represent the
distribution of the SNPs and the blue boxes represents the genes mapped for the region. Red asterisks represent the position of the most significant SNPs. (See alsoS4 Tablefor candidate genes). Grey areas represent sub-regions harbouring the most significant SNPs and genes and having low LD between them on average.
Fig 5. Flowering time precocity of temperate maize derives from selection atZCN8/12 regulatory regions. (A) Allelic distributions
within genetic groups for 8 major QTLs. The SNPs displayed belong to the core set of 19 QTLs common to anthesis in the platform
We further tested for genome-wide deviation from neutrality in our panel for the chromo-somes 3 and 8 harbouring major meta-QTLs. Fstoutliers approach using BayeScan highlighted
SNPs under selection in theZCN-related QTLs and other regions that might contribute to flow-ering time (Fig 5BandS7 Table). When comparing all six populations (excluding the admixture group ‘diverse dent’), the BayeScan revealed SNPs under selection ranging from a log10(PO)—
posterior odds—of 0.5 to 1 (substantially significant) to higher than 1 (highly significant). Most importantly, this analysis revealed SNPs under selection comprised in theZCN-related QTLs regions, further indicating the contribution ofZCN8/12 regulation to flowering variability.
Discussion
ZCN12 and ZCN8 are co-regulated by trans-acting factors to control
temperate maize flowering
Our study provides an example for how shifts in reproductive development that enable local adaptation can emerge through different florigen levels. Besides confirming the role ofZCN8 in flowering time regulation we also uncover the role ofZCN12 in this process. Interestingly ZCN12 is more distantly related to ZCN8 than ZCN7 [12] and located in a region which is not syntenic toZCN8 [30], yet it underwent a similar regulatory trajectory toZCN8 as shown by the strong co-variation across different lines and experiments.
GWAS approaches support the major contribution of trans-acting factors in driving the expression ofZCN8 and ZCN12 in temperate maize. We also detected a SNP associated with anthesis and silking located approximately 1.7 kbp upstream ofZCN8 (i.e. AX-91100620,S2 Table). However, this and eight other SNPs located in this putative regulatory region were not associated withZCN8 transcript levels. It is unlikely that the absence of cis-type eQTLs for ZCN8 could depend on insufficient coverage of the genetic diversity, since they were discovered on a large set of diverse inbred lines: 32,758 accessions for 6 GBS markers, [36] and 30 acces-sions for 3 Affymetrix Axiom markers [34]. Multiple trans-acting genes and complex long-range regulatory interactions are thus more likely responsible for the accumulation ofZCN8/ ZCN12. Supporting this hypothesis, we detected trans-eQTLs for ZCN8/ZCN12 that colocalize with two genomic regions—Vgt1 and Vgt3—carrying genes involved in flowering time variation (Fig 4B,S8B Fig). These regions include transcriptional regulators known to be under selection in maize latitudinal adaptation, namelyZmMADS69/Vgt3 [18,21,33] andRap2.7/Vgt1 [19,22]. We did not detect any obvious candidate genes associated with photoperiodic signalling (e.g. ZmCCT10), suggesting its small contribution in ZCN8/12 regulation in our panel.
ZmMADS69 and Rap2.7 did not show significant trends of co-expression with their trans-regulated targetsZCN8/12. It is thus possible that that there are many more genes of smaller effect contributing toZCN variations which were not captured in our GWAS. These loci could affect the activity or accumulation of some of the abovementioned transcription factors. For example,microRNA172s are known to interfere with the translation of APETALA2 genes [37] (such asRap2.7), indicating that transcript accumulation of Rap2.7 may not reflect its gene product levels. Another not mutually exclusive explanation may be that regulatory networks that impact onZCNs levels are transient or highly tissue-specific, which would make it difficult to compare independent expression datasets.
experiment in 2014, andZCN transcript accumulations. At each locus the orange colour corresponds to the ’late allele’ (i.e. conferring
delayed anthesis), which is for all 8 SNPs the B73 allele. Genetic groups are listed according to the flowering time phenology (late to early, top to bottom). (B) Genome-wide distribution of FST Bayescan (FSTBS) along chromosome 3 and 8. SNPs under selection are highlighted
in different colors to reflect the different level of confidence for selection (Black: low confidence, Orange: substantial, Red: strong). Regions shaded in blue correspond to meta-QTLs intervals.
We found limited numbers of genes located within eQTLs regions and co-expressed with ZCN8 and 12 (S4 Table). These included a putative RNA binding proteinGRMZM2G107491 (underlying aZCN12-specific eQTL), and two chloroplast-associated proteins (underlying dif-ferentZCN8 eQTLs), implying carbon metabolism in ZCN8 regulation. Carbon status is linked to the transcriptional regulation of theArabidopsis florigen FLOWERING LOCUS T [38] inde-pendent of photoperiod conditions. Moreover, recent studies indicate that temperate maize flowering is associated with expression of genes involved in carbon partitioning (which pro-vides a different molecular signature from photoperiodic flowering induction) [24]. We note that patterns of co-variations may not necessarily define causal, but also indirect relationships. Also, sinceZCN8 levels are linked to flowering, our list of ZCN8 co-expressed genes would lead to overemphasizing the association between gene expression and flowering. Thus, co-expressed genes might also be associated with a different, more biologically distal phenotype. Overall, our data support the contribution of carbon metabolism upstream ofZCN8 and pro-vide an initial framework for the identification of photoperiod independent mechanisms that shapeZCN8 levels across temperate maize varieties.
ZCN8/12 levels underpin independent events of selection for flowering
adaptation
A large body of evidence highlights the importance of the regulation of gene expression in maize evolution and adaptation [39,40] and the contribution of the expressed genome to the heritable phenotypic variance [41]. It is hypothesised that temperate maize is the product of a northbound expansion through North America which was driven by the accumulation of an increasing number of early flowering alleles [42,43].Rap2.7 and many other loci were under selection during the adaptation to high latitudes [22,27] and general patterns of differentiation for flowering time precocity closely followed the proportion of early alleles found in northern flints (earliest), corn belt dents (intermediate) and tropical maize genomes (late maturity). Besides revealing that at least some of these loci exert their effects on flowering time by affect-ingZCNs levels, our study indicates that diversification in flowering can be imposed by combi-natorial allelic effects in a relatively small number ofZCN-related eQTLs regions. While flowering time may represent the main trait under selection, these alleles (through their effect on florigen levels) may also affect other phenotypic outputs, for example florigen levels have been related to inflorescence development in other grasses [44]. We finally provide evidence for different signatures of selection in the main regions previously mapped in the genetic con-trol of flowering time, thus confirming their potential contribution in the adaptation process.
Conclusion
We show that florigen genes play an essential role in the genetic variability of flowering time in those lines in which breeding suppressed photoperiodism. We reveal the role of a novel flori-gen,ZCN12, a non-syntenic paralog of ZCN8, whereas other related candidates had no clear role. Our study points to combinations of trans-type regulatory mechanisms underpinning selection for flowering time in different genetic groups through florigen levels.
Materials and methods
Plant material
A maize collection of 354 lines was assembled in the frame of the DROPS (European project FP7-244374) and Amaizing projects (French National Agency ANR-10-BTBR-01). It consists of historical and breeding American and European dent lines from the main founder group of
modern hybrids [33]. Lines were genotyped using 50K Infinium HD Illumina array [45], a 600K Axiom Affymetrix array [34] and a set of 500K markers obtained by Genotyping by Sequencing (GBS) [33]. Genotyping data were filtered and missing data were imputed using Beagle V3.3.2 [46] after assembling three sub-matrices and removing duplicate loci based on their physical position. After quality control, 758,863 polymorphic single-nucleotide polymor-phisms (SNPs) were retained for GWAS analyses. All physical positions referred to hereafter are based on the B73 reference genome [47] RefGen_V2. Based on the 50K [33], seven genetic groups were identified using the ADMIXTURE software. These groups were constituted by: (i) 53 lines in the Non Stiff Stalk (Iodent) family traced by PH207, (ii) 18 European dent in the one traced by D06, (iii) 38 lines in the Lancaster family traced by Mo17, (iv) 17 in the one traced by Oh43, (v) 39 lines in the stiff stalk family traced by B73, (vi) 43 lines in the one traced by B14a, and (vii) 146 lines that did not fit into the six primary heterotic groups, such as W117, NC358, and F252 (referred to as “diverse dent”). B73 was considered as the reference line [47].
Assessment of flowering related traits in the field
The panel was assessed in two consecutive field experiments for flowering related traits. Exper-iments were conducted at Saint Martin de Hinx (INRA experimental station, 43˚N, 1.3˚W, France) in spring-summer 2015 and 2016, using alpha-lattice designs with two replicates under well-watered conditions piloted by soil sensors. Male (anthesis) and female (silking) flowering dates, as well as the total number of leaves (including the ones lost) produced were measured for all the lines. Air temperature was measured every hour in each experiment at 2m height over a reference grass canopy, and the progression of the crop cycle site was character-ized via thermal time after emergence, expressed in equivalent days at 20˚C (d20˚C) [48].
Flowering-related traits measurements in the platform
Two subpanels of 327 lines and 276 lines were grown in the Phenoarch platform [49] (https:// www6.montpellier.inrae.fr/lepse_eng/M3P) respectively in autumn 2014 and spring 2015 under natural fluctuating daylength conditions (with a minimum daylength of 14 hours). The two subpanels were optimized using the algorithm described in Rincent et al. [50] that allows to maximise genetic information by discarding individuals that might be more easily predict-able. Five plants per line were grown under well-watered conditions and daily assessed for developmental traits. The number of visible and ligulated leaves of every plant was scored twice a week. Anthesis, silking (in d20˚C) and the total number of leaves produced (including
the ones lost) were assessed for all the lines.
Tissue sampling for transcripts expression analysis
Maize leaves were sampled at two developmental stages, ligulated leaf 4 and 7 (L4 and L7, respectively) from plants growing in the platform. The sampling day was decided based on B73 stage, which was used as a morphological reference. Four plants were sampled for each line. Samples deprived of the midvein were collected in the distal portion of fully expanded leaves (with clearly visible ligule) of each plant at approximately the same time of the day (within 90 minutes from sunrise). Sampling was conducted over three consecutive days for each sampling stage, and the fourth sampling was done soon after the third one. The collected material was kept in liquid nitrogen and the tubes were stored at -80˚C.
RNA extraction and cDNA synthesis
The frozen samples were ground at high speed with glass beads in a TissueLyser II apparatus (Qiagen). Qiazol reagent (Qiagen) was added to individual tubes and total RNA was extracted using the Direct-zol™-96 kit (Zymo Research); on-column DNase I digestion was performed following the kit protocol. Total RNA was then quantified using a NanoDrop One instrument (ThermoFisher) and 1000 ng of each RNA sample were used for retrotranscription with the High-Capacity cDNA Reverse Transcription Kit (Applied Biosystems). The cDNA samples were diluted 1:5 with water before proceeding to qPCR experiments.
TAQMAN and SYBR green assays design, implementation and analysis
The genomic and coding sequences of the targetsGRMZM2G179264 (ZCN8), GRMZM2G1 41756 (ZCN7), GRMZM2G103666 (ZCN12) and GRMZM2G405368 (ZmCONZ1) and that of reference genesGRMZM2G102471 (UBIQUITIN CARRIER PROTEIN) [51], andGRMZM2G 153541 (ELONGATION FACTOR 1Α) [52], were retrieved from the MaizeGDB website. Probe design was done by Bio-Rad specialists and PrimePCR Probe Custom Assay (Bio-Rad) were synthesized accordingly; the main features of probes and primers are listed inS8 Table. qPCR experiments were carried out in a CFX96 Real-time PCR System (Bio-Rad) using SsoAd-vanced Universal Probes Supermix (Bio-Rad) and following manufacturer’s specifications. Amplification curves were evaluated using the instrument’s software (Vs 3.1) and relative gene expression was calculated by applying theΔCt method [53–55]. Gene expression was estimated by averaging theΔCt values computed against either GRMZM2G102471, GRMZM2G153541 or the mean of both as references. Expression in the 2015 experiment was evaluated using solelyGRMZM2G153541 as a reference. ZCN12 expression levels derived from 173 of the 327 lines studied, because the detection assay was impaired by a three-nucleotide deletion in the 5’UTR ofZCN12 coinciding with the forward primer annealing site (S11 Fig). Nevertheless, these 173 lines distributed across the genetic groups of our panel in similar proportions as the initial 327 lines. This small deletion had no effects onZCN12 transcript accumulation as fur-ther assayed by qPCR using the QuantiNova SYBR Green PCR Kit (Qiagen) on a subpopula-tion of lines characterised by the presence/absence of the delesubpopula-tion.
Mixed-models, BLUEs and heritability calculation
Analyses were performed using the R software version 3.4.3 [56]. Preliminary data exploration (ANOVA) was conducted to assess the effects of sampling day and time, as well as the actual developmental stage at sampling, on transcripts accumulation (S2 Fig). For all traits measured in the field and platform experiments (flowering-related traits and transcript accumulation), models were selected among several mixed-models to calculate genotypic means. Models were fitted with ASReml-R [57] (version 3), including the line and replicate effects as fixed, random spatial effects, spatially correlated errors, and other fixed effects (year for the field experiments; sampling date or sampling period for transcript accumulation in the platform). For each trait measured in the field and platform experiments (flowering-related traits and transcript accu-mulation), the best mixed-model was selected to estimate the best linear unbiased estimations (BLUEs) of the genotypic means, which were then used in the rest of the analyses. The same model, but considering the line effects as random, was used to estimate variance components, which were used to calculate broad-sense heritability. Narrow-sense heritability was estimated with a model assuming additive SNP effects using the R-package Heritability [58] (version 1.2) and a relatedness matrix as in Millet et al., [59].
Structural equation modelling
Structural equation modelling is a generalized method for the analysis of covariance relation-ships and is used to evaluate the fit of data to a priori causal hypotheses about the functioning of a system [60–62]. These multivariate hypotheses are represented as graphical path models. Structural equation modelling then allows the assessment of the degree of fit between the observed and expected covariances structures, which is expressed as a goodness-of-fitχ2. Here, the aim was to impose a theoretical structure relating the direct and indirect relationships betweenZCN8, ZCN12 and ZCN7 transcripts accumulation and flowering taking into account the results of bivariate correlations. BLUEs from the platform experiment (2014) were used and the assumption of univariate as well as multivariate normality were verified. Network structures tested were constructed as follow: (i) anthesis was placed downstream of genes expression based on previous knowledge (flowering is a consequence of florigens expression), (ii) then testing for all possible network structures between the 3 florigens acting upstream of anthesis. Models tested are detailed in the results section. Structural equation models were tested in R using the lavaan structural equation modelling package [63] (version 0.6–5), which uses the standard maximum likelihood estimator. A significant goodness-of-fitχ2statistic indicates that the model does not fit the data. Once a model has not been rejected and consid-ered biologically plausible, parameter estimates can be used to study direct, as well as indirect, effects of the variables. Standardized path coefficients quantify the strength of a relationship, whereas the effects of the other variables are held constant. Parameter estimates are tested for significance using z statistics. Root mean square error approximation (RMSEA) and compara-tive fit index (CFI) indices are used to assess the closeness of fit. Good models have a
RMSEA < 0.05 and CFI > 0.95.
GWAS analysis
GWAS was performed on individual traits for each experiment as previously described [59]. Briefly, we used the single locus mixed model:
Y ¼ m þ Xb þ G þ E
whereY is the vector of phenotypic values, μ the overall mean, X is the vector of SNP scores, β is the additive effect, andG and E represent random polygenic and residual effects. As in Rin-cent et al. [64], the variance-covariance matrix ofG was determined by a genetic relatedness (or kinship) matrix, derived from all SNPs except those on the chromosome containing the SNP being tested. The SNP effectsβ were estimated by generalized least squares, and their sig-nificance (H0:β = 0) tested with an F-statistic. This model accounting for relatedness was
found the best to control for confounding factors as compared to models accounting for struc-ture or relatedness plus strucstruc-ture. Analyses were performed with FaST-LMM v2.07 [65]. Physi-cal positions of significant SNPs were projected on the consensus genetic map for Dent genetic material [66]. Candidate SNPs distant less than 0.1 cM were considered as belonging to a com-mon QTL, described via the most significant SNP in the QTL and the interval between all SNPs belonging to the QTL. Co-localizations between QTLs (across traits and experiments) were identified using the same 0.1cM window.
Regional plot definition
Annotated genes located within QTLs were identified according to maize annotation version 2 (MaizeGDB). For the entire QTL, the pairwise LD (R2) between all variants was estimated using the r-package snpStat [67] (version 1.33.0) and plotted with LDheatmap [68] (version
0.99–7) here shown as a triangle plot. Based on the LD pattern and the levels of significance of SNPs, the QTL were split into sub-regions.
Exploration of selective pressure for flowering-related traits and
transcripts accumulation
Allelic distributions within the population were explored at SNPs representative of the core-set of QTLs and revealed strong contrasts across genetic groups. An FSTstudy was then
under-taken for identifying outlier loci that would differentiate the genetic groups more than the average genomic background. Bayescan version 2.1 [69] decomposes the Locus-population FSTinto a component specific for the population shared by all loci (beta) and a component
specific for the locus shared by all the populations (alpha). Departure from neutrality at any given locus is assumed when alpha is significantly different from zero. Decisions about the chance of each locus being under selection are made based on posterior odds (PO) comparing the models with and without alpha component. We used as evidence of SNPs under selection markers with log10(PO) > 0.5 which corresponds to markers considered substantially
signifi-cant [27].
Re-analysis of RNAseq data
Expression counts relative to RNA-seq experiments and flowering time [35] were downloaded from the Cyverse Discovery Environment under the directory:https://datacommons.cyverse. org/browse/iplant/home/shared/commons_repo/curated/Kremling_Nature3RNASeq282_ March2018. We used data for post-sexual maturity leaves during the day (LMAD) because expression counts forZCN7/8/12 at earlier stages (e.g. leaf 3) were extremely low and not avail-able for all lines. We included transcripts accumulation dataset for 204 dent lines (with no bio-logical replicates), of which 182 had also data available for anthesis (BLUPs). We discarded extreme outliers (respectivelyZCN8 > 400, ZCN12 > 350 and ZCN7 > 150 expression counts). We thus obtained correlations between the expression counts of each annotated gene in the maize genome andZCN8 was calculated (correlation coefficient (r) and associated p-value). The same method was applied to establish the relationship between the expression of each gene and anthesis data. Co-expression data were further reduced by applying a Bonfer-roni correction and analysed with a k-means clustering approach [70].
Gene cloning, transformation and growth of
Arabidopsis
ZCN12 and ZCN8 were amplified from genomic DNA from B73 with oligonucleotides lcm116, 117, 118 and 119 as detailed inS7 Table. These primers incorporate sequences for Gateway-based cloning (Invitrogen) and include start and stop codons. PCR products were subject to a second round of PCR amplification with adapters art77 and art78. Gel-purified PCR products were cloned into Gateway pDONR221 vector through BP-mediated recombina-tion and sequenced.ZCN12 and ZCN8 entry clones were finally recombined into the binary destination vector pEarleyGate201 [71] via LR clonase. We used the floral dip method to trans-form wild-type Columbia Arabidopsis and primary transtrans-formants were selected on soil by continuous applications of Basta. T1 plants that yielded enough seeds were analysed in T2 to monitor transgene-derived expression by RT-PCR. Plants were grown in a climatic chamber under long-day conditions (16 hours of light, 8 hours of dark), a mean daily temperature of 23 degrees (night-day) and 60% humidity, light was provided by fluorescent tubes and PAR (photosynthetically active radiation) was approximately 90μmol m-2s-1.
Supporting information
S1 Fig. A wide flowering time variability conserved across different environments. (A)
Genotypic values of anthesis time, silking and total number of leaves per genetic group, during the platform experiment in 2014. Genetic groups are represented by the name of their founder. D06: n = 14; PH207: n = 42; diverse dents (d.d.): n = 128; Oh43: n = 16; Mo17: n = 35; B14a: n = 41; B73: n = 37. (B) Relationship between genotypic values of the flowering traits (respec-tively anthesis, silking and total number of leaves) in platform experiments conducted over two consecutive years (2014 and 2015). n = 273 lines in common between both years. (C) Rela-tionship between genotypic values for silking (left panel) and the total number of leaves (right panel) measured in the platform (2014) and field (2015–2016). n = 313 lines. In (A), (B) and (C), genotypic values are BLUEs. Correlation coefficients are displayed together with their sig-nificance (���p < 10−4).
(TIF)
S2 Fig.ZCN8 transcript accumulation is not consistently affected by day of sampling, time
of sampling within a day, or actual leaf stage at sampling. (A, C)ZCN8 transcript accumula-tion over three consecutive days per sub-period of ca. 30 minutes (covering 1.5 to 3 hours after dawn within each sampling day) at stage ligulated leaf 7 (A) or 4 (C). The number of individu-als that were sampled is indicated for each day together with the time window of sampling. (B, D) Distribution of the actual number of ligulated leaves within the population at the sampling stage ligulated leaf 7 (B) or 4, (D). Insets show the absence of correlation betweenZCN8 tran-script accumulation and the actual number of ligulated leaves.
(TIF)
S3 Fig. Three methods of normalization ofZCN8 transcript accumulation show highly
consistent results. (A, B) Correlation between anthesis and expression ofZCN8 transcript accumulation—respectively measured at stage leaf 7 (A) or leaf 4 (B)—normalized either by EF1a, by UCe, or by the average (“ave”) of EF1a and UCe transcript accumulations, for individ-ual data (n = 980 plants). (C, D) Correlation between anthesis and expression ofZCN8 tran-script accumulation—respectively measured at stage leaf 7 (C) or leaf 4 (D)—normalized againstEF1a, UCe, or the average (“ave”) of EF1a and UCe transcripts accumulation, for geno-typic values (n = 320 lines). In each panel, the X and Y axes show the units of the variable dis-played in the main diagonal. Transcript accumulation is expressed asΔCt. Anthesis time expressed in equivalent days at 20˚C after germination Pearson’s correlation coefficients are indicated with their significance (���, p < 10−4).
(TIF)
S4 Fig.ZCN8 accumulation increases between stage ligulated leaves 4 and 7 in a
genotype-dependent fashion. (A, B) Genotypic values ofZCN8 accumulation at stages ligulated leaf 4 and 7 in the platform experiment of 2014.n = 320 lines. The effect of stage (L4 vs L7) on ZCN8 accumulation was found significant (p < 0.001) by ANOVA. (C) Relationship between the residuals extracted from the regression betweenZCN8 at stage ligulated leaf 4 vs. 7 displayed in (A), and anthesis time measured in the same platform experiment. Genotypic values are BLUEs. Pearson’s correlation coefficients are indicated with their significance (���, p < 10−4).
(TIF)
S5 Fig. Strong correlation betweenZCN8 accumulation and flowering time is confirmed
across different environments. (A) Relationship between genotypic values ofZCN8 accumu-lation measured at stage ligulated leaf 7 in the platform in 2014 and the total number of leaves respectively measured in the same experiment (left panel) or the field in 2015–2016 (right
panel).n = 313 lines. (B) Relationship between genotypic values of ZCN8 accumulation in the platform experiment of 2015 on a subset of lines (n = 273 lines) and flowering traits respec-tively measured during the same experiment (left panel, anthesis; middle panel, total number of leaves) or in the field in 2015–2016 (anthesis, right panel). (C) Relationship between geno-typic values ofZCN8 accumulation in platform experiments of 2014 and 2015. n = 273 lines. (D) Relationship between genotypic values ofZCN8 accumulation measured at stage ligulated leaf 4 in the platform (2014) and flowering traits either measured in the same experiment (left panel, anthesis; middle panel, total number of leaves) or the field (right panel, anthesis). n = 313 lines. Genotypic values are BLUEs. Pearson’s correlation coefficients are indicated with their significance (���, p < 10−4).
(TIF)
S6 Fig. Strong correlation betweenZCN12 accumulation and maize flowering is confirmed
across different environments whereasZCN7 and ZmCONZ1 have a weak or no effect. (A)
Relationship between genotypic values ofZCN12 accumulation measured at stage ligulated leaf 7 in the platform in 2014 and flowering traits measured in the same experiment (total number of leaves, left panel) or the field in 2015–2016 (total number of leaves and anthesis, middle and right panels).n = 173 lines. (B) Relationship between genotypic values of ZCN12 accumulation in the platform experiment of 2015 on a subset of lines (n = 160 lines) and, respectively, accumulation ofZCN8 measured during the same experiment (left panel) or accumulation ofZCN12 measured in the first platform experiment (right panel). (C) Relation-ship between genotypic values ofZCN7 and anthesis time (left panel) and ZCN8 accumulation (right panel) in the platform in 2014. (D) Relationship between genotypic values of anthesis measured in the platform in 2014 andZmCONZ1 accumulation. Genotypic values are BLUEs. Pearson’s correlation coefficients are indicated with their significance (���, p < 10−4). The red triangle represents genotypic values for the reference line B73.
(TIF)
S7 Fig. Path diagrams indicate possible direct routes ofZCN12 to activate flowering.
Mod-els in whichZCN12 has an indirect effect on anthesis (A) were rejected, whereas models in which bothZCN8 and ZCN12 directly affect anthesis were accepted, with an indirect effect of ZCN7 (B and C). Arrows represent linear functional relationships between anthesis and flori-gen expression. Simple-headed arrows represent causal relationships, and double-headed arrows represent free correlations. Standardized path coefficients are indicated on each arrow with their level of significance (���: P < 0.001, ns: not significant). All three models were tested against our data on BLUEs and results are given in the upper part of each panel. See alsoFig 3. (TIF)
S8 Fig.ZCN eQTLs are major contributors to the genetic variance of flowering time in the
platform experiment of 2014. (A) Number of QTLs shared between anthesis in the platform
experiment (2014) andZCN eQTLs. Anthesis was recorded in the platform in 2014 and ZCN8/ 7/12 levels were measured in the platform, in 2014 and 2015 at different leaf stages. GWAS was conducted for every trait/experiment, and significant SNPs were grouped according to genetic distances, with a threshold at 0.1 cM to define QTLs. The number of these QTLs is italicised within brackets outside of VENN diagram. The number of common QTLs between traits is italicised within brackets inside each VENN area. QTLs detected were then gathered into QTLs’ regions containing overlapping individual QTLs. The number of common ‘meta-QTLs’ is shown in plain text outside and inside the circles, and a common ‘meta-QTL’ is defined as regions containing at least one QTL of each trait considered. (B) Regional associa-tion plot for one meta QTL on chromosome 8. Distribuassocia-tion of the -log10(pval) for all variants
in the region. The dotted grey line corresponds to–log10(pval) = 4.5 for anthesis-related traits
evaluated in the field (purple) and platform (orange) and 4 for the expression traits evaluated in the platform (green). Bottom panel, linkage disequilibrium (LD) heat map of all SNPs in the QTL showing the local LD (r2) between all the variants; Black lines represent the distribution of the SNPs and the blue boxes represents the genes mapped for the region. Red asterisks rep-resent the position of the most significant SNPs. (See alsoS4 Tablefor candidate genes). Grey areas represent sub-regions harbouring the most significant SNPs and genes and having low LD between them on average.
(TIF)
S9 Fig. Strong patterns of co-regulation are verified in independent datasets. (A to C)
Re-analysis of publicly available data profiling whole genome expression variations from different maize varieties. Comparisons between anthesis and accumulation of respectivelyZCN8 (A, n = 182 lines), ZCN12 (B, n = 180 lines) (B), and ZCN7 (C, n = 178 lines) (C). (D-F) Pairwise comparisons betweenZCNs transcripts accumulation, respectively ZCN8 vs ZCN12 (D, n = 200), ZCN8 vs ZCN7 (E, n = 198), and ZCN12 vs ZCN7 (F, n = 198). Genotypic values (BLUPs) are displayed for anthesis, whereas individual values (no biological replicates) were reported forZCN8, ZCN12 and ZCN7 accumulation. Pearson’s correlation coefficients are indicated with their significance (���, p < 10−4). (G) k-means cluster analysis on the 549 ZCN8-coregulated genes based on their degree of correlation with both ZCN8 expression and flowering time.
(TIF)
S10 Fig.ZCN8 and ZCN12 accumulation follows the flowering time precocity of different
admixture groups. (A-C) Biplots of genetic group values for anthesis vsZCN8 accumulation (A), anthesis vsZCN12 accumulation (B), and ZCN8 vs ZCN12 accumulation (C). Means and standard deviations of genetic group values are calculated from the BLUEs in the platform experiment of 2014. Genetic groups are represented by the name of their founder and the col-our code reflects flowering time phenology as inFig 5A. D06: n = 14; PH207: n = 42; diverse dent: n = 128; Oh43: n = 16; Mo17: n = 35; B14a: n = 41; B73: n = 37. (D-F) Within-group rela-tionship between anthesis and accumulation of respectivelyZCN8 (D), ZCN12 (E) and accu-mulation ofZCN8 vs ZCN12 (F).
(TIF)
S11 Fig. A polymorphism in theZCN12 region affects amplification efficiency. (A)
Sequence alignment of theZCN12 region targeted for amplification in different maize lines. Nucleotides highlighted in grey boxes correspond to forward and reverse primers, respectively whereas the green box corresponds to the probe. Nucleotides highlighted in yellow indicate polymorphisms. Marker AX-90845493 was used to differentiate the B73 from the alternative haplotype in our lines. (B)ZCN12 Taqman assay using genomic DNA derived from lines car-rying the B73 allele (black) or the alternative allele (green).UCe amplification was used for normalization and to derive—ΔCt values. (C) ZCN8 transcript amplification performed on a reduced panel and with a different amplification assay.
(TIF)
S12 Fig. Graphical abstract of the experiments conducted in this study and of the associ-ated datasets. Phenotypic data at the plot level in each field experiment (1a) and at the
geno-typic level in each field experiment and for both field experiment together (1b). Transcripts data at the plant level in each platform experiment (2a) and at the genotypic level in each plat-form experiment (2b). Phenotypic data at the plant level in each platplat-form experiment (3a) and at the genotypic level in each platform experiment (3b). Description of the genotypic material
used (4). The maize 3D canopy is adapted from Pradal et al., [72]. The maize 3D plant is adapted from Fournier and Andrieu [73].
(TIF)
S1 Table. Statistical indicators of the genotypic variability for flowering related traits and florigens transcripts accumulation in individual experiments. Genotypic and residual
vari-ance components were estimated with the mixed-model fitted per experiment accounting for fixed replicate effect, random variety and spatial effects and spatially correlated errors. They were used to estimate an interval of broad-sense heritability such as H2low= varG/(varG
+ varRes/n) and H2high= varG/(varG + varRes/n + varSpatial), with varG the genotypic
vari-ance, varRes the residual variance and varSpatial the spatial variance. Mean values were calcu-lated using BLUEs estimated with the same mixed model but with variety in fixed effect. The same BLUEs were used to estimate narrow sense heritability with a model assuming additive SNP-effects. Units are as follow: anthesis and silking in thermal time (days at 20˚C), transcript accumulation in -ΔCt.
(XLSX)
S2 Table. Complete set of QTLs for flowering related traits and florigens transcript accu-mulation. GWAS was performed on individual traits and significant SNPs were grouped
according to genetic distances, with a threshold at 0.1 cM to define QTLs. Each line contains the information of one QTL with its chromosome (Chr), bin and region (in physical and genetic position), the SNP with the highestP-value (SNP Name), its position (SNP Position), -log10(p) and the allelic effect of the allele of the reference line B73. Physical positions are based on the B73 reference genome RefGen_v2 and were projected on the consensus genetic map for Dent genetic material to obtain the genetic position.
(XLSX)
S3 Table. Set of ‘meta-QTLs’ for flowering-related traits and florigen transcript accumula-tion. 346 main regions containing overlapping individual QTLs were identified fromS2 Table
and defined as ‘meta-QTLs’. Each meta-QTL is defined by its Bin, start position in Mbp, end position in Mbp.
(XLSX)
S4 Table. Core set of QTLs for flowering related traits and florigens transcript accumula-tion. List of QTLs for anthesis, silking and total leaf number that colocalize with eQTLs for
ZCN8 and/or ZCN7 and/or ZCN12 accumulation. Each QTL is described by flowering trait, name of the peak SNP, chromosome, bin, coordinate of the peak SNP, physical coordinates (start and end), genetic coordinates (start and end), florigen accumulation trait. For these QTLs, putative candidate genes are proposed, selected among the list ofZCN8-coexpressed genes (in red) and of known flowering time genes (in green). The established function accord-ing to MaizeGDB or a tentative description inferred from the function of the rice/sorghum/ Arabidopsis orthologs are also shown. Overlaps with flowering time regions detected in Li et al., [7] are listed. DA = days to anthesis, DS = days to silking (DS), ASI = anthesis–silking interval (ASI), DACV = coefficient of variation of DA, DSCV = coefficient of variation of DS as in [7].
(XLSX)
S5 Table. Variance components of the different nested models for anthesis (A, B), silking (C, D) and total number of leaves (E, F) in the platform and the field. Variance components
were estimated with a mixed model with random effects for genotype (G), spatial effects, spa-tially correlated errors and residual error variances (Res) and a fixed effect for replicate (model
M1). In model M2, the complete set of QTLs of the considered flowering trait (e.g. 43 for anthesis in the platform (A)) was added to the fixed terms. In model M3 (respectively M4 and M5), only those QTLs, among the set of the flowering QTLs, which co-localized with eQTLs forZCN8 accumulation (respectively ZCN12 and ZCN7) were added to the fixed terms. In model M6, only those QTLs, among the set of anthesis QTLs, which colocalized withZCN8 and/orZCN12 and/or ZCN7 accumulation were added to the fixed terms. The proportion of variance retained by the candidate QTLs was estimated by comparing respectively models M2, M3, M4, M5 and M6 to model M1.
(XLSX)
S6 Table. List ofZCN8 coregulated genes and their relation to flowering time. Correlation
coefficients (r) as well as statistical parameters (p-value and FDR), are shown to describe rela-tionships between the level of transcript for each gene and eitherZCN8 expression and or anthesis.
(XLSX)
S7 Table. Fst analysis for SNPs under selection. List of significant SNPs under selection
(log10posterior odds (PO) > 0.5) for chromosomes 3 and 8. SNPs were found after
compari-son of the whole population (pop). Rows highlighted in yellow denote SNPs overlapping with core-QTL intervals (QTL). Rows highlighted in green show SNPs that lie within a region that encompasses a coding sequence in an interval of +/- 5 kb. Prob signifies the posterior probabil-ity for the model including selection. log10(PO), the logarithm of Posterior Odds to base 10 for
the model including selection. Alpha is the estimated alpha coefficient indicating the strength and direction of selection. Fst is the coefficient estimated by BayeScanFST. The established function according to MaizeGDB or a tentative description inferred from the function of the rice/sorghum/Arabidopsis orthologs are also shown.
(XLSX)
S8 Table. Primers and assays information used in this study.
(XLSX)
Acknowledgments
We thank Michela Landoni and members of the Conti laboratory for their help with tissue col-lection, Matteo Chiara and Louise Gourlay (University of Milan) for respectively, advice on RNAseq analysis, and critical reading; teams of INRAe Montpellier LEPSE and Saint Martin de Hinx experimental farm for collection of phenotypic data. Alain Charcosset and Cyril Bau-land, (INRAe Le Moulon) for the assembly of the population and valuable discussions, Del-phine Madur, Vale´rie Combes and Sandra Negro (INRAe Le Moulon) for genotyping and diversity analysis; we are grateful to David Pot (CIRAD) for valuable suggestions on Bayescan and Denis Vile (INRAe Montpellier) for help with SEM. We also thank partners from com-panion projects at CREA (Italy), CRB Maize (France), CIAM (Spain), CSIC (Spain), MTA ATK (Hungary), NCRPIS (USA), Univ. of Hohenheim (Germany) who contributed genetic material.
Author Contributions
Conceptualization: Franc¸ois Tardieu, Claude Welcker, Lucio Conti.
Data curation: Sara Castelletti, Aude Coupel-Ledru, Carine Palaffre, Llorenc¸
Formal analysis: Sara Castelletti, Aude Coupel-Ledru, Italo Granato, Ste´phane D. Nicolas,
Claude Welcker.
Funding acquisition: Franc¸ois Tardieu, Lucio Conti.
Investigation: Carine Palaffre, Llorenc¸ Cabrera-Bosquet, Chiara Tonelli, Lucio Conti. Methodology: Ste´phane D. Nicolas, Claude Welcker, Lucio Conti.
Project administration: Lucio Conti.
Resources: Carine Palaffre, Ste´phane D. Nicolas.
Supervision: Franc¸ois Tardieu, Claude Welcker, Lucio Conti. Visualization: Aude Coupel-Ledru, Italo Granato.
Writing – original draft: Sara Castelletti, Aude Coupel-Ledru, Lucio Conti.
Writing – review & editing: Sara Castelletti, Aude Coupel-Ledru, Chiara Tonelli, Ste´phane D.
Nicolas, Franc¸ois Tardieu, Claude Welcker, Lucio Conti.
References
1. Matsuoka Y, Vigouroux Y, Goodman MM, Sanchez G. J, Buckler E, Doebley J. A single domestication for maize shown by multilocus microsatellite genotyping. Proc Natl Acad Sci. 2002; 99: 6080–6084. https://doi.org/10.1073/pnas.052125199PMID:11983901
2. Parent B, Leclere M, Lacube S, Semenov MA, Welcker C, Martre P, et al. Maize yields over Europe may increase in spite of climate change, with an appropriate use of the genetic variability of flowering time. Proc Natl Acad Sci. 2018; 115: 10642–10647.https://doi.org/10.1073/pnas.1720716115PMID: 30275304
3. Colasanti J, Muszynski M. The Maize Floral Transition. Handbook of Maize: Its Biology. 2009. pp. 41– 55.https://doi.org/10.1007/978-0-387-79418-1_3
4. Buckler ES, Holland JB, Bradbury PJ, Acharya CB, Brown PJ, Browne C, et al. The genetic architecture of maize flowering time. Science. 2009; 325: 714–718.https://doi.org/10.1126/science.1174276PMID: 19661422
5. Li D, Wang X, Zhang X, Chen Q, Xu G, Xu D, et al. The genetic architecture of leaf number and its genetic relationship to flowering time in maize. New Phytol. 2016; 210: 256–268.https://doi.org/10. 1111/nph.13765PMID:26593156
6. Chardon F, Virlon B, Moreau L, Falque M, Joets J, Decousset L, et al. Genetic architecture of flowering time in maize as inferred from quantitative trait loci meta-analysis and synteny conservation with the rice genome. Genetics. 2004; 168: 2169–2185.https://doi.org/10.1534/genetics.104.032375PMID: 15611184
7. Li YX, Li C, Bradbury PJ, Liu X, Lu F, Romay CM, et al. Identification of genetic variants associated with maize flowering time using an extremely large multi-genetic background population. Plant J. 2016; 86: 391–402.https://doi.org/10.1111/tpj.13174PMID:27012534
8. Romero Navarro JA, Willcox M, Burgueño J, Romay C, Swarts K, Trachsel S, et al. A study of allelic diversity underlying flowering-time adaptation in maize landraces. Nat Genet. 2017; 49: 476–480. https://doi.org/10.1038/ng.3784PMID:28166212
9. Guo L, Wang X, Zhao M, Huang C, Li C, Li D, et al. Stepwise cis-Regulatory Changes in ZCN8 Contrib-ute to Maize Flowering-Time Adaptation. Curr Biol. 2018; 28: 3005–3015.e4.https://doi.org/10.1016/j. cub.2018.07.029PMID:30220503
10. Kobayashi Y, Weigel D. Move on up, it’s time for change—mobile signals controlling photoperiod-dependent flowering. Genes Dev. 2007; 21: 2371–2384.https://doi.org/10.1101/gad.1589007PMID: 17908925
11. Lazakis CM, Coneva V, Colasanti J. ZCN8 encodes a potential orthologue of Arabidopsis FT florigen that integrates both endogenous and photoperiod flowering signals in maize. J Exp Bot. 2011; 62: 4833–4842.https://doi.org/10.1093/jxb/err129PMID:21730358
12. Danilevskaya ON, Meng X, Hou Z, Ananiev E V, Simmons CR. A genomic and expression compendium of the expanded PEBP gene family from maize. Plant Physiol. 2008; 146: 250–264.https://doi.org/10. 1104/pp.107.109538PMID:17993543