THE CRYSTAL STRUCTURE OF CAHNITE, CaBAsO4 (OH)4
by
Charles T. Prewitt S.B., M.I.T.AAT.rc
(1955)
SUBMITTED IN PARTIAL YULFILLMENT OF THE
REQUIREMENTS FOR THE DEGREE OF MASTER OF SCIENCE
at the
MASSACHUSETTS INSTITUTE OF TECHNOLOGY (1960)
Signature of Author .,. ... . .. . . . . . . Department of>Geolgy nd Geophysics, May 20, 1960
Certified by . . . . t -.. 4-w.Vi 4 . . . , . Thesis Supervisor
Accepted by . . .* . .... ... .
THE CRYSTAL STRUCTURE OF CAHNITE, Ca2BAs0
4 (OH)4
Charles T. Prewitt
Submitted to the Department of Geology on May 20, 1960 in partial fulfillment of the requirements for the degree of
Master of Science.
Cahnite is one of the few crystals which had been assigned to crystal class 4. A precession study showed that its
diffraction sphol is 4/m I-/-, which contains space groups
I4, I4E, and14/. Because of the known 4 morphology, it must
be assigned to space group I4. The unit cell, whose dimensions
are a = 7.11A, o = 6.201, contains two formula weights of
Ca BAsO (OH)L. The structure was studied with the aid of
in ensity medsurements made with a single-crystal diffractometer. Patterson s ntheses were first made for projections along the
c, a, and 110 directions. The atomic numbers of the atoms
are in the ratio As:Ca.0:B =
33:20:8:5,
so that the Pattersonpeaks are dominated by the atom pairs containing arsenic as one member of the pair. Since there are only two arsenic atoms
in a body-centered cell, one As can be arbitrarily assigned to the origin. Then the major peaks of the Patterson syntheses are at locations of atoms in the structure. The structure,
determined approximately in this manner, was refined by two-dimensional difference maps, and later by least squares using all hkl reflections recordable with CuKecradiation.
The structure consist I of As tetrahedrally surrounded by oxygen
at a distance of 1.67 and B tetrahedrally surrounded by oxygen
at a distance of 1.47 . Although the tetrahedra do not share oxygens, they are linked together by hydrogen bonds. The Ca atoms are each swrrounded by 8 oxygen atoms at an average
distance of 2.46A.
Because of interest in the use of the equi-inclination single-crystal diffractometer for the systematic collection of three-dimensional diffraction intensities, general analytical
expressions for T and
#which
can be evaluated by a digitalcomputer have been derived in an appendix. Another appendix gives an analysis of some experimental techniques in crystal
structure analysis.
Thesis Supervisor: Martin J. Buerger Title: Institute Professor
TABLE OF CONTENTS
PAGE
Title and Certificate of approval Abstract
Introduction 1
Previoua work 3
Chemical analyses and density 3
Morphological crystallography 5
Space group and unit cell 5
Collection of intensities 6
Patterson projections 12
Patterson peak distribution 13
Distribution of cations 20
Patterson computed from trial structure 22
a co-ordinate of oxygen 23
Additional evidence 25
Ref inemnt of parameters 26
Preliminary refinement 26
Terperature-factor problem 36
Interatomic distances 39
Locationa of hydrogen atomz 42
Acknowledgment 47
Ref erence; 48
Appendix I
Appendix II
The parameters
I
andJ
for equi-inclination, withapplication to the single-crystal diffractometer 55
Equi-inclination geometry 55
Derivation of 5 and
fi
57Derivation of
db
60Table of and f reduced for each crystal system 61
Appendix III
Procedures in crystal structure analysis 64
Background 64
Modern methods of intensity recording 65
Non-linearity of the Geiger counter 66
Count.rZ statistics 72
Outline of a crystal-structure analysis 75
Preparation for data recording 77
LIST OF ILLUSTRATIONS
PAG2L
Fig. 1
-Fig, 2
Fig. 3
-Device used for reorienting a crystal so that different axial reflections may be recorded.
Wilson plot of cahnite data. The zero level
is higher than the average because atoms in the special positions contribute more strongly to even levels than to odd.
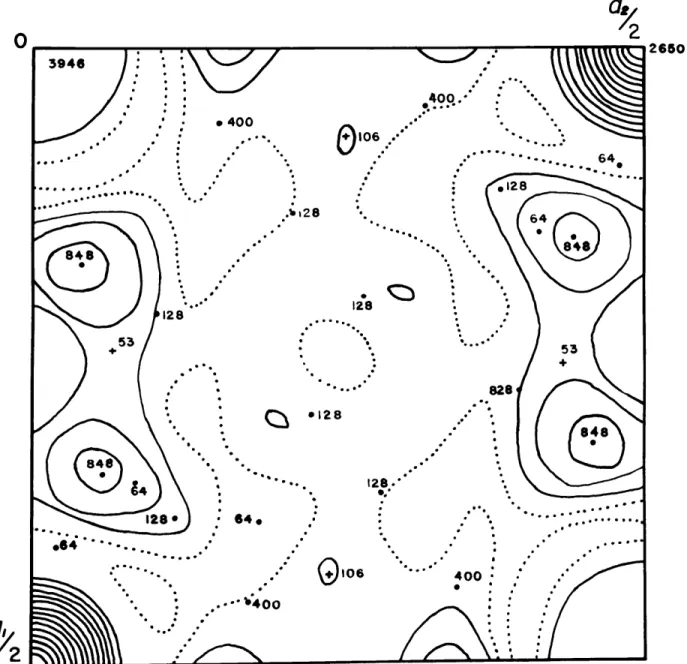
Patterson projection along c. The members represent peak weights as found graphically
by deriving the Patterson from an assumed
structure. The crosses indicate images due to assumed hydrogen positions.
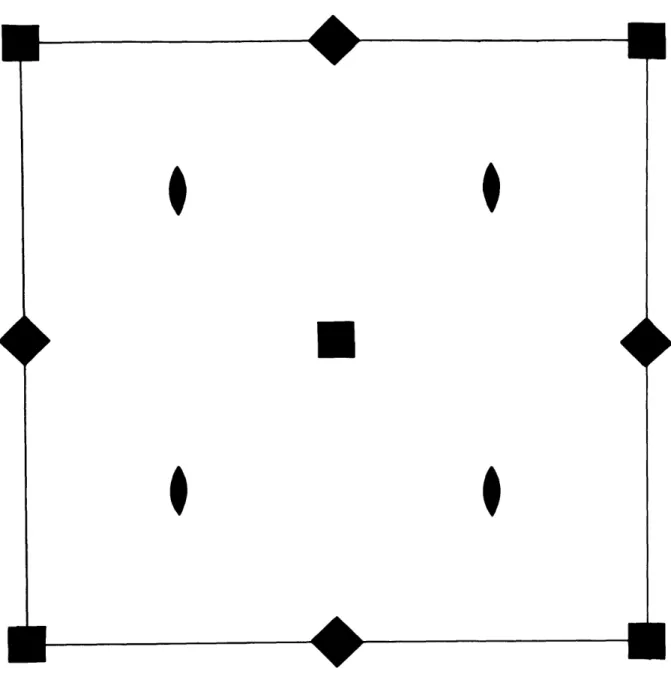
Fig. 4 - Plane group p4. This is the symetry of
Fig. 3.
Fig. 5 - Patterson projection along a.
Fig. 6 - Plane group c2nm, This is the symetry of Fig. 5.
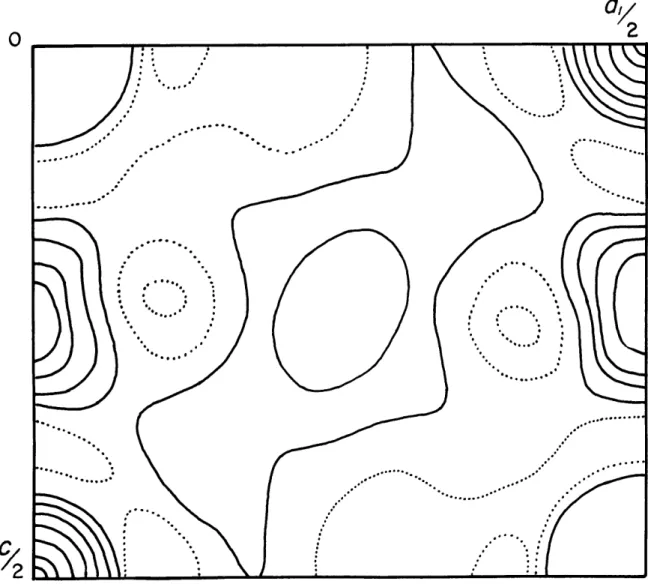
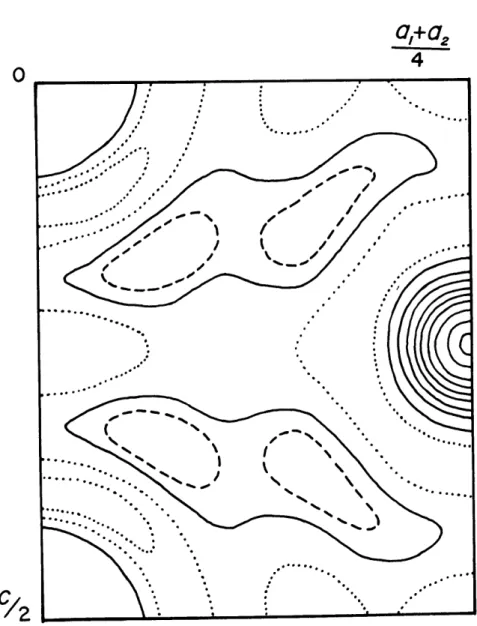
Fig. 7 - Patterson projection along 110 .
The dashed line indicates a ntour interval of one-half the solid line.
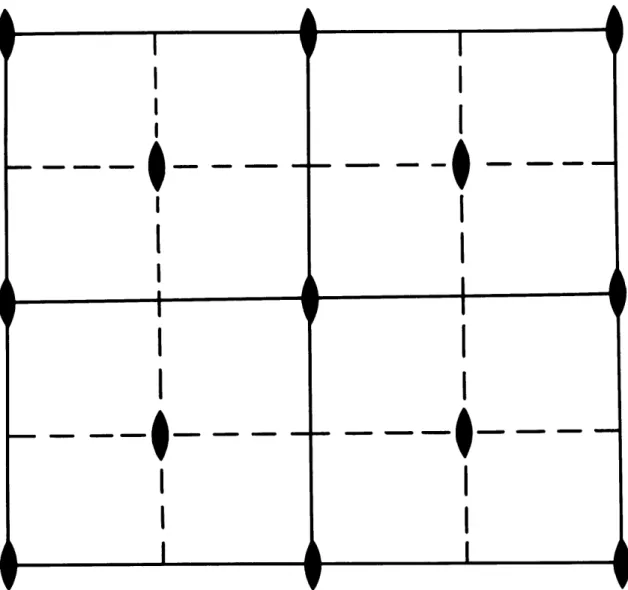
Fig. 8 Plane group p2m. This is the symnetry of
Fig. 7.
Fig. 9 Difference map projected along c.
The structure factors for this map were calculated from the parameters, given in stage 8 of Table 4. The oxygens, marked with crosses, were moved in the direction
indicated to produce Fig. 10. The oxygen
nearest the or gin was moved 0.0051 and
the other 0,OI.
Fig. 10 Result of shifting the oxygen positions as
indicated in Fig, 9. The contours around
the oxygen position farthest from the origin show that it was moved too much.
Fig. 11 - Final c-axis difference map. Peak near
(o, 1/4) may be due to hydrogen.
11 15 16 17 18 19 32 34 35
r
PAGE Fig. 12
-Fig. 13
-Fig.
Model of the cahnite structure projected along c. The As-O tetrahedra are at the corners and the center, while the remaining four are B-0 tetrahedra. Dotted line A indicates an 0-0 distance of 2.80A, an indication of a possible hydrogen bond.
Dotted line B is an alternative possibility
for a hydrogen bond with a distance of 2.95k. Model of the cahnite structure projected
along a. As-0 tetrahedra are at the corners and in the center. The other four tetra-hedra represent B-0. The circles
represent Ca atoms. Dotted lines A and B
are the same as in Fig. 12
Geometry of an upper level of the
reciprocal lattice of a triclinic crystal oriented to rotate around the c axis.
Fig. 15 - Relationship between V and quantities in
the reciprocal lattice.
Fig. 16 - (a) is the response of the Geiger tube to
random quanta as a function of true
average count rate. (b) is the response
if linearity is assumed. (c) is the response if the dead-time is zero.
After W. Parrish27.
Fig. 17
-Fig. 18
-Response of different detectors to Cu radiation. After W. Parrish and
T.R. Kohler29,
Effect of pulse-height discrimination and a nickel filter on the Cu target x-ray tube spectrum. After W. Parrish and
T.R. Kohler 29. 44 45 56 58 67 71 71 14
-nra - -
-LIST OF TABILES
- Chemical analysis of' ca-mite.
Equivalent positions for space group l. R factors and interatomic distances of four possible oxygen orientations. Results of least-squares refinement.
Interatomic distances in eahnite, Distances between oxygen atoms of
adjacent tetrahedra, from
least-squares oo-ordinates.
Values of % and T for various crystal system Table Table Table Table Table Table Table 7 4 21 24 27 40 40 62
Introduction
Cahnite was chosen as the subject for a crystal-structure investigation because it was thought to have a structure which could be solved without undue difficulty so that the principles of crystal-structure investigation could be learned before
undertaking a more ambitious project. Some of the features that made cahnite attractive for structural analysts were that
it had a relatively small cell, that it was classified in a
tetragonal crystal class which contained few other minerals, and that it was possible to cleave the crystals into splinters which are desirable for the collection of x-ray intensities.
At the time it became necessary to begin processing
diffraction data, M.I.T. was transferring between two digital computers, Whirlwind and the IBM 704. Although
crystal-lographic programs had been written for Whirlwind, this computer was no longer available for general use, and new programs had
to b% obtained for the 704, Three of these new programs were written directly in connection with this problem,* In addition,
two other programs written elsewhere were used: a two- and three-dimensional Fourier synthesis and a least-squares refinement2 program.
During the course of the investigation, several techniques were worked out which have been found to be quite useful in
this laboratory. Because this structure analysis was the
first attempted here which used both the Geiger counter and the IBM 704, the new techniques and conclusions of the study with regard to experimental procedures have been brought together
-, U -t
in Appendix III so that this appendix may be used as a reference and guide for future structure investigations.
Probably the most important result of the cahnite
investigation will be to show that, even though the diffraction intensities collected here are much better than those usually
obtained by film methods, they are not good enough to support
ideas about fine detail in the structure. This conclusion
has been reached by others, the situation being very well
outlined by Lonsdale3 who states that, even though agreement
between observed and calculated data is very good, there are
enough variables in the calculations to actually give
misleading results,
The following programs were written in conjunction with
this problem:
1. T1wo-dimensional Fourier synthesis (by S4.. Simpson)
2. Diffractometer settings program for crystals of orthorhombic or higher symmetry (by C.M. Moore)
-~ - -
-Previous Work
Cahnite was first mentioned in the literature in The American Mineralogist as the subject of a paper by
Charles Palache which had been read by title only at the annual
meeting of the Mineralogical Society of America. Subsequently,
Palache and Bauer5 published a paper describing the occurrence,
morphology, chemistry, and physical properties of cahnite.
Since that time, only two papers have been published concerning
cahnite, both by Charles Palache6,7,
Palache named cahnite for its discoverer, Lazard Cahn,
a former Vice-President of the Mineralogical Society of America, who first observed it in 1911. The only locality from which this mineral has been reported is Franklin Furnace, New Jersey.
According to Palache and Bauer5 and Palache 6, cahnite is
found in several associations. It is found implanted on the walls of cavities with axinite, barite, and pyrochroite; with calcite and willemite implanted on massive friedelite and barite or on
garnet; encrusted with datolite in cavities with rhodonite,
barite, hedyphane, and willemite on axinite; with rhodonite only; or with garnet and biotite in cavities in franklinite.
Chemical analyses and density. Palache and Bauer 5
published three analyses of cahnite which are given in Table 1
along with the composition calculated from the formula
Ca2BAsO4
(OH)
4.
According to these authors, analysis 3 inTable o
Chemical analyses of eahnite
37.13 11.64 37.47 11,78 trace 3 37.62 11.86 38.05 12.42 4 37.64 11.74 38.54 12.08 1.58
- very pure material
4a- calculated from formula Ca2BAeO4
(OH)4 CaO B20 3 H20 PbO MgO ZnO 38.27 10.14 36.79 11,75 1,15 0.24 trace trace -0
S - w
From these figures it is evident that there is little likelihood
that much substitution exists in cahnite, nor is there any
doubt that the formula is correct,
Paladhe and Bauer5 give the specific gravity of cahnite
as 3.156 and the hardness as 3. It is uniaxial and positive
with wo - 1.662 and E = 1.663.
Morpfological crystalloraphy. Palache7 assigned cahnite
to the crystal class 4 on the basis of the development of the
form 3113. If this is correct, it makes cahnite one of the few
minerals in this class. Although single untwinned crystals are
quite rare, Palache apparently found enough evidence to state
that there was no doubt that this was the correct symmetry.
Cahnite is generally found in interpenetrating twins with parallel o axes. The twin plane is [1101 or, as will be seen
below, if the twin plane Is based on the x-ray cell, it would
correspond to the form 100} . Palache compared cahnite with
the zeolite edingtonite (BaAli 3 10 .3H20) on the basin of its
form and angles, but, as will be discussed later, there is no structural correlation.
Space group and unit cell
X-ray photographs were taken with the Weissenberg and precession cameras using both CuK and MoK&Aradiation.
Measurement of precession photographs gives a tetragonal cell
a 7.11 A,
c w6.20
R.
All reflections with h + k + Rodd are absent, indicating a
body-centered cell.
The diffraction symbol is 4/f-/= which
contains space groups 14,
Xf,
and 14/S. Because of themorphological symtry, it must be assigned to the space group
The number of formula weights per unit cell is given by
6.2
x 7.11 x 7(3.56)(6,02 1023) (1)59-* 1.99 z 2
where V is the volume of the unit cell, " is the density,
N is Avogadro' s number and W is the molecular weight.
The c/a ratio given by Palache and Bauer5 is equivalent to that of the x-ray determination if the face-centered cell is taken, The axial ratio for the x-ray results is
c/a a 6.20/(7.ll x 1.414) = 0.616
as compared to the morphological value of 0.615. This illus-trates the point made above that Palache indexed the crystal
faces on the basis of the face-centered cell,
Collection of intensities
Collection of three-dimensional diffraction intensities was carried out using an equi-inclination single-crystal diffractmeter employing a Geiger counter as a detector.
and checked for twinning with the polarizing microscope.
Since most of these splintera were elongated parallel to the c axis, it was not possible to definitely eliminate possible
twinning parallel to the e axis. Indeed, Weissenberg
photographs of several of the splinters showed mirror planes introduced by the twinning. The crystal finally chosen was
untwinned and had the following dimensions: 0.061 x
0,064
x 0.3 urn.with the longest dimension in the direction of the c axis. The crystal was mounted with the o axis as the rotation axis,
and oriented with the precession camera before being mounted on
the single-crystal diffractometer.
Because of the difficulties encountered in determining the equi-inclincation co-ordinates using the graphical method of
EvansA analytical expressions were derived by which the settings for each reflection were computed separately. This was a relatively easy task because of the tetragonal
symmetry of cahnite. For the tetragonal system, the
equi-inclination parameter,
T
, which is the angle between thedirect x-ray beam and plane containing the crystal rotation axis
and the axis of the geiger tube, is given by
3
-2
sin
1 (2)where is the length of the vector from the rotation axis to
the reciprocal lattice point in question and R is the radius of
the circle of reflection in a particular reciprocal lattice level.
For the tetragonal system
a (h2 + k 1/d (3)
where a* is the reciprocal lattice translation and is given by
a * A/a. (4)
To obtain the condition for Bragg reflection, a crystal must be
rotated through an angle which is given by
tan~I ( k )(5)
when a, is parallel to the direct x-ray beam tft 0. After deriving the above relations for the tetragonal
system, the author decided to do this also for the general case, triolinic, so that the information would be available
for future crystal structure investigations. This information
is given in Appendix II.
All intensities were collected using CuK.& radiation and
standard Norelco electronic equipment. Provision for recording
different intensities was made by varying the scale factor in
the rccordIng equipment while staying within the linearity
range of the Geiger counter. The strip-chart record was
measured with a planimeter to obtain the integrated intensities. Because of the equi-inclination geometry, the 00t reflections
cannot be recorded (if e is the rotation axis), A device
illustrated in Fig* 1 was designed which allows the crystal to
U
Fig. 1 - Device used for reorienting a crystal so that
r
This can be used to get an approximate idea of the 00
intensities although the different absorption geometry prevents these intensities from being good enough to be used in a
least-squares refinement. To obtain an approximate value for absorption, Ok9 intensities were compared from both the
c-axis and a-axis mountings and absorption values assigned to
00f reflections which had similar diffraction angles.
The linear absorption coefficient for CuK radiation
was found to be 224 cm~l and for MoK t 61 cm~. Because CuKo.
radiation was used, it was necessary to correct for absorption. This correction was made by assuming that the crystal
approximated a cylinder after the method of Buerger and Niizeki9. The average radius of this assumed cylinder was taken as 0.0036 mm, As is discussed in the section on refinement, this radius may be too large, thus giving too great an absorption correction to some of the reflections.
However, all reflections were corrected using this value and
standard absorption tables7. In addition, all reflections
were multiplied by the equi-inclination Lorentz-polarization correction
I/Lp M 2 co 2 in? (6)
l + cos 29
where A is the equi-inclination angle, T is the angle of the Geiger tube, and 9 is the Bragg angle.
Wilson plots10 of the zero-level and the three-dimensional
diffraction data are shown in Fig. 2. The most significant
feature here is that the straight lines drawn through the plots
+ Zero level o All levels 0 In - +1.0-+. 5. 0 -. 5-sin
e
Fig. 2 - Wilson plot of cahnite data. The zero level
is higher than the average because atoms in
the special positions contribute more strongly to even levels than to odd.
This happens because the even and odd levels appear to have two separate scale factors, Another feature of the plots is that there is a considerable reduction in PF2 toward small sin 0. This latter may be due to primary and secondary extinction effects or it may be due to the fact that the Wilson method is not completely valid for crystal structures which have atoms in special positions, In addition, there is the possibility that the methods used to record and correct the data may affect the Wilson plot to some extent. The reasons for these effects are discussed in the section on refinement and in Appendix 11. Because of the difficulty in picking the best line through this partIcular Wilson plot, the FO2 s were not put on an absolute basis,
Patterson Projections
Patterson syntheses were computed for the projections along c, a, and
[iioj
using a two-dimensional Fourier program for the IBM 704 digital computer by 8. N. SimpsonThis program evaluates the relations
+h +k
S
A coo 2Tr(hx+k) (7)+h +k
P' (x,y) 2 2 B sin 2TJ (hx + 4W) (8)
-h -k
for any desired interval in x and y. Because Patterson projections are centrosymetric, it 4Was necessary to use only (7) for these computations.
The three Patterson projections are shown in Figs, 3, 5, and 7'. Ftgs. 4, 6, and 8 show the symmetries of the projections
of the Patterson space group 14/h. It should be pointed out that the c projection of the Patterson space group has the same symetry, p4, as the c projection of the crystal space
group In. However, because of Friedel's law, the side
projections in Patterson and crystal space are not the same,
the former being c2nu for the projection and p2m for the
110& projection, and the latter Clml for the a projection
and p2mm for the
Ell')
projection. This makes the interpretation of the c-axis projection an easier task than the interpretation of the side projections because the center of symmetryintro-duced in the side projections causes the acentric crystal
relationships to be obscured,
Because of the relatively small number of Fourier
coefficients available for each computation, the Patterson maps
show large series termination effects. Any attempt to interpret
the Patterson or, for that matter, the electron-density
projections, must take these effects into account when determining
atom locations.
Patterson peak distribution
The atomic numbers of the atoms in cahnite are in the ratio
As: Ca: 0: Bl H = 33: 208:5:1 so that the Patterson peaks are
dominated by atom pairs containing arsenic as one member of the
pair. Since the body-centered unit cell contains 2 Ca2BAs04 (OH) 4,
as
3946 . -. - 400 -.... 2 8464 O .... 28128 b28 a 64 4 I.E 00 400.-0:0-* .* . -1828 1..28 53 -- . -- 6 128. 128 64--... 82 .64.* . . . el28 ..-- .. 400: O2-. -,4 0 0 I2Fig. 3 Patterson projection along The members
represent peak weights as found graphically
by deriving the Patterson- from an assumed
structure. The crosses indicate images due
4
Fig. 5 - Patterson projection along a.
2
C
EU
I I
I:
This is the symmetry of Fig. 5. Fig. 6 - Plane group c2mm.
0,+G2
4
Fig. 7 - Patterson projection along 110 . The dashed
line indicates a contour interval of one-half the solid line.
Lu rn
V.'
Lu
This is the symmetry of Fig. 7.
distributed among the special and general positions of the space group, Table 2 gives the equipoints for space group I4 as taken from International Tables12. If arsenic is
arbitrarily assigned to the origin in equipoint 2a, the major peaks of the Patterson projections can be expected to lie at locations of atoms in the structure.
If arsenic is assigned to the position 2a, then the boron
and calcium must occupy either two or three of the positions
2b through 2f, Examination of Fig. 3 shows that the strongest
peaks occur at the origin and at (0,1/2), These peaks
represent the usual origin peak plus peaks due to the atoms in special positions.
Two additional strong peaks are in fourfold co-ordination around the origin and (0,1/2). From the formula of cahnite
and from the results of other structure analyses, it is reasonable to assume that the arsenic and boron atoms are
tetrahedrally surrounded by oxygen., If this is true in cahnite,
each of the two additional peaks represents oxygen - (arsenic +
calcium) interactions and determine the approxate oxygen locations.
Distribution of eationg, The next problem is to determine how the two calciums and the boron are distributed among the
remaining special positions, The projection along a, given in
Pig. 6, shows strong peaks at the origin, at (/4,0), and at
(Ob). The unusual shape of the (1/4,0) peaks is probably due
to the coalescence of an oxygen peak with the peak at the special position.
Table 2
Equivalent positions for space group
auIoint Point
try
4f 2t 2o Equivalent positionsX,y,z; tj,z y,i,z; yox,z.
O,0,z; 0,0,4. 0,/P?.,3/4,. 0,1/2, 1/4. 0,0,1A. 4 0,0,0. 2a
The fact that no other peaks occur on (0,z) eliminates
equipoints 4e and 4f in Table 2, This leaves positions 2b, 2c,
and 2d to be filled by the two calciums and the boron. Since
one set of ozygens is co-*ordinated around position (0,)4 in
Fig, 3, this is probably a boron location6 One calcium is
then at (0,b) in Fig, 3 and the other is at (0,0) in equipoint
2b, Because of centrosynetry in the Patterson, the calcium
and boron cannot be distinguished in the a-projection.
It will be shown that it does not matter which of these two
atoms occupies each of the two remaining two positions, 2c and
2d, until the z-co-ordinates of the oxygen atoms have been fixed. However, the boron has been arbitrarily put in position 2e and the calcium in 24.
Patterson comnputed from the trial 0tructure. If the
proposed atom locations are plotted on a c-axis projection of the crystal cell, an idea of the locations and volumes of peaks of the corresponding Patterson can be obtained by the gMphical method of Buerger13. The weights thus determined are plotted
on the overlay on the Patterson map in Fig.
3.
Here thestrongest peaks on the original Patterson coincide with the
points in the computed Patterson and have about the same relative weight. Some of the weaker interactions do not coincide as
well, but it must be remembered that these effects are super-imposed on the series termination errors*
One peak on the Patterson map in Fig. 3 which stands out and is not accounted for by images in the large cations and oxygen is that at (*43, .24), It is possible that this peak is due to
hydrogen since the weight of the hydrogen peak can be expected to be about 1/8 of that of the oxygen. However, because of the uncertainty involved here, this assignment la. only tentative until some of the refinement processes have been completed.
Z .OOmdinate of oygen, If the positions of the four
cations are fixed, the relative positions of the oxygens can be obtained by taking the x and z co-ordinates from Pig. 3 and assuming regular tetrahedral co-ordination around the arsenic
and boron. The orientation of the tetrahedra with respect to
two positions which differ from each other by a 90* rotation around the 4 axis cannot be determined from the Patterson
projections. This means that there are four possible pairs of
orientations, only one of which is correct. One way to get an
idea as to which orientation is best would be to compute
structure factors for each type and compare the resulting R
factors. In order to do this a 704 computer program14 was written to compute two-dimensional structure factors. Table 3
gives the R's obtained from computing Okl structure factors for each of the four possibilities. Since the answer are so close together, this is not adequate evidence for choosing a particular orientation, although the results of computing interatomic
distances in Table 3 show that the orientation with the lowest R is the correct one. The best orientation has been determined
by computing the shortest oxygen-oxygen distance for each
orientation and eliminating those in which any distance is found to be significantly smaller than reported ozgen-oxygen distances.
2li
Table
3
R tactors and Xnteratatc distanoes of four possible oWqrgen orientations
R taoter .28 .22 Intepntonit distanoe* 1.95 1.21 2.77 1.97
*Taken between the centers of the two closest oxygens in -each possible orientation,
Adi nL viene Although the Patterson projections along A in Fig. 5 and along
[110
in Fig. 7 do not give muchuseful informtion about the oxygen positions because of the center of symmetry, they do support the proposed structure in that the assigment of the cations to equipoints
a,
2,, 2e,and 2d agrees with these projections, However, even though
there seems to be no other way in which these atoms can be
distributed, the only way in which one can become confident
that the structure is correct is to refine the adjustable
parameters and compare interatomic distances with values
reported in the literature. This has been done and is presented
Refinement of parameters
Prelinmnary refinment, After the general model of the structure was proposed, it was necessary to begin refinement of parameters. This was done using a 704 least-squares
refinement program 2, two-dimensional Fourier difference maps which were computed using two different 704 programal 1 1, and also the One Dimensional Fourier Analog Computer 1. One
difficulty which arose during the least-squares refinements was that the individual isotropic temperature factors of the arsenic and one of the calcium atoms tended to become negative.
Several different things were tried to determine the cause of
this anomaly, which, even though the validity of the structure is not questioned, is a physical impossibility and should be
cleared up. Although the effect was never completely eliminated,
several ideas were formulated which probably explain what was
actually happening. The complete discussion of this is given in a later section and in Appendix III.
The atomic scattering factors used in the structure
factor calculations were taken from tables given by Freeman1 5
and by Ibers16 . Freeman's values were used for calcium, arsenic,
and oxygen, and Ibers' for boron. The atoms were assumed to be half-ionized, and, if the tables did not give the half-ionized
values, the data given was plotted and the half-ionized curve
drawn in.
Table 4 lists the results of several least-squares
refinements carried out with different imposed restrictions.
27
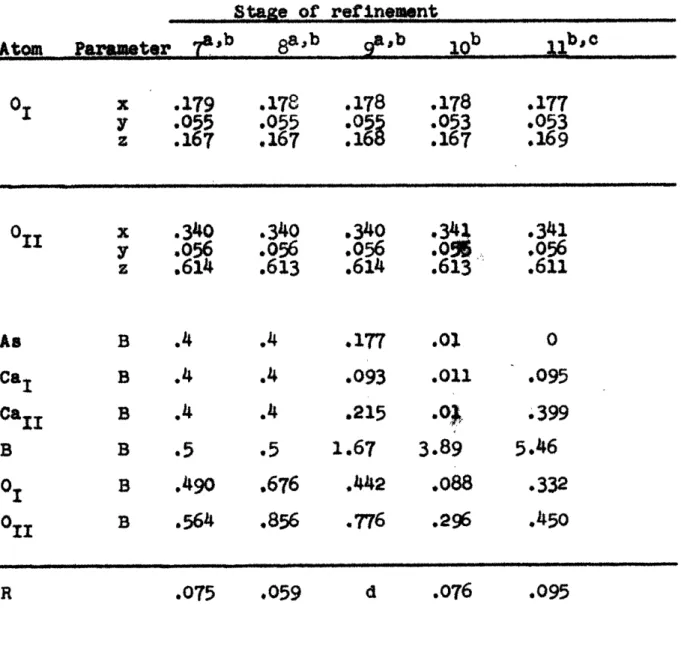
Table 4
Results of least-squares refinement
stage of refinement
Atom Parameter 1 2apb a,b 4a a,b 6a,b
0 x .169 .174 .180
I
.17 .178 y .031 .043 .055 . .054 .054 z .137 .1 .170 .1 .165 .167 Oil .340 .341 .340 .341 .341 .341 y .046 .052 .056 .052 .056 .056 z .614 .610 .609 .610 .612 .612 A# B 1.0 0 -. 136 .4 .4 ,4 CAI B 1.0 0 .148 .5 .4 .4 Ca1 1 B 1.0 0 -. 339 .4 ,4 .4 B B 1.0 2.57 7.25 .5 .5 .5 0 B 1.0 .942 .326 .5 .799 .609 011 B 1.0 .242 .800 .5 .595 .517 .42 .127 d .133 .105 .075a. Reflections with sin20 4 0.2 removed
b. Rejection test excluded all reflections from least-squares
refinement where Po - Fc/70 > 0.25, but included them in R.
c.4 IndiPt4ual scale factors for each level.
d. So R computed
Table 4 (cono.) Stage of refinement 11 ~ ~a a Atom Parater T 817 01 x .179 .178 .178 .178 .177 y .9055 .055 .055 .053 .053 1 .167 :167
:1689
.167:.16
O x .340 .340 .340 .34X .341 y .056 .056 .056 .0% .056 .614 .613 .614 .613 .611 As B .4 .4 .177 .o 0 Ca1 B .4 .4 .093 .011 .095 CaB .4 .4 .215 .. 399 B B .5 .5 1.67 3.89 5.46 01 B .490 .676 .442 .088 .332 oil B .564 .856 .776 .296 .450 .059 d .076 R .075 .095were held fixed and only the oxygen co-ordinates and the
individual isotropic temperature factors were varied, In this
table 01 is the oxygen co-ordinated around arsenic and Oil is
the oxygen around boron.
The startint co-ordinates which appear in stage 1 of Table 4 were obtained from the c-axis Patterson projection, Fig. 3. The centers of the oxygen atoms were taken at the
maxima of the Fourier peaks, thus giving the x and y co-ordinates, The z co-ordinates were calculated using the reSular tetrahedral sytetry of the oxygens. The temperature factors were assumed to be 1.0. The large R factor of .420 is due chiefly to the
fact that the scale factor had been overestimated.
The first cycle of refinement caused the temperature factors of the arsenic and the calcium to become negative. The largest parameter change was in the oxygen co-ordinated around arsenic, Here the change is due to the Patterson peak being made up of more than one image and to the improper
assumption or a regular tetrahedron. The negative temperature factors were set equal to zero and the R of structure factors
calculated from the input of stage 2 was 0.127, a very good value.
Another cycle was run in which all reflections which had
a sin20 (0.2 were not considered at all. In addition, a rejection test was included in the program which rejected all reflections
from the least-squares refinement in which (F - F ),. 0.25,
but included these when computing the R factor. The results of
The temperature factors here are a little higher but still two are negative. The co-ordinates and tempeature factors were then set equal to the values in stage 4 and three cycles of refinement were run reaiting in the data given in stages 5,
6, and 7. The temperature factors were held constant throughout
except for that of Cal from stage 4 t o 5. During these
cycles the oxygen parameters have settled down and appear to
be relatively steady. The R is 4own to 0,075 and probably would not change under further refinement, It the temperature factors of the cations had been allowed to vary, the arsenic and calcium temperature factors would undoubtedly have become
negative, It was also observed that the boron temperature
factor refined to an excessively high value if allowed to vary. At this point, the author began to look for the reason
for the temperature-factor problem, The small-angle reflections had been removed and, although a small change resulted, the
B's remained unusually low, thus ruling out the possibility of primary and secondary extinction effects being the cause of
trouble. In addition, the results of the removal of the small-angle reflections showed that the assumed state of ionization in the structure factor calculation was not the reason for difficulty because, for reflections with sin20 <0.2,
there is little or no difference in the unionized and ionized scattering factors.,
When the Wilson plot (Fig. 2) was made, it was seen that
the even levels were much stronger than the odd levels. This e t
31 Roughly, this means that, on even levels, contributions to the structure factors are sums of the scattering factors of the atoms, and, on odd levels, differences of the scattering
factors of the atoms. This becomes quite important if, for
some reason, the response of the recording equipment is not linear with increasing diffracted beam intensity. This would cause the less intense reflections on the odd levels to be either relatively weaker or stronger than they should be. To see how this might have been affecting the least-squares refinement, a scale factor was assigned to each level so that any differences would show up when each different scale factor was refined, The expected scale factor differences did occur and the results of two cyeles of refinement are given in
Table 4, stages 8 and 9. It is interesting to note that, when
the temperature factors were allowed to vary in the second
cycle, they all remained positive although af1 Are still
unusually low except for boron. The maximum change in any of
the oxygen parameters was t 0,001. The R, of 0,059 in stage 8
was the lowest computed for' three dimensional intensities.
Although it is not generally accepted practice to assign separate scale factors to each level when using counter detectors, these results do indicate that a discrepancy exists in either the
data or the structure
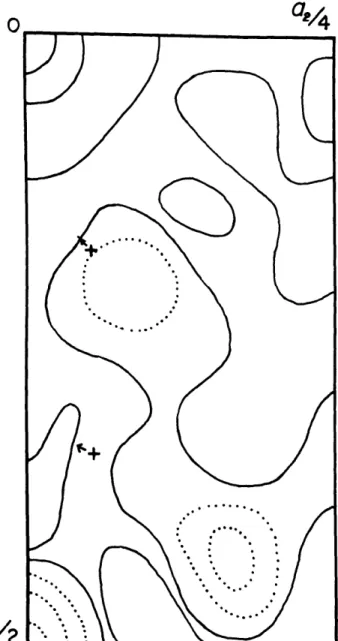
Next, a two-dimensional Fourier difference map was
computed for the c-axis projection using the structure factors computed from the results of stage 8 of Table 4, This map is
0
shown in Fig. 9. Small shifts of about 0,005 and 0.010 A were
0
24
Fig. 9 - Difference map projected along c. The structure
factors for this map were calculated from the parameters given in stage 8 of Table 4.
The oxygens, marked with crosses, were moved in the direction indicated to produce Fig. 10
The oxygen nerst the origin was moved 0.005 and
I-indicated in Pig. 9, Fig. 10 shows that the shift in Oi was too great and that it should be shifted back & slight amount. This is an indication af the sensitivity of the difference Fourier to wrong parameters. A series of four more difference maps was computed, each involving slight changes in oo-ordinates and temperature factors. The last of these ia given in Pig. 11.
The R calculated for the observed and calculated structure factors, excluding 020, for this latter map was .033.
Figa. 9 and 10 did not include reflections for which sin2O
<
.2,but all reflections are included in Fig. 11, The presence or absence of these reflections did not greatly affect the
appearence of the mapse The paramters used for Fig. 11 were
Oxt x - .w177 oi tls .3 40
yn .052 y .054
Bea I na *S*.I04; % l 3 BAS .2 a - .6 -. 65
One of the reasons for computing difference maps for
erytal structures containing hydrogen atoms is to help locate the hydrogens, Nothing further can be done with the difference
maps until the hydrogens are located because the anomalies which' appear to be due to incorrect oxygen locations or
temperature factors may be caused by not having included hydrogen in the structure factor calculations. For this reason, refining
by difference maps was terminated here. The rise of difference
Y2
Fig. 10 - Result of shifting the oxygen positions as
indicated in Fig. 9. The contours around the
oxygen position farthest from the origin show that it was moved too much.
C/4
0.
Fig. 11 - Final ce-axis difference map. Peak near (0, 1/4)
I-A final cycle of refinement was carried out using all reflections except 002, which ia the strongest reflection
from cahnite, and which is greatly affected by primartstinction. The temperature factors of the arsenic and one calcium were
set to 0.01 and all other temperature fac tors were allowed to vary. The results of this are given in stage 10 of Table 4.
Temperature-factor probles*. Nothing tried up to this point has explained the temperature factor anomalies, and,
although this in no way 4asts any doubt on the validity of
the structure, it would be desirable to find out why certain
temperature factors were negative. One possibility which was considered was that the input coefficients to the least-squares refinement were not weighted on a statistical basis.
Several papers have been written which advocate the use of
weighting schemes, and at least twolI 8 have proposed schemes
to weight the results obtained with counter detectors.
Busing17 used the relation
F? V C (9)
V
A
T
+
CB
+
(0.020)23
+
(0.01CE)
2to weight neutron diffraction structure factors for least-squares refinement. In this relation V, is the variance in the
structure factor, V0 is the Vriance in C, the integrated
intensity, C w CT C B where CT and C are total count and
background, respectively, Ca is a correction for primary
The least-squares weight assigned to each reflection would be
w 1/VF. (10)
A patch was written for the Busing least-squares refinement program which computed this quantity automatically except for the extinction correction which was not included. The results of this refinement are given in stage 11, Table 4. The oxygen
parameters changed a little, the arsenic temperature factor remained negative, the boron temperature factor went up to an exceptionally high value, and the R factor went up to .095.
Although it is probable that some weighting scheme should be
used under normal conditions, this does not appear to be the answer to the present problem.
A good idea of what was going on in the refinement was obtained by plotting In (Fo/Fc) vs. sin 2 for each reflection.
The features of this plot are very much like those of the
Wilson plot in Fig. 2 except that the effect of each reflection can be evaluated separately. A straight line drawn through the points showed almost no slope, indicating that there is no
falling off of F with increasing sin2 as would be expected with normal x-ray results. Also, many of the points which
indicated abnormally high F represented relatively weak
reflections. The conclusions which can be drawn here are that something is systematically causing an artificial temperature factor to be imposed on the results and that the weak reflections were not measured accurately.
The cause for the systematic error probably arises
because too large an absorption correction for the integrated Intensities was used. The crystal used for intensity
collection was square in cross-section and the cylindrical
approximation of this took as %ts radius the average of the distances from the center of the square to a face, and to one
of the corners. When making very accurate measurements, it may be that the cylindrical approximation is not good enough and that, if cylindrical or spherical crystals cannot be
obtained, some ;cheme of correction for crystals of irregular
shape must be used. In addition, the occurrence of the
anomalous weak reflections might be due to having used too
high a time constant in the electronic recording equipment
and to the fact that the restrictions of counting statistics were not observed. These features are further discussed in Appendix III.
Interatomic distances
One way in which the validity of a structure can be checked
is to calculate interatomic dirstances between nearest neighbors
and compare these values with results which have been published in the literature. Table , Jives two sets of interatomic
distances for cahnite, one of which has been calculated from
the co-ordinates in column
9
of Table 4, and the other uses the best co-ordinates obtained from two-dimensional difference maps.There have been oeveral recent structure analyses and
refinements of calcium-boron compounds. Johansson1 9 refined the structure of danburite, Ca2 20 208, and found an average value
of 1.475
A
for the boron-oxygen distance as compared with 1.47A or 1.481 in cahnite. The boron-oxygen distances within adanburite tetrahedron were 1.46E, 1.47A, 1.50X, and 1.471.
Johansson also listed other reported boron-oxygen distances which compare quite well with those of danburite and cahnite.
The oxygen-oxygen distances in the danburite boron tetrahedron range from 2.33A to 2.47A, the wide variation being due to the sharing of two of the edges with calcium polyhedra. In a later paper Clark and Christ 2 0 found an average tetrahedral
boron-oxygen distance of 2.48E in CaB3O3(OH) 5 . 2 H20, and an average oxygen-oxygen distance of 2.41E in the boron tetrahedron. The oxygen-oxygen distance in the cahnite boron tetrahedron of
0 o
40
Table 5
Interatomic distances in cahnite
Ditference map Leas t-squaras
a 1.67 A Ca1 aI Cal~ Oi Cal1 -o 01 01
Oi
-i 1.68K
1.48 1.47 2.44 2.55 2.38 2.55 2.62 2.41 2.46 2.55 2.38 2.56 2.65 2.42 Table 6Distances between OXygen atoms of adjacent tetrahedra,
from least-squares co-ordinates
01I
2.80 2.96
2.99 3.62
0o1 2
Johanseson19 reported the calcium in danburite to be 0
co-ordinated by seven oxygens at distances of 2.40 A,
2.52A (2), 2.458A (2), and 2.4631 (2) and two more at 3.005.
The calcium oxygen distances in cahnite listed in Table 5 are
in this range with four oxygens at about 2.40* and four more
at 2.54.
calcium
co-ordination does not generally behavein a set pattern, and these results are not unusual. Clark and
Christ found the calcium in CaB303(OH)5 * 2 H20 to be
surrounded by three oxygens at an average distance of 2.38* and
by five more at 2.53X. Clark21 reported four calcium-oxygen
distances of 2.40E and four of 2.54l in inyoite which is very
similar to the situation in cahnite.
Published arsenic-oxgen distances are less common.
Schulze22 gave 1.66X for arsenic-oxygen in BasO4 as opposed to
1.6TA or 1.68X in cahnite. Dahlman23 reported arsenic-oxygen
distances of 1.61X, 1.65*, 1.76X, and 1.65X in brandite,
Mna2(AsQ4) * 2 20.
The comparisons of these interatomic distances show that
the placements of the large cations and oxygens are essentially
correct. The discrepancies which remain are due to not having located the hydrogen and possibly to errors in the observed data.
Table
6
gives the closest interatomic distances between theoxygens of two adjacent arsenic and boron tetrahedra. This data
was tabulated in order to show any possible hydrogen locations.
Location of hydrogen atoms
A possible site for the location of the hydrogen atom in
the cahnite structure was given in the section on the Patterson
maps. Fig. 3 showed a peak which could not be ascribed to
interactions of any of the other atoms in the structure, and this was thought to be a possible hydrogen peak. In the last difference map, Pig. 11, a fairly large peak occurs at this
same location. A check of the oxygen interatomic distances in
Table 6 reveals an oxygen-oxygen distance which might be a result of hydrogen bonding. This is the distance 2.80L,
between 01 1 and 1 - , The peak described above does not fall between these two oxygens on the c-axis projection, but
lies to one side and appears to be between 0 - 1 and 0 - 2.
The latter oxygens are separated by 2,96A, Clark and Christ2 0
inferred the locations of hydrogens in CaB3(OH)5 . 2 H20 and
assigned hydrogen bonds to oxygen-oxygen distances as great as
2,94A, The authors took four oxygen-oxygen distances ranging
from 2.70X and 2.79A to be due to normal hydrogen bonds and distributed four additional hydrogens among five possible sites
of distances ranging from 2.841 to 2.94A by assuming that some kind of disorder was present. This latter problem is exactly
the difficulty encountered in cahnite except that here only one
hydrogen is to be put into two, or possibly three, locations. The final ansWer has not been found. One would be tempted to
place hydrogen on the position indicated by the peak on the
Patterson and difference maps, but the oxygen-oxygen distance
of 2.8oX cannot be ignored unless some additional proof is found
Because of overconcern with the temperature factors, the
obvious way to check whether the anomalous peak is due to hydrogen has not been attempted. This would be to compute
structure factors and difference maps with the hydrogen included.
This and other recommendations for the future are given in the
next section.
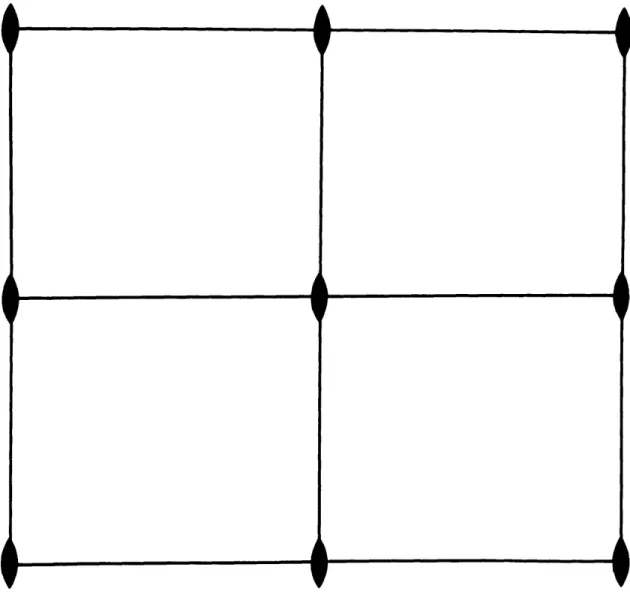
Final structure and conclusions
The final structure proposed for cahnite is shown in the
c- and a-axis projections in Figs. 12 and 13. The possible
hydrogen bonds are indicated by dotted lines. There appears to be no correlation between this structure and that of the zeolite
edingtonite, BaAl2 i 3O10 * 3 H20, as suggested by Palache7.
Edingtonite is composed of linked silicon - oxygen tetrahedra as opposed to the individual arsenic- and boron - oxygen
tetrahedra in cahnite .
It is doubtful that the oxygen paramters would show much
variation if better data were used in there1wot-squares refinement.
However, the questions of the abnormal temperatute factors and
the uncertainty of the hydrogen location would seem to make it
desirable to collect more accurate intensities. The only
satia-factory way to do this would be either to obtain a spherical crystal which would allow a uniform absorption correction or to use a computer program which would calculate absorption corrections for crystals of irregular shapes. The limitations of the recording
equipment and of recording statistics would have to be observed.
Fig. 12 - Model of the cahnite structure projected along c. The As-0 tetrahedra are at the corners and the center, while the remaining
four are B-0 tetrahedra. Dotted line A
indicates an 0-0 distance of 2.80A, an indication of a possible hydrogen bond.
Dotted line B is an alternative possibility for hydrogen bond with a distance of
Fig. 13 - Model of the cahnite
structure projected along a. As-0
tetrahedra are at the corners and in the center. The other
four tetrahedra
represent B-0.
The circles represent Ca atoms. Dotted lines A and B are the same as in Fig. 12.
least-squares refinement and difference maps were still found to be anomalous, would one be justified in adjusting the
scattering factor curves or in assigning some unusual characteristics to the atoms.
However, the basic structure is correct and several valuable techniques have been developed which will be very useful in future crystal structure investigations. The
importance of obtaining accurate intensity information cannot be over-emphasized, because when something unusual occurs, one
must be confident that the observed data is reliable in order
Acknowledgments
The author wishes to thank Professor M.J. Buerger for
the generous support and encouragement he gave throughout this
investigation, Acknowledgment is also due Professor S.M. Simpson
and C.M. Moore for their valuable assistance in the form of programs for the IBM 704, Professor Clifford Frondel of Harvard University kindly supplied some of the type specimens
REFERENCES
1William G. Sly and David P. Shomaker MIPRI, two- and
three-dimensional crystallographic Fourier sunation
progam for the IBM 704, Unpublished report. (1959) 1-60.
2
William
R. Busing and Henri A. Ieyy. A crystallographicleast-squares refinement program-for the IBM 704,
Oak Ridge National Laboratory Central Files No. 59-4-37, Oak Ridge (1959) 1-139,
3xathleen Lonsdale, Thermal vibrations of atoms and
molecules in crystals. Revs, Mode'n Phys. 30 (1958)
168-170,
4Charles Palache. Holdenite and eahnite, two new minerals
from Franklin Furnace, New Jersey. (title only).
6 (1921) 39.
5q. Palache and L.H. Bauer, Cahnite, a new boro-arsenate of calcium from Franklin, New Jersey. , 12 (1927) 149-153.
6Charles Palache., The minerals of Franklin and Sterling Hill, Sussex County, New Jersey. U.S. Geological Survey
Professional Paper 180. (1935) 125-126,
7Charles Palache. Crystallographic notest eahnite, stolzie,
zinette, ultrabasite, A & 26 (1941) 429w-430.
8Howard T. Evans, Jr* Use of a geiger counter for the
measurement of x-ray intensities from small single crystals.
n . 24 (1953) 156-161.
9ac. Hermiann, Internationale Tabellen zur Bestimung von
Kristallstrukturen, Vol. II. Gelbruder Borntraeger, Berlin, (1935) 584,
1 0M.J. Buerger. Crystal structure analysis., John Wiley and
Sons, New York. (1960) 233-237, (In press,.)
11S.. Simpson. Two-dimensional Fourier synthesis program for the IBM 704, Unpublished report. M.I.T. (1959). 1 2 lnternational Tables for x-ray crystallography. Vol. I.
Edited by N.F.M. Henry and K. Lonsdale. 1ynooh Press, Birmingham, England, (1952)
13M.J. erger. Vector space. John Wiley and Sons, New York.
14C.. Morse. Two-dimensional structure factor program for
the IBM 704. M.I.T. (1959). Unpublished report.
14&Lenid V. Azaroff. A one-dimensional Fourier analog
computer. ev. Sci. I 25 (1954) 471477.
15A.J. Freeman. Atomic esattering factor for spherical
and aspherical charge distributions. Act
r
12(1959) 261-271.
16JAms A. Ibers New atomic fo= factors for beryllium and boron,
ActiQrnt.
10 (1957) 86.1
7wilIam
R. Busing and Henri A,. Levy. Neutron diffractionstudy of calcium hydroxide.
L
h 26 (1957) 563-568.8JE. Worsham, Jr., H.A. Levy, and S.W. Peterson,
The positions of hydrogen atoms in urea by neutron diffraction. A-
a!.
10 (1957) 319-323.190eorz Johansson. A refinement of the crystal structure of danburite.
Acta
Cryst, 12 (1959) 522-525.2 0Joan I. Clark and C.L. Christ. Studies of borate minerals
(VII): The crystal structure of Ca (OH)P H2 20.
Kristallogr, 112 (1959) 213-233.
2 1Joan R. Clark. Studies of borate minerals (M).
The crystal structure of inyorte, CaB3O3(0H) 5 ', 4 H20o.
As&a
£fit.. 12 (1959) 162-170.2 Gustav E.R. Schulze. Die kristallastruktur von B94 und
BAO 4 . 24B (1934) 215-240.
2 3Bertil Dahlman, The crystal structures of krohnkite, CuNa2 (S04) . 2 H20 and brandite, MnCa 2 (AsO4)2 . 2 H20' Ark. Min. eo.l 1r (1952) 339.
24wH. Taylor and RT. Jackson. Structure of edingtonite. Z. Kristallogr. 86 (1933) 53-64,
25M.J. Buerger, X-ray crystallography. John Wiley and
Sons.
New York. (1942) 162, 252-295, 349,26J.D. Bernal. On the interpretation of x-ray, single crystal,
rotation photographs. ProcR Sop. (London) A113 (1926)
117-160.
7W. Parrish. X-ray int 1ns measurements with counter tubes.
28*,rold P. Klug and Leroy E. Alexander. X-ray diffraction
procaed.es. John Wiley and Sons. New York. (1954)
261-265.
2 9W. Parrish and T.R. Kohler.
Use of counter tubes in x-ray
analysis.
lg
.27
(1956)795-0O.
30D.W.J. Cruiokshnk. International Tables for x-ray
crgstallogptphy. Vol. II. The Kynoch Press. Birmingham,
England. (1959) 328.
3 1Robert Loevinger and Hones Berman. Efficiency criteria in
radioactivity counting, Nucleanes. 9 (3uly, 1951) 26-39. 320.W. Burnham. Personal coenunication.
51A
Appendix I
Observed and calculated structure tactors
hkl Pa co Ac Be 080 31 29.1 39.5 0 060 64 62,9 85.3 0 040 68 65.9 89.3 0 020 71 106.0 141.0 0 170 16 157 21.3 0 150 11 12'0 16.6 0 130 10 10-4 14.1 0 110 35 33.0 44.8 0 280 42 42.1 57.1 0 260 69 70.9 96.2 0 240 61 57.5 78.0 0 220 56 56.7 76.9 0 370 28 28.4 38.5 0 350 18 18.0 24.4 0 330 32 30.1 40.8 0 0 53 56.7 76.9 0 57 59.6 80.8 0 56 55.1 74.7 0 420 57 57.7 78.2 0 570 30 32.5 44.1 0 550 24 23.0 31.2 0 530 41 39.0 52.8 0 510 55 55.1 74.8 0 660 35 33.7 45.6 0 640 49 47-7 64.7 0 620 63 63,7 86.4 0 750 3 4.9 6.7 0 730 9 11,3 15.3 0 70 23 23,7 32.1 0 0a 46 46.4 62.9 0 071 18 18.8 23.2 10.5 051 25 22.3 29.1 8.0 031 51 42.3 -46 57.2 on 30 27.0 34.7 11.4 181 17 15.6 10.4 -18.4 161 25 21.5 14.4 -25.4 141 28 23.6 26.2 -18.3 121 46 37.6 47.4 -18.7 271 9 10.5 13.5 4-5 251 13 12.4 15,8 -5.6 231 26 19 -13.1 2.7 211 17 18.2 22.9 - .9 381 22 20.0 26.1 -7,3 361 23 18.7 23.2 -10.2
Dc Fe kFc 341 321 471 451 431 411 521 651 631 611 741 i 2