HAL Id: hal-03048832
https://hal.archives-ouvertes.fr/hal-03048832
Submitted on 9 Dec 2020
HAL is a multi-disciplinary open access
archive for the deposit and dissemination of
sci-entific research documents, whether they are
pub-lished or not. The documents may come from
L’archive ouverte pluridisciplinaire HAL, est
destinée au dépôt et à la diffusion de documents
scientifiques de niveau recherche, publiés ou non,
émanant des établissements d’enseignement et de
Quantitative assessment of multi-scale tractography:
bridging the resolution gap with 3D-PLI
Abib Alimi, Matteo Frigo, Samuel Deslauriers-Gauthier, Rachid Deriche
To cite this version:
Abib Alimi, Matteo Frigo, Samuel Deslauriers-Gauthier, Rachid Deriche. Quantitative assessment
of multi-scale tractography: bridging the resolution gap with 3D-PLI. ISMRM & SMRT Virtual
Conference & Exhibition, Aug 2020, Virtual, France. �hal-03048832�
Quantitative assessment of multi-scale
tractography: bridging the resolution gap with
3D-PLI
Abib Alimi
1, Matteo Frigo
1, Samuel Deslauriers-Gauthier
1, and
Rachid Deriche
11
Athena Project-Team, Inria Sophia Antipolis-M´
editerran´
ee,
Universit´
e Cˆ
ote d’Azur, France
1
Introduction
The in vivo validation of diffusion MRI (dMRI)-based tractography has been shown to be a challenging task [Maier-hein et al.]. Therefore, we have been investigating how 3D Polarized Light Imaging (3D-PLI) could be used as a validation tool for dMRI-based fiber orientation estimation and tractography. PLI is an optical imaging technique that provides us with high-resolution fiber orientation measurements at micrometer scale. For this reason, it has been pre-sented as a good candidate for the aforementioned validation tasks [Axer et al, 2011, Alimi et al, 2019submitted]. In some previous works [alimi2017,18isbi, 18ismrm,19,19submitted] we introduced an approach to close the resolution gap between dMRI and 3D-PLI. The study of the brain network from the topolog-ical point of view has seen an increasing interest in the last years [Sizemore et al, 2018, Chung et al, 2017]. In this work, we show how tractograms ob-tained at different spatial scales using 3D-PLI human brain datasets can be inspected using homology theory to perform a quantitative comparison between them. In particular, we investigate the persistence of the number of connected components in brain networks estimated from data at different resolutions.
2
Methods
Analytical Fiber ODF in 3D-PLI : From 3D-PLI dataset, FOD can be recon-structed [Axer et al, 2016, Alimi et al, 2018isbi, 2019ismrm, 2019isbi, 2019Me-dIAsubmitted] and computed at different spatial scales by changing the size of the so-called super-voxel (SV) which allows downsampling the micrometer res-olutions up to the millimeters (of dMRI). In [Alimi et al, 2018isbi, 2019ismrm,
2019isbi, 2019MedIAsubmitted] our FOD is analytically described on a spher-ical harmonics basis and elegantly and efficiently computed via the spherspher-ical Fourier transform and by means of the 2D Diracs delta δ function. This analyt-ical approach is computationally efficient and allows fast computations of FODs from 3D-PLI data.
Multi-scale tractography : The FODs can be computed by varying the SV sizes, allowing to perform tractography at different spatial resolutions. Seeding from the gray matter - white matter interface we obtained 10 million streamlines at each resolution with the iFOD2 algorithm implemented in Mrtrix3 [Touriner et al, 2019]. A weight was associated to each streamline using SIFT2 [Smith et al, 2015] to re-establish the balance between streamline density and the fiber density computed from the fODFs. The chosen atlas is defined such as every voxel in the gray matter - white matter interface is a different region. In this way, proximity in the atlas is coupled with proximity of the assigned labels. Finally, a weighted connectivity matrix was computed at each resolution using the defined streamline weights and atlas.
Homology analysis: The analysis of the homology of the obtained networks was performed by measuring the persistence of the 0-th Betti β0on the natural filtration of the graph. This was achieved by counting the number of con-nected components of the graph when thresholded at the levels defined by the unique values of the edge weights in the network. The shape of the obtained threshold−β0 curves give an insight on the robustness of β0with respect to the chosen threshold for a specific network.
Human Brain Dataset: The studied dataset consists of 50 unstained histo-logical coronal slices of the right hemisphere. Each slice is 70 microns thick with an in-plane resolution of 64 × 64 µm2. Further details about this datasets’ preparation and imaging can be found in [Schmitz et al, 2018]. The SV size which closes the gap with dMRI resolution has dimension of SV = 25 × 25 × 25 natines voxels isotropic.
3
Results and discussion
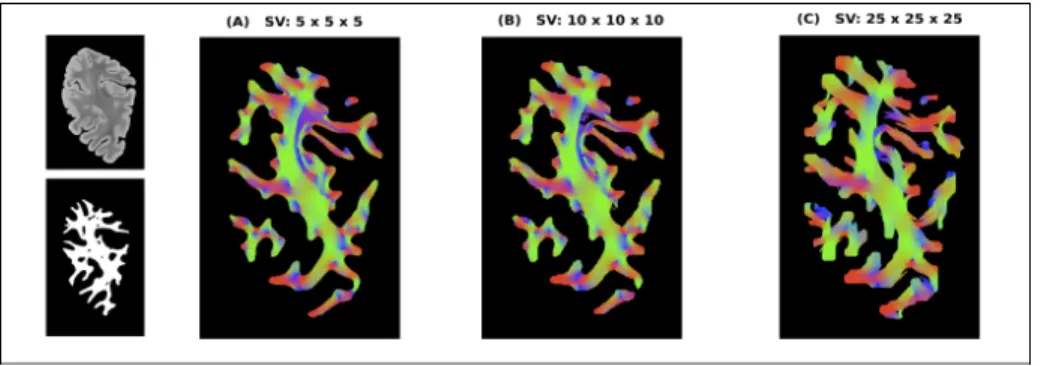
Figure 1 displays the generated stramlines from the 3D-PLI high-resolution data up to the relatively low dMRI resolution. From (A) to (C), the spatial resolution decreases however the integrity of the brain fiber pathways are preserved.
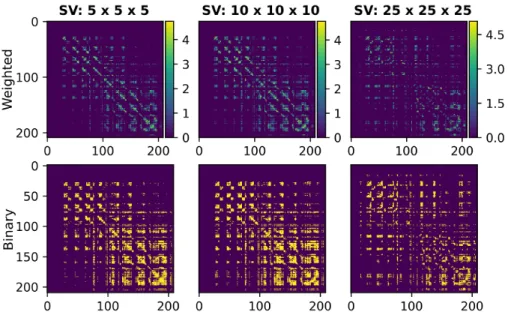
The first row of figure 2 shows the connectivity matrices obtained with dif-ferent SV sizes. Notice the pervasive presence of small communities of regions at every resolution. This is due to the existence of many U-fibers in the occipi-tal lobe as demonstrated from histology and dissection studies by [Sachs et al. 1893] and [Vergani et al. 2014] Moreover, the second row of figure 2 shows the sparsity pattern of the obtained weighted connectivity matrices, highlighting the presence of weaker connections between further regions. These weaker con-nections are more present in the connectome obtained with the lowest resolution from a SV size of 25 × 25 × 25.
Figure 1: Panels A-B-C show the streamlines passing through the central coronal slice of the studied dataset with the usual orientation-based colouring. It is possible to notice the different white matter structures that are generated with data at different SV resolution. The figure on the top left is the transmittance image obtained from PLI. The figure on the bottom left is the used white matter mask.
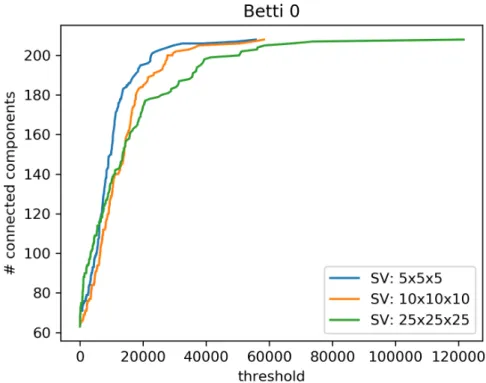
Figure 3 shows the evolution of the Betti 0 number β0 with respect to the thresholding level applied to the matrix. The value of β0 for the original con-nectomes (threshold equal to 0) is 67 for the highest resolution dataset, 64 for the mid resolution dataset and 63 for the lowest resolution dataset. Since each region is composed of only one voxel, these differences correspond to minimal changes in the obtained tractograms and should not be interpreted as struc-tural differences caused by the diverse super-voxel sizes. Up to a threshold level of around 15000 units the three curves have a similar behaviour, showing how thresholding at low levels does not affect the comparability of the β0 features of the connectomes. On the contrary, as soon as the 15000 units level is reached, the differences between the number of connected components of the three con-nectomes become higher, losing comparability between the β0 features. The comparability is restored for high values of the threshold, where the connec-tome is reduced to a graph made almost uniquely of isolated nodes. This case is not interesting for our comparison and is included only to show the correct termination of the analysis.
4
Conclusion
In the context of defining a validation technique for dMRI-based tractography by means of 3D-PLI imaging, this work represents an important step bridging the concept of brain connectivity and the work we did in the last years on closing the imaging resolution gap. The employed approach makes use of the concept of 0-th Betti number, allowing a direct comparison of the topology of the brain networks obtained with data at different super-voxel resolutions. Our results demonstrated that analogies in β0between these connectomes may be observed
Figure 2: The first row shows the weighted connectivity matrices corresponding to the tractograms obtained at the three studied resolutions. The second row shows the sparsity pattern of the connectomes in the first row.
only if the corresponding networks are thresholded up to a relatively small value, hence taking into account both the stronger and the weaker connections regardless of the chosen spatial resolution. This paves the way for 3D-PLI to be a potential validation approach for dMRI-based tractography.
5
Acknowledgment
This work was partly supported by ANR “MOSIFAH” under ANR-13-MONU-0009-01 and the ERC under the European Union’s Horizon 2020 research and innovation program (ERC Advanced Grant agreement No 694665:CoBCoM). We would like to thank professor Marcus Axer and his group for providing the 3D-PLI human brain datasets.
6
References
Maier-Hein, Klaus H., et al. ”The challenge of mapping the human connectome based on diffusion tractography.” Nature communications 8.1 (2017): 1349.
Jouk et al., Three-dimensional cartography of the pattern of the myofibers in the second trimester fetal human heart, Anatomy and embryology, vol. 202, no. 2, pp. 103–118, 2000.
Figure 3: Each line represents the β0curve associated to a connectome obtained from data at a specific resolution. The value of the three curves at zero threshold is 67 for the 5x5x5 SV resolution, 64 for the 10x10x10 SV resolution and 63 for the 25x25x25 SV resolution. The fact that the three curves terminate at different thresholds happens because the maximal entry in the corresponding connectivity matrix is different for each connectome.
Axer et al., A novel approach to the human connectome: ultra-high reso-lution mapping of fiber tracts in the brain, Neuroimage, vol. 54, no. 2, pp. 1091–1101, 2011.
Alimi et al., Solving the inclination sign ambiguity in three dimensional polarized light imaging with a pde-based method, in Biomedical Imaging (ISBI 2017), 2017 IEEE 14th International Symposium on. IEEE, 2017, pp. 737–740. Axer et al., Estimating fiber orientation distribution functions in 3D-polarized light imaging, Frontiers in neuroanatomy, vol. 10, 2016.
Alimi et al., Regularizing the ODF estimate with the Laplace-Beltrami op-erator in 3D Polarized Light Imaging, CoBCoM 2017 - Computational Brain Connectivity Mapping Winter School Workshop, Nov. 2017.
Alimi et al., An analytical fiber odf reconstruction in 3d polarized light imaging, in Biomedical Imaging (ISBI 2018), 2018 IEEE 15th International Symposium on. IEEE, 2018, pp. 1276ˆa–1279.
Dennis M Healy Jr, Harrie Hendriks, and Peter T Kim, Spherical deconvo-lution, Journal of Multivariate Analysis, vol. 67, no. 1, pp. 22, 1998.
Tournier et al., ”Improved probabilistic streamlines tractography by 2nd order integration over fibre orientation distributions,” Proceedings of the Inter-national Society for Magnetic Resonance in Medicine, 2010, 1670
Alimi et al., ”Analytical Fiber Orientations Distribution in 3D-PLI,” Sub-mitted to Medical Image Analysis, 2019
Sachs, Heinrich. Das Hemisphearenmark des menschlichen Grosshirns: Der Hinterhauptlappen. Mit einem Vorwort von C. Wernicke. G. Thieme, 1892.
Vergani, Francesco, et al. ”Intralobar fibres of the occipital lobe: a post mortem dissection study.” Cortex 56 (2014): 145-156.
Tournier et al., 2019. MRtrix3: A fast, flexible and open software framework for medical image processing and visualisation. NeuroImage, p.116137.
Smith, R.E., Tournier, J.D., Calamante, F. and Connelly, A., 2015. SIFT2: Enabling dense quantitative assessment of brain white matter connectivity using streamlines tractography. Neuroimage, 119, pp.338-351.
Sizemore, A.E., Giusti, C., Kahn, A., Vettel, J.M., Betzel, R.F. and Bas-sett, D.S., 2018. Cliques and cavities in the human connectome. Journal of computational neuroscience, 44(1), pp.115-145.
Chung, M.K., Lee, H., Solo, V., Davidson, R.J. and Pollak, S.D., 2017, September. Topological distances between brain networks. In International Workshop on Connectomics in Neuroimaging (pp. 161-170). Springer, Cham.