HAL Id: hal-01011899
https://hal.inria.fr/hal-01011899
Submitted on 16 Sep 2014
HAL is a multi-disciplinary open access
archive for the deposit and dissemination of
sci-entific research documents, whether they are
pub-lished or not. The documents may come from
teaching and research institutions in France or
abroad, or from public or private research centers.
L’archive ouverte pluridisciplinaire HAL, est
destinée au dépôt et à la diffusion de documents
scientifiques de niveau recherche, publiés ou non,
émanant des établissements d’enseignement et de
recherche français ou étrangers, des laboratoires
publics ou privés.
MID: A MetaCASE Tool For A Better Reuse Of Visual
Notations
Amine El Kouhen, Abdelouahed Gherbi, Cedric Dumoulin, Pierre Boulet,
Sébastien Gerard
To cite this version:
Amine El Kouhen, Abdelouahed Gherbi, Cedric Dumoulin, Pierre Boulet, Sébastien Gerard. MID:
A MetaCASE Tool For A Better Reuse Of Visual Notations. 8th System Analysis and Modelling
conference (SAM 2014), Sep 2014, Valencia, Spain. pp.16-31, �10.1007/978-3-319-11743-0_2�.
�hal-01011899�
MID: A MetaCASE Tool for a Better Reuse of
Visual Notations
Amine El Kouhen1, Abdelouahed Gherbi1, C´edric Dumoulin2, Pierre Boulet2,
and S´ebastien Gerard3
1
Software Engineering Dept., ´Ecole de Technologie Sup´erieure, Montr´eal, Canada {amine.elkouhen, abdelouahed.gherbi}@etsmtl.ca
2
University of Lille, LIFL CNRS UMR 8022, Cite scientifique - Batiment M3, Villeneuve d’Ascq, France
{cedric.dumoulin, pierre.boulet}@lifl.fr
3
CEA LIST, Gif-sur-Yvette, France [email protected]
Abstract. Modeling tools facilitate the development process from mod-eling to coding. Such tools can be designed using a Model-Driven ap-proach in metamodeling environments called MetaCASE tools. However, current MetaCASE tools still require, in most cases, manual program-ming to build full tool support for the modeling language. In this paper, we want to specify, using models, diagram editors with a high graphi-cal expressiveness without any need for manual intervention. The second axis is dedicated to the reuse of this specification in other contexts. The redundancy in a diagram editor specification raises the problem of in-consistency during the evolution or the update of this specification. We propose then MID, a tool based on a set of metamodels supporting the easy specification of modeling editors with reusable components. Keywords: Graphical user interface design · Visual languages · Model Reuse · Concrete Syntax · Design Tools
1
Introduction
After the object-oriented paradigm in the 80’s and a brief stint in aspect-oriented approaches, software engineering is moving today towards model-driven engi-neering (MDE), in which the studied system is not seen as a sequence of lines of code but as a set of more abstract models describing each concern or point of view of this system.
The evolution of a paradigm requires the evolution of the tools and lan-guages that support it. We can see then the rise of UML (Unified Modeling Language)[8], which has emerged as the most used modeling language in indus-trial and academic environments.
While models are very widespread, an explicit definition of a modeling lan-guage and an explicit manipulation of its models are closely connected to some specific tools, called Computer-Aided Software Engineering tools, or simply
“CASE tools”. These tools have been very successful in software engineering: they manipulate models to generate code and vice versa (reverse engineering).
The design and generation of such tools can be done either using program-based environments or by applying model-program-based approaches supported by Meta-CASE tools. The intent of MetaMeta-CASE tools is to capture the specification of the required CASE tool and then generate it automatically.
However, many modeling environments still require a considerable amount of manual programming to build diagram editors. Existing MetaCASE tools allow one to specify diagram editors but in a very superficial way. The ergonomics of a generated editor is often not up to expectations. Additional programming effort is required to specify complex forms, manage interactions, edit labels, providing property views, etc. This becomes a problem for developers, who must invest a significant amount of time and other resources to complete tasks considered as secondary to their main purpose: the development and integration of language modeling and code generation.
In addition to manual intervention to specify that kind of tools, several gaps did appear [6,12,17], mainly in terms of their low visual expressiveness and of the limited reuse of their specifications.
To explain these issues, we evaluated the technologies currently used to spec-ify diagram editors [12]. The design of a graphical tool such as Papyrus [7] for example, brings up an important need in terms of diagram definition reuse. The main reason for these gaps is the lack of reusability in this kind of technologies. UML diagrams for example have several common elements, yet these elements are manually duplicated in the specification, thus increasing risks of errors, prob-lems of consistency, redundancy in the specification, and maintenance effort.
At a high level of abstraction, the study of editor specification tools al-lows us to identify some needs and criteria in terms of reusability, graphical completeness, model consistency and maintainability of diagram specifications. Compliance with these criteria led us ultimately to produce an alternative meta-tool based on a set of metamodels called Metamodels for user Interfaces and Diagrams (MID ), to easily design, prototype and evolve graphical editors for a wide range of visual languages. We base MID’s design on two overarching require-ments: graphical expressiveness and simplicity of diagram editor (de)composition for a better reusability. The main goal of this work is the specification of mod-eling tools from reusable, pre-configured components. For that purpose, we take advantage from MDE benefits, component-based modeling, separation of con-cerns and an inheritance mechanism to increase the reuse of editors’ components. In this paper, we present a more comprehensive version of MID metamodels that offers a high visual expressiveness and advanced reuse capabilities.
2
Foundations
The concrete syntaxes (CS) of a language provide users one or more formalisms, graphical and/or textual, to manipulate abstract syntax concepts and thus create instances (i.e., models). Thus, models obtained are conforming to the structure
defined by the abstract syntax (i.e, metamodel). Our proposal is at the level of graphical concrete syntax definition. A key concept of this syntax is the Diagram. In the literature, numerous definitions can be found for the concept of dia-gram. The widely accepted ones include Kosslyn’s [11] and Larkin’s [14]: Dia-grams are an effective medium of human thinking and problem solving. DiaDia-grams are thus bi-dimensional, geometric, symbolic and human-oriented representations of information; they are created by humans for humans. They have little or no value for communicating with computers, whose visual processing capabilities are primitive at best [19].
According to Moody [18], elementary components of a visual representation are called visual notations (visual language, diagramming notations or graphical notations) and consist of a set of graphical symbols (visual vocabulary), a set of compositional / structural rules (visual grammar) and definitions of the meaning of each symbol (semantics). The visual vocabulary and visual grammar form together the concrete (or visual) syntax.
Fig. 1. The nature of a visual notation [18]
Graphical symbols are used to symbolize (perceptually represent) semantic constructs, typically defined by a metamodel. The meanings of graphical symbols are defined by mapping them to the constructs they represent. A valid expres-sion in a visual notation is called a visual sentence or diagram. Diagrams are composed of symbol instances (tokens), arranged according to the rules of the visual grammar [18]. Such distinction between the content (semantics) and the form (syntax: vocabulary and grammar) allows us to separate the different concerns of our proposition. These definitions are illustrated in Fig. 1.
The seminal work in the graphical communication field is Jacques Bertin’s Semiology of Graphics [1]. Bertin identified eight elementary visual variables, which can be used to graphically encode information. These are categorized into planar variables (the two spatial dimensions x,y) and retinal variables (Shape, Color, Size, Brightness, Orientation, Texture). The set of visual variables define a vocabulary for graphical communication: a set of atomic building blocks that can be used to construct any graphical representation. Different visual variables
are suitable for encoding different types of information. The choice of visual variables has a major impact on cognitive effectiveness [3,15,23].
3
Metamodels for user Interfaces and Diagrams (MID)
The aim of our work is to design diagram editors and to allow reusing parts of such design. For that, we propose to use a model-driven approach, to ensure the independence from technology, the ease of maintenance and to enable better sustainability.
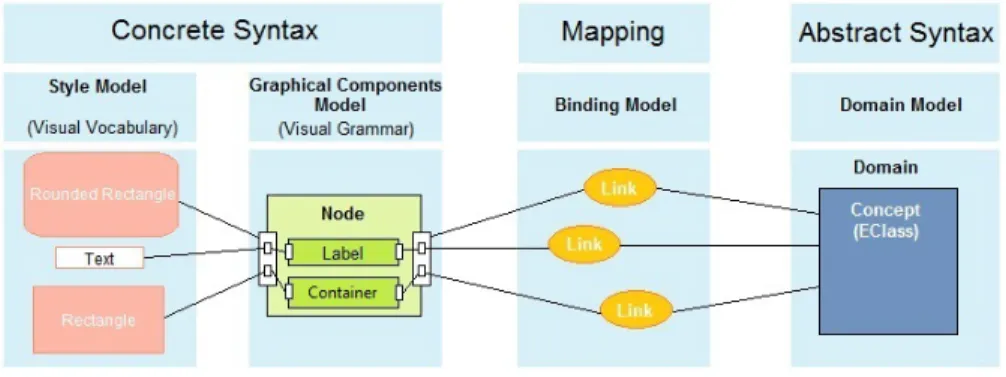
Fig. 2. MID: involved artifacts
Fig. 2 shows the linkage of the metamodels involved in our proposal. First, we separate the domain content (abstract syntax) and the form (visual syn-tax or concrete synsyn-tax) of a diagram at a high level of abstraction (language level). The semantics is out of scope of our paper; it is widely treated in tools and technologies like EMF/Ecore. The form is separated into two parts: the vi-sual vocabulary (different variables of shape, color, size, etc.) and the vivi-sual grammar that describes composition rules of visual representations. The link between the syntax and the semantics is also specified in a separate “binding” model. Thus, our proposal is made of several metamodels, each one used to describe one concern: a visual grammar metamodel, a visual vocabulary meta-model and a mapping metameta-model. This work has resulted in our metameta-models called MID : Metamodels for user Interfaces and Diagrams4.
3.1 Visual Grammar: Graphical Elements Composition
To improve reusability, we propose a component-based approach. This approach aims to take advantage of encapsulation (ease of maintenance and composition) and the benefits of interfacing (interfaces naming mechanism). In addition, our
4
approach allows the reuse through inheritance: a component can inherit from another one and it can also override some of its characteristics (style, structure, behaviors, etc.).
The component concept is the main concept of our set of metamodels. It rep-resents the composition of a visual notation. A component could have three kinds of interfaces: domain interface, style interface and event interface. Interfaces are used as an attachment point between (sub)components and the corresponding concern of each interface (semantics, rendering and interactions). Thus, it helps to improve the maintainability of components by externalizing their descriptions in a unique place.
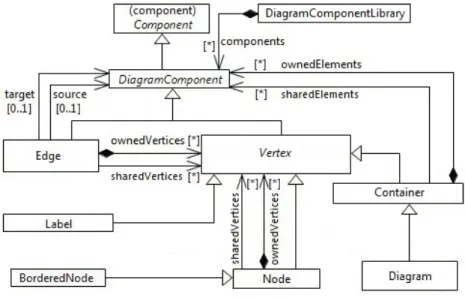
Fig. 3. Diagram grammar
The visual grammar is used to describe the structure of diagrams’ elements. This description is hierarchical: a root element can contain other elements. We propose two main types of elements: vertices to represent diagrams complex elements and edges to represent links between complex elements.
A Vertex is node abstraction that consists of main nodes (top nodes), sub-nodes (contained vertices in Fig. 3) and attached sub-nodes (sub-nodes that can be affixed to other nodes). A Label is a vertex that allows access to nodes textual elements via their accessors (getters and setters). This will synchronize the data model with the text value represented. A Bordered node is a node that can be affixed to other nodes. Containers (Compartments) are specific nodes that contain diagram elements. A Diagram is itself a Container. An Edge is a connection between two diagram elements; this relationship could be specified semantically (in the domain metamodel) or graphically and could be more complex than a simple line (e.g., buses in Fig. 4).
Fig. 4. Bus between two elements
Conceptually, we have added several concepts for a complete description of hybrid visual languages (i.e., languages that combine the characteristics of spacially defined languages, Connection-based or Entity/Relation languages and Containment languages). We can thus describe complex diagrams such as UML sequence and timing diagrams.
3.2 Visual Vocabulary: Visual Variables
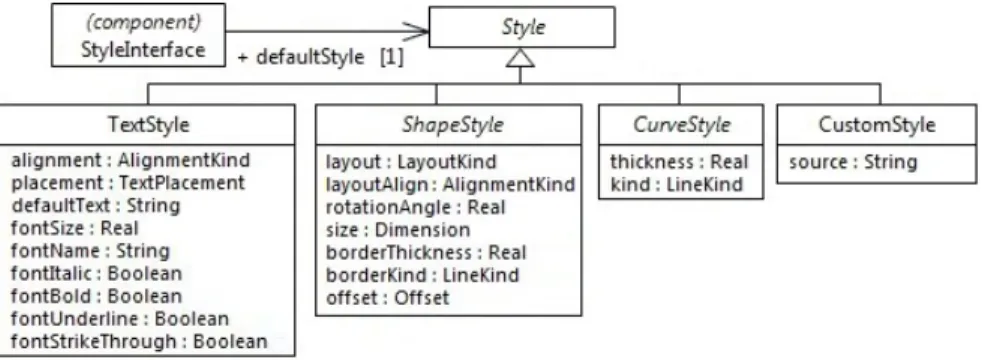
The visual vocabulary allows describing the graphical symbols (visual represen-tation) of diagrams’ elements. This description is composed of Bertin’s [1] visual variables; we regroup all of them in the Style concept (Fig. 5) representing the shape, color, size, layout, etc.
Fig. 5. Visual vocabulary description
All diagram components are associated via their style interfaces to visual vocabularies represented in the metamodel by the Style concept. As other char-acteristics of diagrams elements, this relationship can be reused and overloaded through the proposed mechanism of inheritance.
The style is divided into four main categories. The text style (TextStyle) is a graphical representation that renders a sequence of characters in a box (label). Text styles specify the alignment of the displayed data, positions and information about the size, color and font. The curve style is the graphical definition of a
connection. This is the abstract superclass of all connection styles. It is also possible to create custom styles (CustomStyle) with a code implementation.
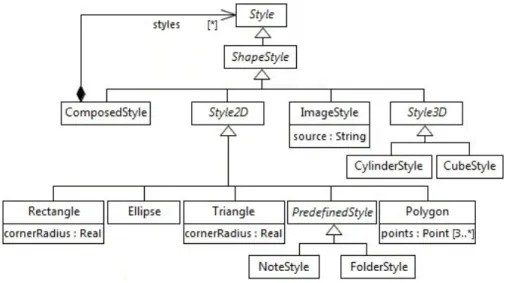
The shape style (ShapeStyle) represents the atomic unit of graphical infor-mation used to construct the shapes of the visual notation. It is characterized by the layout attribute, which represents the different arrangement rules in the host figure. We propose around ten default shapes in our metamodel (Fig. 6), and we let users create their own shapes with polygons, images or more complex shapes (ComposedStyle).
Fig. 6. Shape styles
3.3 CASE Tools (De)Composition
In the current version, the description of bindings with abstract syntax is used as an entry point to the full description of the Diagram editor (Fig. 7).
This is represented by the element DiagramEditor containing all bindings. This concept is associated with a diagram and contains tools such as palette, which allows to create graphical elements into diagrams, menus and properties view, which allows to view/edit the properties of the selected item in the diagram.
3.4 Representation Formalism
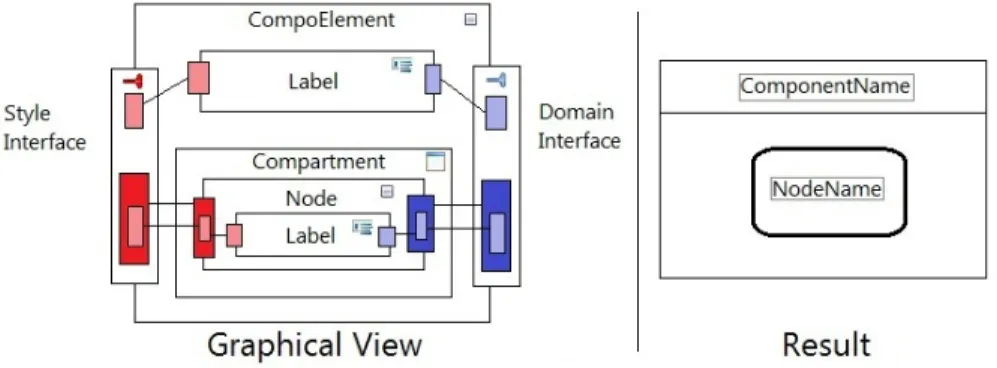
For simplicity, we propose a graphical formalism to present our concepts. This formalism allows to see graphically the diagrams specification instead of a tex-tual or tree-based form. Diagram components are represented as rectangles with interfaces on their borders. Style interfaces are red and domain ones are blue.
Fig. 7. Diagram editor assembling
We have defined our concrete syntax with MID (auto-description), allowing us to propose a modeling tool for our metamodels. Fig. 8 shows an example of a component specification with the graphical view (left side) and its result.
3.5 Inheritance Mechanism
Edges and nodes have both the ability to inherit from each others. When a diagram component inherits from another (Fig. 9), it gets back all its structure, style and behavior.
Fig. 9. MID: graphical inheritance
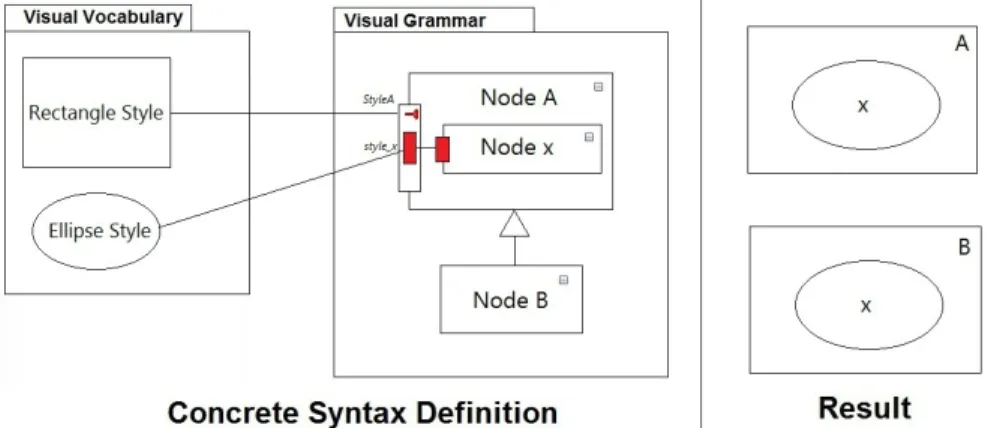
If the inheriting component contains an element with the same name as the inherited component (Fig. 10), this is interpreted by an overload and then we can override the structure, style and behavior. This feature maximizes compo-nents reuse and allows creating other derivatives compocompo-nents. Visual grammar elements only represent the structure and should be associated to a visual vo-cabulary describing its rendering.
Fig. 10 shows the overriding of inherited elements. The component “Node B” inherits from the component “Node A”. Both have sub-components named “Node x”, in this case the element “Node x” of B overrides the description of “Node x” of A (initially represented by an ellipse).
4
Validation
The specification method chosen for our approach is based on models. This approach allows us to benefit from the undeniable advantages of MDE in the editors’ development cycle. These benefits are reflected in multiple aspects, such as ease of specification and technology independence, which allow greater col-laboration and flexibility in the metamodeling cycle of editors.
To validate our metamodels, we have developed several chains of transfor-mations allowing the full generation of designed editors code. Note that MID metamodels are completely independents from technological targets. In the ac-tual implementation, we choose Spray [9] and GMF as technological targets.
4.1 Graphical Expressiveness
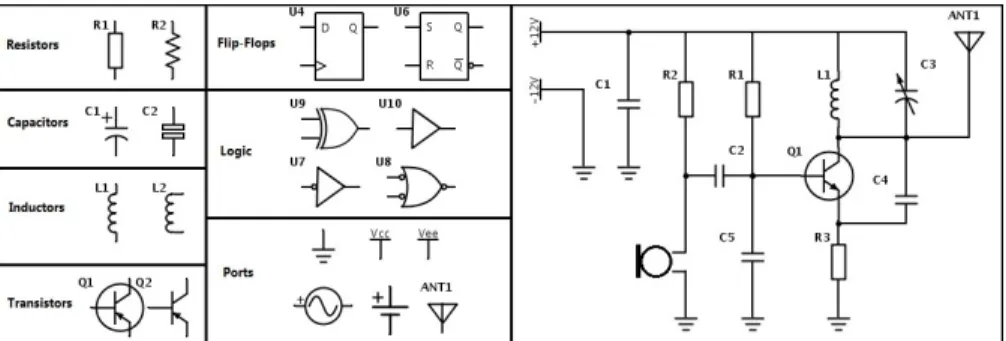
A circuit diagram (also known as electrical diagram) is a simplified conventional graphical representation of an electrical circuit [22]. A circuit diagram shows the components of the circuit as simplified standard symbols (left side of Fig. 11).
Fig. 11. Electrical symbols (left side) and an example of a circuit diagram (right side)
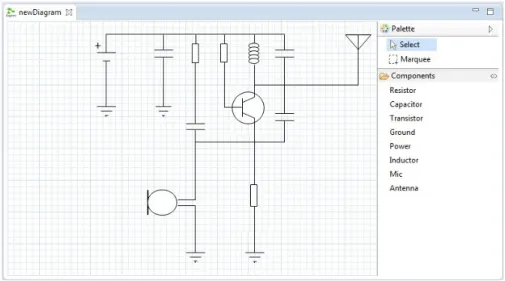
Our goal is to specify editors able to draw and manipulate electrical com-ponents concepts and construct diagrams such as shown in the right part of Fig. 11. Despite its graphical complexity, we could describe this visual language with MID. The result of this specification is shown in Fig. 12.
The graphical completeness is defined by the capability to use fully the shape variable (the use of any kind of shapes: complex, composites, 2D/3D, etc.). Un-like tools we have evaluated in [12], our metamodels have a great capacity to use the full range of these variables; we were inspired by tools based on graph
Fig. 12. Electrical diagram editor generated with MID
grammar and their approaches to define those variables. We have proposed also other representation mechanismes like SVG representations, and other prede-fined figures. We solve some problems identified in existing tools and methods found in the industry and in the literature [6]. For example, we have succeeded to specify diagram editors as complex as circuit diagram editors, at a high level of abstraction, without the need for manual programmatic intervention.
4.2 Reuse of Specification
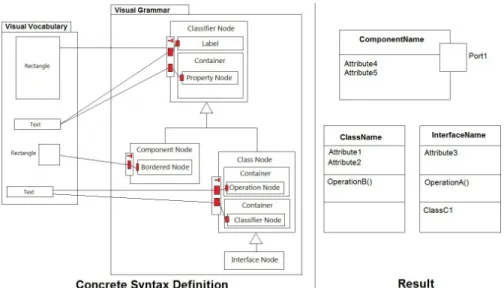
We choose as case study, the reuse between UML concepts, especially Classifiers. The Classifier concept is the basic element of several concepts (Class, Interface, Component, etc.). Such elements have generally the same graphical representa-tion except for a few variarepresenta-tions. They are formed from a rectangular node that contains a label followed by a compartment that contains properties.
Thus, the graphical redundancy in UML can be treated with this mechanism of inheritance. The advantage in terms of the spent time on specification and maintenance is substantially reduced by using reusable graphical elements.
To specify a Component, we have to inherit from Classifier and add to its structure, a border node representing the ports (attached on components bor-ders).
To Specify the graphical elements Class and Interface, we have to inherit from Classifier and add to its structure two other compartments, the first for operations and the other one for nested classifiers (Fig. 13). In this example, and for simplification, the Interface inherits from the graphical definition of the Class to show the graphical similarity between the two concepts. Fig. 14 shows the generated result.
Fig. 13. Reuse of UML graphical elements
Fig. 14. Generated editor for UML
The specification of UML concrete syntax, allows us to evaluate the reuse rate of UML visual notations with MID. Table 1 shows the diagrams specified with MID, the number of visual notations in each diagram and the reuse rate of these notations in each diagram. The rate of reuse is calculated as follows:
UML Reuse Rate = global number of UML notationsnumber of reused notations × 100
Reusability was, since the beginning of our research work, the most impor-tant and desirable criterion. This criterion motivated us to seek methods that allow more reuse of specification models. For this reason, we chose to introduce the concept of component-based metamodeling to specify graphical editors. A component-based approach ensures better readability and better maintenance of models. It is particularly useful for teamwork and allows industrializing
soft-Table 1. Reuse rate of UML notations
Diagram Nbr. of notations Nbr. of reused notations Reuse rate
Class 33 18 54,5% Component 15 8 53,3% Composite Structure 16 14 87,5% Deployment 11 8 72,7% Package 9 9 100% State Machine 16 7 43,7% Activity 16 12 75% Use Case 17 14 82,3% Sequence 16 5 31,2% Communication 5 4 80% Interaction Overview 20 20 100%
UML Reuse Rate 71 %
ware development. Reusability of a component brings significant productivity gain because it reduces development time, especially as the component is reused often.
Unlike existing tools for diagrams specification, we separate the editor’s as-pects and concerns initially between the semantic and graphical asas-pects, then we separate the two graphical aspects, which are the visual vocabulary (visual vari-ables) and the visual grammar that represents the composition rules of diagrams. Subsequently, it becomes important to create another part that would make the mapping between the different aspects, in particular between the semantic and graphic aspects.
The separation of concerns is also carried out in the transformation chain, by introducing several intermediate level models and by delaying the introduc-tion of technical details in the latest models of the chain. This allows for better maintainability of the transformation chain in case of a change/evolution in metamodels. A strong separation of concerns allows a better reuse and mainte-nance of models, it decreases development costs in terms of maintemainte-nance time in case of changes in these models and it should allow designing new applica-tions by assembling existing models. It also allows to reuse a complete diagram description in another domain model.
Through the examples presented in this sub-section, we validated our ap-proach in terms of reusability. This apap-proach allowed us to reuse more than 70% of components created in our UML specification, which is not negligible. This approach allowed us to define easily the editors’ specificities with a model-driven approach and without any need to redefine or manually program changes, which increases the level of maintainability of editors generated with our solu-tion.
Furthermore, we evaluated the reuse rate for other existing approaches: we found that our proposal offers a reuse rate much higher than the other ones. Table 2 shows the UML reuse rate with the other approaches.
Table 2. UML reuse rates for the other tools Tool UML Reuse Rate MetaEdit+ 46,9 %
GMF 52,3 %
Obeo Designer 34,8 % Spray/Graphiti 64 %
MID 71 %
Practically, when we developed the Papyrus UML modeler [7], we tried all existing frameworks including GMF, Graphiti, Sirius and other approaches such as those of Bottoni and Costagliola [2]. All of them are limited to design Entity/Relation-like languages and no more. These tools have been widely dis-cussed and compared with our approach in [6,12,17].
Tools based on graph grammars (e.g., AT oM3[13] and DiaGen [16]) provide visual separation between visual vocabulary and visual grammar. However, to define a visual language, developers must invest significant effort to analyze and identify all rules [5].
In [4], the authors propose a tool called VLDesK, which is based on compo-nents for specifying visual languages. However, this approach is suffering from several limitations. Using a textual description to define components, this ap-proach rises an additional cost to learn and write the implementation of each component. Users are soon confronted to the difficulty of components mainte-nance. In addition, users of this tool require specific skills: a good understanding of the Extended Positional Grammars [5] and of YACC [10].
Most diagrams specification methods mix concerns. The common form of mixing is between the visual vocabulary and visual grammar definitions. Most of the tools offering the separation of the graphical part from the semantic one, like GMF tooling, TopCased-Meta and even standards like Diagram Definition [20], fail to separate the two graphical syntax concerns, which are visual vocabulary (shapes, colors, styles, etc.) and visual grammar (composition rules of the visual notation).
5
Conclusion
In this article, we present an approach based on MDE and components modeling, allowing the easy specification of diagram graphical editors at a high level of ab-straction, in order to model, reuse, compose and generate code. In our proposal, we focus on the component concept, to describe and then assemble concepts emerging from visual languages. We first solved some major problems identified in existing tools and methods found in industry and in the literature, such as the specification at a high level of abstraction without the need for manual program-matic intervention, the separation of concerns, the graphical effectiveness and finally the reusability of editors. To validate our approach, we have developed transformation chains targeting technologies like GMF and Spray, which enable
the generation of functional editor’s code. This allows us to successfully design diagrams by reusing existing components, and to generate their implementation. We validated our approach on several diagrams.
Our approach presents many advantages. Firstly, through the reuse of mod-els: the models are theoretically easier to understand and to manipulate by business users; which corresponds to a goal of MDE. Secondly, this reuse brings considerable gains of productivity through ease of maintenance of components. It also allows better teamwork and helps for the industrialization of software de-velopment; it becomes possible to build libraries of components, and then build the diagram by assembling these components.
Briefly, we can say that our approach opens a new way that shows promises for a wider use of modeling tools and automatic generation of applications. Compared to the current development technologies, the promises of this ap-proach are high due to the ability to create complex applications by assembling existing simple model/components fragments, and especially the possibility for non-computer specialists, experts in their business domain, to create their own applications from a high-level description using an adapted formalism, easy to understand and manipulate for them.
In the current state of our research, many studies are still required to reach a full generation of modeling tools. Firstly, we need to be able to describe and generate ergonomic aspects and interactions with our approach. We can thus use task models [21] to specify user interactions regardless of the modality or implementation technologies. Finally, we need to define other metamodels that would allow describing the other parts of such tools (tree editors, tables/matrices, etc.) following the same approach of component reuse and inheritance.
Acknowledgements. This work was supported by the LIST laboratory of the French Atomic Commission (CEA). This work has also been supported by the Natural Sciences and Engineering Research Council of Canada (NSERC) and the Fond de l’Internationalisation de la Recherche (FIR) - Bureau de Coordination Internationale (BCI) of the ´Ecole de Technologie Sup´erieure ( ´ETS).
References
1. Bertin, J.: Semiology of graphics : diagrams, networks, maps. University of Wis-consin Press, Madison, USA (1983)
2. Bottoni, P., Costagliola, G.: On the definition of visual languages and their editors. In: Hegarty, M., Meyer, B., Narayanan, N. (eds.) Diagrammatic Representation and Inference, LNCS, vol. 2317, pp. 305–319. Springer Berlin Heidelberg (2002) 3. Cleveland, W.S., McGill, R.: Graphical perception: Theory, experimentation, and
application to the development of graphical methods. Journal of the American Statistical Association 79(387), 531–554 (1984)
4. Costagliola, G., Francese, R., Risi, M., Scanniello, G., De Lucia, A.: A component-based visual environment development process. In: SEKE ’02. pp. 327–334. ACM, New York, NY, USA (2002)
5. Costagliola, G., Deufemia, V., Polese, G.: A framework for modeling and imple-menting visual notations with applications to software engineering. ACM Trans. Softw. Eng. Methodol. 13(4), 431–487 (2004)
6. El Kouhen, A.: Sp´ecification d’un m´etamod`ele pour l’adaptation des outils UML. Ph.D. thesis, Universit´e de Lille 1, France (2013)
7. G´erard, S., Dumoulin, C., Tessier, P., Selic, B.: Papyrus: A UML2 tool for domain-specific language modeling. In: Giese, H., Karsai, G., Lee, E., Rumpe, B., Schatz, B. (eds.) Model-Based Engineering of Embedded Real-Time Systems, LNCS, vol. 6100, pp. 361–368. Springer Berlin Heidelberg (2010)
8. Group, O.M.: Unified modeling language 2.5 (2013), http://www.omg.org/spec/ UML/2.5/Beta2/
9. Itemis: A quick way of creating graphiti (2012), http://code.google.com/a/ eclipselabs.org/p/spray
10. Johnson, S.C.: Yacc: Yet another compiler-compiler. Tech. rep., AT&T Corporation (1970)
11. Kosslyn, S.M.: Image and Mind. Harvard University Press (1980)
12. Kouhen, A.E., Dumoulin, C., G´erard, S., Boulet, P.: Evaluation of modeling tools adaptation. Tech. rep., CNRS (2011), http://hal.archives-ouvertes.fr/ hal-00706701
13. Lara, J., Vangheluwe, H.: Atom3: A tool for multi-formalism and meta-modelling. In: Kutsche, R.D., Weber, H. (eds.) Fundamental Approaches to Software Engi-neering, LNCS, vol. 2306, pp. 174–188. Springer Berlin Heidelberg (2002) 14. Larkin, J.H., Simon, H.A.: Why a diagram is (sometimes) worth ten thousand
words. Cognitive Science 11(1), 65–100 (1987)
15. Lohse, G.L.: A cognitive model for understanding graphical perception. Hum.-Comput. Interact. 8(4), 353–388 (Dec 1993)
16. Minas, M., Viehstaedt, G.: Diagen: A generator for diagram editors providing direct manipulation and execution of diagrams. In: 11th Int. IEEE Symp on Visual Languages. pp. 203–210. IEEE CS, USA (1995)
17. Mohagheghi, P., Haugen, Ø.: Evaluating domain-specific modelling solutions. In: Trujillo, J., Dobbie, G., Kangassalo, H., Hartmann, S., Kirchberg, M., Rossi, M., Reinhartz-Berger, I., Zimanyi, E., Frasincar, F. (eds.) Advances in Conceptual Modeling - Applications and Challenges, LNCS, vol. 6413, pp. 212–221. Springer Berlin Heidelberg (2010)
18. Moody, D.: The “physics” of notations: Toward a scientific basis for constructing visual notations in software engineering. IEEE Trans. Softw. Eng. 35(6), 756–779 (Nov 2009)
19. Moody, D., van Hillegersberg, J.: Evaluating the visual syntax of UML: An analysis of the cognitive effectiveness of the UML family of diagrams. In: Gasevic, D., Lammel, R., Van Wyk, E. (eds.) Software Language Engineering, LNCS, vol. 5452, pp. 16–34. Springer Berlin Heidelberg (2009)
20. OMG: Diagram definition 1.0 (2012), http://www.omg.org/spec/DD/
21. Rich, C.: Building task-based user interfaces with ansi/cea-2018. Computer 42(8), 20–27 (2009)
22. Wikipedia: Circuit diagram (2013), http://bit.ly/1mVvwMI
23. Winn, W.: Learning from maps and diagrams. Educational Psychology Review 3, 211–247 (1991)
![Fig. 1. The nature of a visual notation [18]](https://thumb-eu.123doks.com/thumbv2/123doknet/12919100.373173/4.918.217.718.487.653/fig-nature-visual-notation.webp)