HAL Id: hal-03154585
https://hal.sorbonne-universite.fr/hal-03154585
Submitted on 1 Mar 2021
HAL is a multi-disciplinary open access
archive for the deposit and dissemination of
sci-entific research documents, whether they are
pub-lished or not. The documents may come from
teaching and research institutions in France or
abroad, or from public or private research centers.
L’archive ouverte pluridisciplinaire HAL, est
destinée au dépôt et à la diffusion de documents
scientifiques de niveau recherche, publiés ou non,
émanant des établissements d’enseignement et de
recherche français ou étrangers, des laboratoires
publics ou privés.
Plasma neurofilament light chain predicts cerebellar
atrophy and clinical progression in spinocerebellar ataxia
Giulia Coarelli, Frédéric Darios, Emilien Petit, Karim Dorgham, Isaac
Adanyeguh, Elodie Petit, Alexis Brice, Fanny Mochel, Alexandra Durr
To cite this version:
Giulia Coarelli, Frédéric Darios, Emilien Petit, Karim Dorgham, Isaac Adanyeguh, et al.. Plasma
neurofilament light chain predicts cerebellar atrophy and clinical progression in spinocerebellar ataxia.
Neurobiology of Disease, Elsevier, 2021, 153, pp.105311. �10.1016/j.nbd.2021.105311�. �hal-03154585�
Neurobiology of Disease 153 (2021) 105311
Available online 23 February 2021
0969-9961/© 2021 The Author(s). Published by Elsevier Inc. This is an open access article under the CC BY-NC-ND license
(http://creativecommons.org/licenses/by-nc-nd/4.0/).
Plasma neurofilament light chain predicts cerebellar atrophy and clinical
progression in spinocerebellar ataxia
Giulia Coarelli
a,b, Frederic Darios
a, Emilien Petit
a, Karim Dorgham
c, Isaac Adanyeguh
a,
Elodie Petit
a,b, Alexis Brice
a, Fanny Mochel
a,b, Alexandra Durr
a,b,*aSorbonne Universit´e, ICM (Paris Brain Institute), AP-HP, INSERM, CNRS, University Hospital Piti´e-Salpˆetri`ere, Paris, France bAPHP Department of Genetics, Piti´e-Salpˆetri`ere University Hospital, Paris, France
cSorbonne Universit´e, INSERM, CNRS, Centre d’Immunologie et des Maladies Infectieuses-Paris (CIMI-Paris), F-75013 Paris, France
A R T I C L E I N F O
Keywords:
Spinocerebellar ataxias Neurofilament light chain Volumetric MRI Biomarker Cerebellum
A B S T R A C T
Neurofilament light chain (NfL) is a marker of brain atrophy and predictor of disease progression in rare diseases such as Huntington Disease, but also in more common neurological disorders such as Alzheimer’s disease. The aim of this study was to measure NfL longitudinally in autosomal dominant spinocerebellar ataxias (SCAs) and establish correlation with clinical and imaging parameters. We enrolled 62 pathological expansions carriers (17 SCA1, 13 SCA2, 19 SCA3, and 13 SCA7) and 19 age-matched controls in a prospective biomarker study between 2011 and 2015 and followed for 24 months at the Paris Brain Institute. We performed neurological examination, brain 3 T MRI and plasma NfL measurements using an ultrasensitive single-molecule array at baseline and at the two-year follow-up visit. We evaluated NfL correlations with ages, CAG repeat sizes, clinical scores and volu-metric brain MRIs. NfL levels were significantly higher in SCAs than controls at both time points (p < 0.001). Age-adjusted NfL levels were significantly correlated at baseline with clinical scores (p < 0.01). We identified optimal NfL cut-off concentrations to differentiate controls from carriers for each genotype (SCA1 16.87 pg/mL, SCA2, 19.1 pg/mL, SCA3 16.04 pg/mL, SCA7 16.67 pg/mL). For all SCAs, NfL concentration was stable over two years (p = 0.95) despite a clinical progression (p < 0.0001). Clinical progression between baseline and follow-up was associated with higher NfL concentrations at baseline (p = 0.04). Of note, all premanifest carriers with NfL levels close to cut off concentrations had signs of the disease at follow-up. For all SCAs, the higher the observed NfL, the lower the pons volume at baseline (p < 0.01) and follow-up (p = 0.02). Higher NfL levels at baseline in all SCAs predicted a decrease in cerebellar volume (p = 0.03). This result remained significant for SCA2 only among all genotypes (p = 0.02). Overall, plasma NfL levels at baseline in SCA expansion carriers predict cere-bellar volume change and clinical score progression. NfL levels might help refine inclusion criteria for clinical trials in carriers with very subtle signs.
1. Introduction
Interest in neurofilament light chain (NfL) has intensified in recent years due to mounting evidence that the level found in blood can serve as a biomarker for severity in neurological disorders (Gaetani et al., 2019; Bridel et al., 2019; Khalil, 2018). NfL is a subunit of the neuronal cytoskeleton and axonal damage provokes its release into cerebrospinal fluid (CSF) and blood (Gaetani et al., 2019). NfL concentrations in CSF
and blood are closely correlated, making it an easily measurable biomarker of neurodegeneration (Gaetani et al., 2019; Khalil, 2018). In several neurological diseases, NfL levels have been confirmed to be greater than in controls (Gaetani et al., 2019; Bridel et al., 2019; Khalil, 2018). NfL levels correlate with clinical scores, disease progression, and brain imaging in diseases such as amyotrophic lateral sclerosis (ALS) (Lu et al., 2015; Benatar et al., 2018), Alzheimer’s disease (Mattsson et al., 2019; Benedet et al., 2020; Preische et al., 2019), and multiple sclerosis
Abbreviations: ALS, amyotrophic lateral sclerosis; ASOs, antisense oligonucleotides; AUC, area under the curve; CCFS, composite cerebellar functional severity
score; CSF, cerebrospinal fluid; HD, Huntington disease; NfL, neurofilament light chain; PolyQ, polyglutamine; ROC, Receiver operating characteristics; SARA, scale for the assessment and rating of ataxia; SCA, spinocerebellar ataxia.
* Corresponding author at: Paris Brain Institute, Piti´e-Salpˆetri`ere Paris CS21414, 75646 Paris, Cedex 13, France.
E-mail address: alexandra.durr@icm-institute.org (A. Durr).
Contents lists available at ScienceDirect
Neurobiology of Disease
journal homepage: www.elsevier.com/locate/ynbdi
https://doi.org/10.1016/j.nbd.2021.105311
Neurobiology of Disease 153 (2021) 105311
2 (Bjornevik et al., 2020; Kuhle et al., 2019). Moreover, Nfl dosage can help in the differential diagnosis of Parkinson’s disease and atypical parkinsonian disorders (Hansson et al., 2017; Herbert et al., 2015; Hall et al., 2012). In inherited conditions, such as Huntington Disease, where pathological allele carriers can be identified before the onset of symp-toms, NfL has been shown to increase significantly when carriers come close to the age at expected disease onset (Scahill et al., 2020). Loss of volume in cerebral regions known to be affected in Huntington Disease, such as the caudate and putamen, were associated with higher NfL in plasma (Johnson et al., 2018). Higher NfL predicted subsequent occip-ital and white matter atrophy longitudinally (Johnson et al., 2018). Polyglutamine spinocerebellar ataxias (polyQ SCAs) share the same mutational mechanism with Huntington disease, a translated patho-logical CAG repeat expansion. For Huntington disease, there are tar-geted biomarkers, such as mutant huntingtin protein in CSF (Wild et al., 2015) for monitoring drug effects, or NfL as a prognostic blood biomarker of disease onset and progression (Byrne et al., 2017). Prom-ising biomarkers for polyQ SCAs are being identified, as NfL (Wilke et al., 2018a), oxidative stress biomarkers (de Assis et al., 2017), ataxin- specific bioassays (Gonsior et al., 2020), and carboxy-terminus of Hsc70-interacting protein (CHIP) (Zhang et al., 2020). For both of these diseases, antisense oligonucleotides (ASOs) are in development. Research is more advanced for Huntington disease with phase 3 clinical trial (NCT03761849) as well as in an allele specific ASOs phase 1b/2a trial (NCT03225833). In SCAs, ASOs injections have shown encouraging results in SCA1 (Friedrich et al., 2018), SCA2 (Scoles et al., 2017), SCA3 (Moore et al., 2017; McLoughlin et al., 2018), and SCA7 (Niu et al., 2018) mouse models.
In the current study, we aimed to investigate whether blood NfL behaved similarly in various autosomal dominant ataxias. In a pilot study including 20 participants from families with dominant spinocer-ebellar ataxias (SCA1, SCA2, SCA3, SCA6) elevated Nfl has been found (Wilke et al., 2018a). Three studies with large cohorts including SCA3 carriers showed NfL as a biomarker reflecting clinical state (Li et al., 2019; Wilke et al., 2020; Peng et al., 2020). We compared NfL levels from SCA1, SCA2, SCA3 and SCA7 carriers and healthy controls at baseline and a two-year follow-up visit. We also explored NfL correla-tions with clinical and brain imaging parameters.
2. Methods
We recruited 62 carriers of polyglutamine (polyQ) SCA (17 SCA1, 13 SCA2, 19 SCA3, and 13 SCA7) and 19 age-matched controls, from the French National Reference Center for Rare Diseases “Neurogenetics” in Paris, Piti´e-Salpˆetri`ere Hospital, between 2011 and 2015 as a part of the BIOSCA study (NCT01470729). The repeat length of the expanded and normal alleles was available for all SCA carriers. We assessed SCA car-riers and controls by neurological examination, brain MRI, and NfL measurements at baseline and after two years. We used the scale for the assessment and rating of ataxia (SARA, max. value 40) (Schmitz-Hübsch et al., 2006) and the composite cerebellar functional severity score (CCFS) (du Montcel et al., 2008) to evaluate cerebellar syndrome. Pre-manifest carriers were considered to be those carriers of the pathological expansion without cerebellar signs, i.e. SARA score of <3 (Schmitz- Hübsch et al., 2006). Brain 3D T1-weighted magnetization-prepared rapid gradient-echo (MPRAGE) image (TR =2530 ms, TE =3.65 ms,
TI =900 ms, flip angle = 9o, 1 mm isotropic, field of view (FOV) = 256 ×256 mm2) was acquired for 15 SCA1, 12 SCA2, 18 SCA3, 10 SCA7 carriers and 18 controls on a 3 T Siemens Trio scanner using a standard Siemens volume-transmit 32-channel receive coil array. Brain volu-metric assessments of the cerebellum and pons were performed using Freesurfer, as previously described (Adanyeguh et al., 2018). To mea-sure NfL, we collected fasted plasma samples using EDTA sample tube anticoagulant, frozen at − 80 ◦C after collection, and stored in the local
biobank. Plasma NfL levels were measured in duplicate using an ultra- sensitive single molecule array on the Simoa HD-1 Analyzer
(Quanterix), as previously established (Kuhle et al., 2016).
We compared clinical data, NfL levels, and volumes of the cere-bellum and the pons between SCA populations and a control group at baseline and follow-up. We also compared NfL levels between each SCA genotype and the control group at baseline and follow-up. For each group, we analyzed the correlation between NfL levels and age at sam-pling, SARA score, CCFS, and volumetric brain MRI and, for SCA carriers only; correlations between pathological CAG repeat size and NfL and age at disease onset. We also investigated the difference between NfL level at follow-up and baseline (∆NfL) for each group.
2.1. Standard protocol approvals, registrations, and patient consents
Local ethics committee (AOM10094, CPP Ile de France VI, Ref:105–10) approved the study. All participants agreed and signed a written informed consent form prior to participation in the study.
2.2. Statistical analysis
Statistical analyses were performed using SAS software. Data are expressed as the mean ± standard deviation (SD) or frequency (n). Qualitative variables were compared between groups using Fischer’s exact test and quantitative variables using non-parametric Kruskal- Wallis test, followed by a post-hoc Dunn pairwise test when necessary, with a Holm adjustment for multiple comparisons. Wilcoxon-Mann- Whitney test was used to assess the significance of the variation in clinical scores and NfL levels between baseline and follow-up. Pearson’s correlation was performed between NfL levels and the volume of the cerebellum and pons using a step-down Bonferroni multiple correction. All correlations were adjusted for age and CAG repeat expansion. For each individual, the variation of clinical scores and volumetry between baseline and follow-up was computed. Using a linear model, we modeled these variations with the predictors: NfL, age, and the inter-action between both. CAG repeat expansion was added as a covariable when considering the SCA subtype separately. The estimate of the NfL’s effect (β) is expressed in variation of the value of SARA score, CCFS and pons and cerebellum volume by pg/mL NfL concentration at baseline. Optimal cut-off values used to differentiate SCA symptomatic subjects from controls were determined using the Youden’s procedure.
3. Results
3.1. Clinical characteristics and NfL correlations
NfL levels were significantly higher in SCA expansion carriers than in controls (27.25 ± 12.16 pg/mL vs 10.24 ± 4.48 pg/mL, p < 0.001),
Fig. 1A, allowing for the differentiation of the two groups with high accuracy (AUC = 0.95 (0.9–0.99), p < 0.001, optimal cut-off at 16.04 pg/mL NfL, with 88% sensitivity and 95% specificity), Fig. 1C. NfL levels significantly correlated with age (baseline, r = 0.72, p < 0.001 and follow-up, r = 0.61, p < 0.01) in controls but not in SCA carriers (Table 1).
Across SCA groups, age at disease onset (p = 0.27), age at exami-nation (p = 0.52), disease duration (p = 0.15), SARA scores (baseline, p =0.3; follow-up p = 0.5), and CCFS (baseline, p = 0.31; follow-up p = 0.75) were similar (Table 2). As expected, pathological CAG repeat sizes showed a negative correlation with age at disease onset for each SCA group (SCA1 r = − 0.929, p < 0.001; SCA2 r = − 0.696, p < 0.01; SCA3 r = − 0.701, p < 0.01; SCA7 r = − 0.89, p < 0.001). For all SCAs, the SARA score significantly increased by 2.24 in 2 years (12.16 ± 6.93 at baseline to 14.4 ± 7.75 at follow-up, p < 0.0001). For each genotype the SARA score was significantly higher at follow-up (10.67 ± 6.23 vs 13.14 ± 7.02 for SCA1, p < 0.001; 13.26 ± 6.16 vs 15.38 ± 6.92 for SCA2, p = 0.01; 14.1 ± 7.26 vs 16.13 ± 7.48 for SCA3, p = 0.02; 10.15 ± 7.79 vs 12.53 ± 9.79 for SCA7, p = 0.03), with the largest increase for SCA1 (2.47/2 years) and the smallest for SCA3 (2.03/2 years), Table 2. In G. Coarelli et al.
addition, at follow-up, CCFS worsened in the SCA group (1.06 ± 0.13 vs 1.09 ± 0.16, p < 0.001), but when considering each genotype individ-ually the progression was significant only for SCA3 (1.03 ± 0.1 vs 1.08
±0.12, p < 0.01) and SCA7 (1.05 ± 0.18 vs 1.1 ± 0.22, p = 0.02). In controls, no progression was found for SARA score (1.05 ± 1.12 vs 0.76 ±0.69, p = 0.3) and CCFS (0.86 ± 0.05 vs 0.84 ± 0.04, p = 0.26),
Fig. 1. Plasma NfL concentrations and ROC curves differentiating SCAs carriers from controls.
A. NfL concentrations (pg/mL) at baseline were significantly different between controls and each SCA group. NfL levels in SCA3 were significantly higher than SCA1, SCA2 and SCA7. B. NfL concentrations (pg/mL) at two-year follow-up were significantly different between controls and each SCA group. SCA3 NfL levels were significantly higher than SCA1 and SCA2, but not SCA7. C. Receiver operating characteristics (ROC) curves at baseline showed the sensitivity and the specificity of plasma NfL to differentiate symptomatic SCA carriers and controls, AUC = 0.95 (0.9–0.99), p < 0.001, optimal cut-off: 16.04 pg/mL, 88% sensitivity, 95% specificity; D. ROC curve for symptomatic SCA1 carriers at baseline, AUC = 0.94 (0.88–1), p < 0.001, optimal cut-off: 16.87 pg/mL, 87% sensitivity, 95% specificity; E. ROC curve for SCA2 patients at baseline, AUC = 0.89 (0.78–1), p < 0.001, optimal cut-off: 19.1 pg/mL, 69% sensitivity, 95% specificity; F. ROC curve for symptomatic SCA3 carriers at baseline, AUC = 0.99 (0.97–1), p < 0.001, optimal cut-off: 16.04 pg/mL, 100% sensitivity, 95% specificity; G. ROC curve for symptomatic SCA7 carriers at baseline, AUC = 0.95 (0.88–1), p < 0.001, optimal cut-off: 16.67 pg/mL, 92 sensitivity, 95% specificity.
In the graph A and B, the boxes show upper and lower quartiles, horizontal lines in the boxes show median, and bar shows ranges. The point in the graph B for control group represents an outlier. * p < 0.05; ** p < 0.01; *** p < 0.001; ns: non significant.
Table 1
Correlation between plasma NfL concentrations and clinical and radiological characteristics in SCA carriers and controls.
Controls
(n = 19) SCAs (n = 62) SCA1 (n = 17) SCA2 (n = 13) SCA3 (n = 19) SCA7 (n = 13)
r p r p r p r p r p r p Age V1 0.72 <0.001 −0.14 0.25 −0.23 0.37 ¡0.58 0.03 − 0.33 0.16 −0.15 0.62 Age V2 0.61 <0.01 −0.06 0.59 −0.16 0.53 − 0.53 0.06 − 0.21 0.36 0.02 0.94 Disease duration V1 – – 0.24 0.06 0.22 0.43 0.1 0.74 0.57 0.02 0.1 0.78 Disease duration V2 – – 0.18 0.17 0.38 0.17 0.001 0.99 0.45 0.07 −0.12 0.75 SARA V1 0.18 0.46 0.52 <0.001 0.25 0.35 0.32 0.32 0.76 <0.001 0.33 0.30 SARA V2 −0.25 0.3 0.48 <0.001 0.36 0.18 − 0.01 0.96 0.47 0.05 0.40 0.21 CCFS V1 0.27 0.26 0.36 <0.01 0.36 0.17 0.17 0.60 0.59 0.01 0.13 0.68 CCFS V2 0.15 0.53 0.34 <0.01 0.38 0.15 − 0.06 0.84 0.22 0.39 0.30 0.36 CAG V1 – – – – 0.52 0.03 0.14 0.66 0.22 0.05 0.93 <0.001 CAG V2 – – – – 0.44 0.08 0.19 0.54 0.37 0.82 0.85 <0.001 Cerebellar volume V1 0.10 0.69 −0.18 0.18 −0.45 0.12 − 0.23 0.50 − 0.43 0.09 −0.43 0.28 Cerebellar volume V2 0.01 0.95 −0.13 0.33 −0.49 0.08 − 0.18 0.60 − 0.08 0.74 −0.42 0.29 Cerebellum volume change −0.22 0.39 ¡0.29 0.03 −0.4 0.17 ¡0.68 0.02 − 0.26 0.34 −0.01 0.98 Pons volume V1 −0.02 0.93 ¡0.35 <0.01 −0.26 0.37 − 0.55 0.09 ¡0.71 0.001 −0.65 0.08 Pons volume V2 −0.07 0.78 ¡0.30 0.02 −0.30 0.31 − 0.37 0.29 − 0.47 0.06 −0.56 0.14
Abbreviations: CCFS: composite cerebellar functional severity scale, NfL: neurofilament light chain, SARA: scale for the assessment and rating of ataxia, SCA: spi-nocerebellar ataxia, V1: baseline, V2: two-year follow-up. Significant values are in bold.
Neurobiology of Disease 153 (2021) 105311
4
Table 2.
Age-adjusted NfL levels for all SCAs were significantly correlated at baseline with SARA score (r = 0.52, p < 0.001) and CCFS (r = 0.36, p < 0.01), Table 1. In SCA population, the correlation between age-adjusted NfL levels with the SARA score and CCFS was confirmed at the two-year follow-up (r = 0.48, p < 0.01 and r = 0.34, p < 0.01, respectively),
Table 1. The increase of SARA scores between baseline and follow-up was associated with higher NfL concentrations at baseline (β = 0.07 ±0.03, p = 0.04). No correlation was found between NfL levels and disease duration (baseline, r = 0.24, p = 0.06; follow-up, r = 0.18, p = 0.17), Table 1.
At baseline, SCA3 had the highest NfL level among all subtypes, 34.92 ± 10.5 pg/mL, significantly greater than SCA1 (24.79 ± 11.08 pg/ mL, p = 0.03), SCA2 (20.28 ± 6.28 pg/mL, p < 0.01) and with the tendency to be higher than SCA7 (26.25 ± 15.1, p = 0.07), Fig. 1A. These results were confirmed at follow-up (Fig. 1B). SCA3 was also found to have the most accurate pathological cut-off level, at 16.04 pg/ mL, with 100% sensitivity and 95% specificity, AUC = 0.99 (0.97–1) p
< 0.001, as shown in Fig. 1F, compared to SCA1 (Fig. 1D), SCA2
(Fig. 1E), and SCA7 (Fig. 1G). For SCA3, at baseline, NfL levels corrected for age and CAG repeat size, correlated with clinical scores (SARA, r = 0.76, p < 0.001; CCFS, r = 0.59, p = 0.01) and disease duration (r = 0.57, p = 0.02), Table 1. The tendency for correlation between NfL and SARA score persisted at the two-year follow-up (r = 0.47, p = 0.05) but not for CCFS (r = 0.22, p = 0.39) and disease duration (r = 0.45, p = 0.07), Table 1. Correlation between NfL levels at baseline and CAG repeat size was found for SCA1 and SCA7 (r = 0.52, p = 0.03 and r = 0.93, p ≤0.001), Table 1 and Fig. 2, but not for SCA2 and SCA3 (r = 0.14,
p = 0.66 and r = 0.22 and p = 0.05), Table 1. For SCA7, the increase of
CCFS between baseline and follow-up (1.05 ± 0.18 vs 1.1 ± 0.22, p = 0.02, Table 2) was associated with greater NfL concentrations at base-line (β = 0.007 ± 0.003, p = 0.04), and the correlation with CAG repeat
Table 2
Comparison of clinical data and plasma NfL levels between the SCA population and control group.
Baseline 2-year follow-up Age at onset
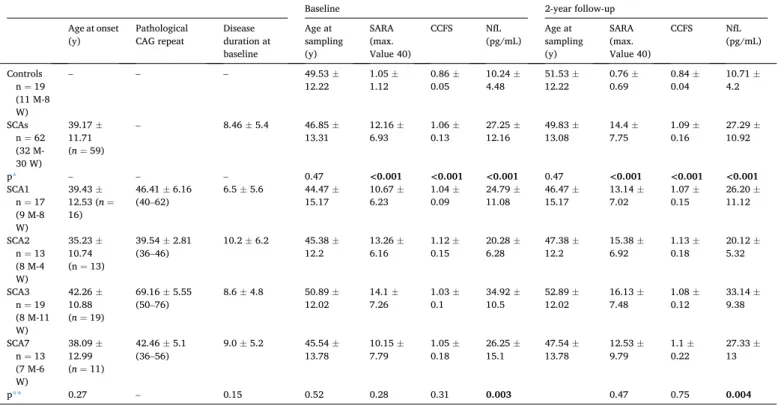
(y) Pathological CAG repeat Disease duration at baseline Age at sampling (y) SARA (max. Value 40) CCFS NfL (pg/mL) Age at sampling (y) SARA (max. Value 40) CCFS NfL (pg/mL) Controls n = 19 (11 M-8 W) – – – 49.53 ± 12.22 1.05 ±1.12 0.86 ±0.05 10.24 ±4.48 51.53 ±12.22 0.76 ±0.69 0.84 ±0.04 10.71 ±4.2 SCAs n = 62 (32 M- 30 W) 39.17 ± 11.71 (n = 59) – 8.46 ± 5.4 46.85 ± 13.31 12.16 ±6.93 1.06 ±0.13 27.25 ±12.16 49.83 ±13.08 14.4 ±7.75 1.09 ±0.16 27.29 ±10.92 p* – – – 0.47 <0.001 <0.001 <0.001 0.47 <0.001 <0.001 <0.001 SCA1 n = 17 (9 M-8 W) 39.43 ± 12.53 (n = 16) 46.41 ± 6.16 (40–62) 6.5 ± 5.6 44.47 ±15.17 10.67 ±6.23 1.04 ±0.09 11.08 24.79 ± 46.47 ±15.17 13.14 ±7.02 1.07 ±0.15 26.20 ±11.12 SCA2 n = 13 (8 M-4 W) 35.23 ± 10.74 (n = 13) 39.54 ± 2.81 (36–46) 10.2 ± 6.2 45.38 ±12.2 13.26 ±6.16 1.12 ±0.15 6.28 20.28 ± 47.38 ±12.2 15.38 ±6.92 1.13 ±0.18 20.12 ±5.32 SCA3 n = 19 (8 M-11 W) 42.26 ± 10.88 (n = 19) 69.16 ± 5.55 (50–76) 8.6 ± 4.8 50.89 ±12.02 14.1 ±7.26 1.03 ±0.1 10.5 34.92 ± 52.89 ±12.02 16.13 ±7.48 1.08 ±0.12 33.14 ±9.38 SCA7 n = 13 (7 M-6 W) 38.09 ± 12.99 (n = 11) 42.46 ± 5.1 (36–56) 9.0 ± 5.2 45.54 ±13.78 10.15 ±7.79 1.05 ±0.18 15.1 26.25 ± 47.54 ±13.78 12.53 ±9.79 1.1 ±0.22 27.33 ±13 p** 0.27 – 0.15 0.52 0.28 0.31 0.003 0.47 0.75 0.004
Comparison of clinical data and plasma NfL levels between the SCA population and control group at baseline and follow-up and details for each SCA subtype. Data are presented as the mean ± standard deviation and significant values are in bold. Abbreviations: AO: age at disease onset, CCFS: composite cerebellar functional severity scale, M: men, NfL: neurofilament light chain, SARA: scale for the assessment and rating of ataxia, SCA: spinocerebellar ataxia, W: women, y: years.
*p-value referred to comparison between control group and SCAs group. **p-value referred to comparison among SCAs groups.
Fig. 2. Correlation between plasma NfL concentrations and CAG repeat size in
SCA1 and SCA7.
The figure shows greater NFL concentrations (pg/mL) at baseline for greater CAG repeat length, significant for SCA1 (r = 0.52, p = 0.03) and SCA7 (r = 0.93, p ≤0.001).
size was confirmed at follow-up, r = 0.85; p < 0.001 (Table 1).
3.2. NfL stability at 2-year follow-up
At the two-year follow-up visit, NfL concentrations were stable for controls (10.71 ± 4.2 pg/mL, p = 0.13) and for all SCA carriers: both as a group (27.29 ± 10.92 pg/mL, p = 0.69) and for each genotype taken separately (26.20 ± 11.12 pg/mL, SCA1 p = 0.22; 20.12 ± 5.32 pg/mL, SCA2 p = 0.83; 33.14 ± 9.38 pg/mL, SCA3 p = 0.09; 27.33 ± 13 pg/mL, SCA7 p = 0.12), Table 2. SCA3 confirmed to have the higher NfL con-centration compared to SCA1 and SCA2 (Fig. 1B, Table 2). Change over time in NfL levels for individuals (∆NfL) showed no significant differ-ences between SCAs and controls (0.03 ± 4.64 vs 0.46 ± 1.57, p = 0.69), even across SCA subtypes (1.4 ± 4.04 for SCA1, − 0.16 ± 2.59 for SCA2, − 1.78 ± 4.81 for SCA3, 1.08 ± 6.1 for SCA7, p = 0.16).
3.3. Evolution of presymptomatic SCAs carriers
Two out of seven premanifest carriers had converted to the ataxic stage (SARA >3) at follow-up: one SCA1 carrier with an NfL level of 13.3 pg/mL, close to the cut-off level of 16.87 pg/mL, and one SCA3 carrier with 15.9 pg/mL (cut-off at 16.04 pg/mL). The other premanifest carriers, despite a SARA score < 3, reported cramps and back pain (one SCA3 with NfL values of 19.2 pg/mL) or had pyramidal signs at exam-ination (two SCA7 carriers with NfL levels of 13.9 pg/mL and 20.4 pg/ mL respectively, for a cut-off value of 16.67 pg/mL). All premanifest carriers with NfL levels close to or above cut-off concentrations had moved into the disease stage at follow-up. This finding shows that NfL levels are sensitive to non-cerebellar manifestations of the disease in SCA3 and SCA7. Only the carriers with NfL levels below 10 pg/mL had no cerebellar and no extra-cerebellar signs (SCA1 carrier with 8.9 pg/mL and SCA7 carrier with 9.6 pg/mL).
3.4. MRI volumetry and NfL correlations
As previously reported, volumes of the cerebellum and pons decreased in all SCA groups between baseline and follow-up (p < 0.05), while there was no change for controls (cerebellum volume, p = 0.12; pons volume, p = 0.65) (Adanyeguh et al., 2018).
For all SCAs, the higher the observed NfL, the lower the pons volume was found to be at baseline (r = − 0.35, p < 0.01) (Fig. 3) and follow-up
(r = − 0.30, p = 0.02), Table 1. This negative correlation was confirmed for SCA3 at baseline (r = − 0.71, p = 0.001), with a tendency to persist at follow-up (r = − 0.47, p = 0.06), Table 1. For all SCAs, there was a correlation between NfL levels at baseline and cerebellum volume change (r = − 0.29, p = 0.03), Table 1.
Higher NfL levels at baseline predicted a decrease of cerebellar vol-ume in all SCAs (β = − 5.8 × 10⁻⁵ ± 2.7 × 10⁻⁵, p = 0.03), Fig. 3,
Table 1. This result remained significant only for SCA2 when analyzing each individual genotype (β = − 1.0 × 10⁻⁴ ± 3.7 × 10⁻⁵, p = 0.02),
Table 1.
4. Discussion
We measured plasma NfL levels in SCA1, SCA2, SCA3, and SCA7 pathological expansion carriers in a longitudinal study and correlated those levels with clinical and imaging markers. The higher the NfL at baseline, the greater the SARA score and the greater the cerebellar volume loss at the two-year follow-up. Thus, NfL concentrations pre-dicted cerebellar volume loss at two years in SCAs, as it has also been shown in Huntington Disease, where higher NfL levels predicted reduced volumes of the caudate and putamen bilaterally (Scahill et al., 2020). NfL levels do not change over time in SCAs in our study, this is also true in ALS (Lu et al., 2015), and they were not associated with age as for ALS, frontotemporal dementia, and atypical parkinsonian syn-dromes (Bridel et al., 2019) (Table 3). However, in other settings NFL levels increase, as for example in Alzheimer’s disease (Mattsson et al., 2019), multiple sclerosis (Bjornevik et al., 2020), and also in SCA3 (Wilke et al., 2020) (Table 3). NfL concentrations in SCA patients fall between the highest levels observed in ALS (Lu et al., 2015) or multiple system atrophy (Wilke et al., 2018a) and the lowest levels in Friedreich’s ataxia (Zeitlberger et al., 2018) or Parkinson’s disease (Table 3) ( Oos-terveld et al., 2020). This could be explained by either different disease progression rates or different levels of peripheral nervous system dysfunction, as in ALS (Gaetani et al., 2019). Despite this, plasma NfL levels are not directly comparable in neurological disorders due to the different time points and different disease stages for which the plasma samples were collected (Table 3).
Because NfL concentrations reflect irreversible neuronal damage, we would expect levels to increase over time and parallel the visible clinical and radiological progression. The absence of NfL change over two years suggests this marker could be useful as a predictor to characterize
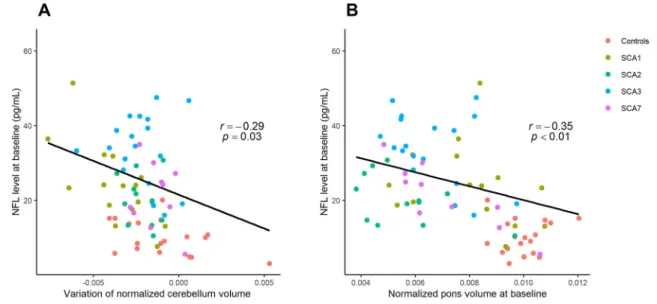
Fig. 3. Correlation between NfL concentrations and MRI volumetry in all SCA carriers and controls.
A. Correlation between NfL concentration at baseline and cerebellum volume change (r = − 0.29, p = 0.03). For controls, no correlation was found (p = 0.38). B. Correlation between NfL concentrations and pons volume was negative in all SCAs carriers at baseline (r = − 0.35, p < 0.01). For controls, no correlation was found (p = 0.93).
Neurobiology of Disease 153 (2021) 105311
6
premanifest cases, rather than as an outcome measure in patients with overt disease. The latter may have already reached a plateau NfL level that masks the age-dependent increase of NfL. Interestingly, premanifest SCA carriers in our study had normal, intermediate or elevated NfL levels. Pathological levels above or close to our cut-off were observed in non-ataxic carriers who had extra-cerebellar signs. One third of polyQ SCA carriers present with signs other than gait disturbances at onset (Globas et al., 2008). It is possible that NfL levels reflect the non- cerebellar signs of these diseases even before cerebellar ataxia clini-cally manifests.
Among genotypes, SCA3 carriers had higher NfL levels than SCA1 and SCA2, as has been previously reported (Wilke et al., 2018a). With our longitudinal data we can add that though NfL levels were the highest, SARA evolved the least in SCA3. This could be due to more prominent peripheral nervous system involvement, as painful axonal neuropathy is the hallmark of SCA3. Despite the finding that SCA3 had the smallest variation in SARA score, we confirmed the correlation be-tween NfL and SARA score as previously reported for this subgroup as well (Li et al., 2019; Wilke et al., 2020; Peng et al., 2020). Only SCA3 subtype confirmed the correlation between NfL levels and pons atrophy that could be explained by the prominent involvement of pons nuclei compared to the other SCA groups (Seidel et al., 2012). For the SCA2
Table 3
Blood Neurofilament Light Chain concentrations in neurological diseases: from highest to lowest values.
Disease Blood NfL (pg/
mL, mean, range) Type of study Comments
Amyotrophic Lateral Sclerosis (Wilke et al., 2018b) 158.4 (93.2–246.3) n = 33 Cross-sectional Amyotrophic Lateral Sclerosis (Lu et al., 2015) 78 (40.2–146), <60 years 99.9 (57.6–167), 60–69 years 105 (61.7–154), 70–79 117.2 (54.9, 216.7), ≥80 years n = 67 Cross-sectional and longitudinal, age < 60 years Cut-off value = 36.2 pg/mL NfL stable at 15 months follow-up Multiple Systemic Atrophy type C18 60.7 (44.5–94) n = 25 Cross-sectional Dominant ataxias (SCA 1, 2, 3, 6) ( Wilke et al., 2018a) 58.7 (45.3–74.0)
n = 20 Cross-sectional Moderate disease, SARA score 13.0 (7.8–17.1) Huntington Disease (Byrne et al., 2017) 28.36 ± 22.24 (early premanifest, n = 58) 39.39 ± 14.19 (late premanifest, n = 46) 52.18 ± 20.52 (HD stage 1, n = 66) 57.48 ± 23.82 (HD stage 2, n = 31) Cross-sectional Alzheimer Disease (Mattsson et al., 2019) 37.9 pg/mL (MCI, n = 855) 45.9 pg/mL (AD dementia, n = 327) Longitudinal Increase of 4.9 pg/ mL per year Multiple Sclerosis (Bjornevik et al., 2020) Median 45.1 (IQR, 27.0–102.7) n = 30 Nested
case-control NfL increased 6 years before onset
SCA3 (Wilke et al.,
2020) 34.8 (28.3–47.0) cohort 1 ESMI consortium, n = 75 85.5 (70.2–100.2) cohort 2 EuroSCA and RiSCA, n = 27
Cross-sectional Moderate disease, SARA score 13.0 (10.0–21.5) cohort 1 Moderate disease, SARA score 11.5 (6.5– 15.0) cohort 2
Cut-off value cohort 2 = 20.3 pg/mL NfL higher than controls 7.5 years before onset SCA3 (Li et al., 2019) 15.3 ± 7.5 (preclinical, n = 26) 37.5 ± 13.5 (manifest, n = 90)
Cross-sectional Cut-off value = 20 pg/mL
Moderate disease, SARA score 11.72 ± 6.02
SCA3 (Peng et al.,
2020) 12.18 (10.2–13.9) (asymptomatic, n =17) 21.84 (18.37–23.45) (premanifest, n = 20) 36.06 (30.04–45.9) (manifest, n = 198)
Cross-sectional Moderate disease, SARA score 13 (10–17.5) for manifest group
Table 3 (continued)
Disease Blood NfL (pg/
mL, mean, range) Type of study Comments
Frontotemporal Dementia ( Meeter et al., 2016) 31.5 (manifest, n =35) 3.5 (premanifest, n = 44)
Cross-sectional Cut-off value = 18.0 pg/mL (patients from presymptomatic carriers) Cut-off value = 8.3 pg/mL (presymptomatic carriers from controls) Dominant ataxias (Our study, 2020) SCA1 SCA2 SCA3 SCA7 24.79 (7.6–51.4), n ¼ 17 20.28 (10.5–30.8), n ¼ 13 34.92 (16–55.7), n ¼ 19 26.25 (5.5–62.8), n ¼ 13
Longitudinal NfL levels stable at 24-month follow- up Cut-off value ¼ 16.87 pg/mL Cut-off value ¼ 19.1 pg/mL Cut-off value ¼ 16.04 pg/mL Cut-off value ¼ 16.67 pg/mL (manifest from controls) Sporadic adult- onset ataxia ( Wilke et al., 2018a) 28.0 (19.1–49.2) n = 25 Cross-sectional Inherited spastic paraparesis ( Wilke et al., 2018b) 24.7 (18.1–40)
n = 96 Cross-sectional ROC analysis indicated the performance of NfL for differentiating HSP patients from ALS patients Parkinson Disease (Oosterveld et al., 2020) 18.7 (12.1–30.8)
n = 139 Cross-sectional Cut-off value = 15.6 pg/mL Friedreich Ataxia ( Zeitlberger et al., 2018) 17.10 (13.00–24.40) n = 33
Cross-sectional No correlation with GAA repeat expansion size
Abbreviations: AD: Alzheimer’s disease; ALS: amyotrophic lateral sclerosis; HSP: hereditary spastic paraplegia; MCI: mild cognitive impairment; NfL: neurofila-ment light chain; ROC: receiver operating characteristic; SCA: spinocerebellar ataxia.
subtype, the smallest group among the SCAs in our cohort, NfL level at baseline still predicted cerebellar volume changes. This reflects a remarkable atrophy already present at a premanifest stage (Reetz et al., 2018; Jacobi et al., 2015).
In SCAs, age at onset is mainly predicted by expanded CAG sizes (Tezenas du Montcel et al., 2014), with larger CAG repeat sizes pre-dicting more severe disease in younger patients. In our cohort, NfL levels correlated only with CAG repeat size for SCA1 and SCA7, a strong link which has already been reported for HD (Byrne et al., 2017). This may be because SCA1 and SCA7 in our sample showed the strongest corre-lation between CAG repeat size and age at onset. In one SCA3 study, including two cohorts with a total of 124 carriers, in addition to the correlation with disease progression and the prediction of the estimated age at onset, NfL levels also increased with CAG repeat size and age (Wilke et al., 2020). The limited sample size in our study compared to the Wilke et al., 202028 study could be a factor in the lack of correlation
with CAG repeat length. While it is well established that blood and CSF NfL concentrations increase with age in healthy controls (Gaetani et al., 2019) (as we also observed in our study), we did not find an age- dependent increase in NfL levels in SCA carriers. Instead, a correlation between NfL levels and age at sampling is reported for SCA3 in two studies (Li et al., 2019; Wilke et al., 2020). In addition to the limited number of SCA3 patients included in our study, the lack of correlation with CAG repeat length could be explained in part by different age at sampling. In our study, SCA3 carriers had a mean age at baseline of almost 51 years old. In the study of Li et al. 201927 and Wilke et al., 2020
(Wilke et al., 2020), the ataxic SCA3 patients had similar age, but pre-symptomatic SCA3 carriers were included with a mean age between 31 and 36 years old representing 29 and 21% of the study samples respectively. The difference in ages between our study and the others, especially with presymptomatic carriers below the age of 50 in the two previous papers, could explain why we did not find a change in Nfl level due to older age. In fact, previous studies have reported a non-linear association between age and NfL concentrations, which have been shown to reach a plateau (Li et al., 2019; Wilke et al., 2020). Compared to the studied of Li et al. 201927 and Wilke et al., 2020 (Wilke et al., 2020), we included patients with higher SARA score and less pre-symptomatic carriers. Careful inclusion criteria for cohorts using NfL concentrations as readouts of efficacy should be considered.
Our study presents certain limitations. The appropriate sample size for NfL has been estimated as 15 for SCA patients (Wilke et al., 2018a), in the present dataset SCA2 and SCA7 samples did not reach 15. In rare neurogenetic diseases, attaining large cohort of carriers remains a challenge. Our aim to have longitudinal data further reduced the sample size. While our study included data from baseline and a two-year follow- up visit, more assessment points over time and longer follow-up, may have allowed for a better understanding of NfL level evolution. In order to intervene prior to disease onset, studies of larger cohorts of pre-symptomatic carriers should be planned in the future. The use of NfL to determine disease onset in SCA3 has been explored (Wilke et al., 2020) and should be useful for other polyQ subtypes.
Clinical trials with antisense oligonucleotides (ASOs) are planned for polyQ SCAs over the next few years. This means there is an urgent need for a biomarker as an objective and reliable measure of biological pro-cesses to allow for the evaluation of a drug’s effects. In contrast to HD, for which huntingtin in CSF can be measured, ataxin-specific bioassays are under development as recently reported in peripheral blood mono-nuclear cells for SCA3 (Gonsior et al., 2020). The main outcome measure of clinical trials is currently the SARA score. However, as we have shown in the current study, NfL detected the multisystem spread of pathology before ataxic onset in premanifest carriers with a SARA score < 3.
We also know that clinical measurements are rater-dependent and are not entirely accurate in detecting disease progression (Adanyeguh et al., 2018). To date, the most sensitive biomarkers for polyQ SCAs come from MRI studies (Adanyeguh et al., 2018), with brainstem and cerebellum atrophy already present at the presymptomatic stage for
SCA1 and SCA2 carriers (Reetz et al., 2018; Jacobi et al., 2013). Here, we show that brainstem and cerebellum atrophy is linked to NfL levels in SCAs. Even though, there is not a direct correlation with cerebellum volume, the cerebellum volume loss is greater for SCAs carriers with the highest level of NfL at baseline. The absence of an increase in NfL level at the two-year follow-up indicates that we cannot use NfL as a biomarker of disease progression during the short periods of time usually used in clinical trials, but as a biomarker of disease severity predicting the cerebellum atrophy. However, we can hypothesize on the role of NfL in clinical trials to monitor ASO effects; a decrease in blood NfL concen-trations, subsequent to ASO injections, would be indirect evidence of a slowdown in neurodegeneration.
5. Conclusions
We defined disease cut off levels for SCA1, 2, 3 and 7 genotypes and showed that plasma NfL levels in SCAs predict cerebellar volume changes and clinical progression. This will be useful in refining clinical staging and may have use in future clinical trials.
Funding
This study was supported by a grant from the French Ministry of Health “Programme Hospitalier de Recherche Clinique” (PHRC BIOSCA – ID RCB: 2010-A01324 35, AOM10094, NCT01470729).
Declaration of Competing Interest
None.
Acknowledgements
We would like to thank the SCA carriers and healthy volunteers for their participation in this study. We would like to thank Assistance- Publique des Hˆopitaux de Paris, which sponsored the study.
References
Adanyeguh, I.M., Perlbarg, V., Henry, P.-G., et al., 2018. Autosomal dominant cerebellar ataxias: imaging biomarkers with high effect sizes. NeuroImage Clin. 19, 858–867.
https://doi.org/10.1016/j.nicl.2018.06.011.
Benatar, M., Wuu, J., Andersen, P.M., Lombardi, V., Malaspina, A., 2018. Neurofilament light: a candidate biomarker of presymptomatic amyotrophic lateral sclerosis and phenoconversion. Ann. Neurol. 84 (1), 130–139. https://doi.org/10.1002/ ana.25276.
Benedet, A.L., Leuzy, A., Pascoal, T.A., et al., 2020. Stage-specific links between plasma neurofilament light and imaging biomarkers of Alzheimer’s disease. Brain J Neurol. Published online November 19. https://doi.org/10.1093/brain/awaa342. Bjornevik, K., Munger, K.L., Cortese, M., et al., 2020. Serum Neurofilament light chain
levels in patients with Presymptomatic multiple sclerosis. JAMA Neurol. 77 (1), 58–64. https://doi.org/10.1001/jamaneurol.2019.3238.
Bridel, C., van Wieringen, W.N., Zetterberg, H., et al., 2019. Diagnostic value of cerebrospinal fluid Neurofilament light protein in neurology: a systematic review and meta-analysis. JAMA Neurol. https://doi.org/10.1001/jamaneurol.2019.1534. Published online June 17.
Byrne, L.M., Rodrigues, F.B., Blennow, K., et al., 2017. Neurofilament light protein in blood as a potential biomarker of neurodegeneration in Huntington’s disease: a retrospective cohort analysis. Lancet Neurol. 16 (8), 601–609. https://doi.org/ 10.1016/S1474-4422(17)30124-2.
de Assis, A.M., Saute, J.A.M., Longoni, A., et al., 2017. Peripheral oxidative stress biomarkers in Spinocerebellar Ataxia type 3/Machado-Joseph disease. Front. Neurol. 8, 485. https://doi.org/10.3389/fneur.2017.00485.
du Montcel, S.T., Charles, P., Ribai, P., et al., 2008. Composite cerebellar functional severity score: validation of a quantitative score of cerebellar impairment. Brain J. Neurol. 131 (Pt 5), 1352–1361. https://doi.org/10.1093/brain/awn059. Friedrich, J., Kordasiewicz, H.B., O’Callaghan, B., et al., 2018. Antisense oligonucleotide-
mediated ataxin-1 reduction prolongs survival in SCA1 mice and reveals disease- associated transcriptome profiles. JCI Insight 3 (21). https://doi.org/10.1172/jci. insight.123193.
Gaetani, L., Blennow, K., Calabresi, P., Di Filippo, M., Parnetti, L., Zetterberg, H., 2019. Neurofilament light chain as a biomarker in neurological disorders. J. Neurol. Neurosurg. Psychiatry 90 (8), 870–881. https://doi.org/10.1136/jnnp-2018- 320106.
Neurobiology of Disease 153 (2021) 105311
8 Globas, C., du Montcel, S.T., Baliko, L., et al., 2008. Early symptoms in spinocerebellar
ataxia type 1, 2, 3, and 6. Mov Disord Off J Mov Disord Soc. 23 (15), 2232–2238.
https://doi.org/10.1002/mds.22288.
Gonsior, K., Kaucher, G.A., Pelz, P., et al., 2020. PolyQ-expanded ataxin-3 protein levels in peripheral blood mononuclear cells correlate with clinical parameters in SCA3: a pilot study. J. Neurol. 26 https://doi.org/10.1007/s00415-020-10274-y. Published online October.
Hall, S., ¨Ohrfelt, A., Constantinescu, R., et al., 2012. Accuracy of a panel of 5 cerebrospinal fluid biomarkers in the differential diagnosis of patients with dementia and/or parkinsonian disorders. Arch. Neurol. 69 (11), 1445–1452. https://doi.org/ 10.1001/archneurol.2012.1654.
Hansson, O., Janelidze, S., Hall, S., et al., 2017. Blood-based NfL: a biomarker for differential diagnosis of parkinsonian disorder. Neurology. 88 (10), 930–937.
https://doi.org/10.1212/WNL.0000000000003680.
Herbert, M.K., Aerts, M.B., Beenes, M., et al., 2015. CSF Neurofilament light chain but not FLT3 ligand discriminates Parkinsonian disorders. Front. Neurol. 6, 91. https:// doi.org/10.3389/fneur.2015.00091.
Jacobi, H., Reetz, K., du Montcel, S.T., et al., 2013. Biological and clinical characteristics of individuals at risk for spinocerebellar ataxia types 1, 2, 3, and 6 in the longitudinal RISCA study: analysis of baseline data. Lancet Neurol. 12 (7), 650–658. https://doi. org/10.1016/S1474-4422(13)70104-2.
Jacobi, H., du Montcel, S.T., Bauer, P., et al., 2015. Long-term disease progression in spinocerebellar ataxia types 1, 2, 3, and 6: a longitudinal cohort study. Lancet Neurol. 14 (11), 1101–1108. https://doi.org/10.1016/S1474-4422(15)00202-1. Johnson, E.B., Byrne, L.M., Gregory, S., et al., 2018. Neurofilament light protein in blood
predicts regional atrophy in Huntington disease. Neurology. 90 (8), e717–e723.
https://doi.org/10.1212/WNL.0000000000005005.
Khalil, M., 2018. Neurofilaments as biomarkers in neurological disorders. Nat. Rev. Neurol. 14 https://doi.org/10.1038/s41582-018-0058-z.
Kuhle, J., Barro, C., Andreasson, U., et al., 2016. Comparison of three analytical platforms for quantification of the neurofilament light chain in blood samples: ELISA, electrochemiluminescence immunoassay and Simoa. Clin. Chem. Lab. Med. 54 (10), 1655–1661. https://doi.org/10.1515/cclm-2015-1195.
Kuhle, J., Kropshofer, H., Haering, D.A., et al., 2019. Blood neurofilament light chain as a biomarker of MS disease activity and treatment response. Neurology. 92 (10), e1007–e1015. https://doi.org/10.1212/WNL.0000000000007032.
Li, Q.-F., Dong, Y., Yang, L., et al., 2019. Neurofilament light chain is a promising serum biomarker in spinocerebellar ataxia type 3. Mol. Neurodegener. 14 (1), 39. https:// doi.org/10.1186/s13024-019-0338-0.
Lu, C.-H., Macdonald-Wallis, C., Gray, E., et al., 2015. Neurofilament light chain: a prognostic biomarker in amyotrophic lateral sclerosis. Neurology. 84 (22), 2247–2257. https://doi.org/10.1212/WNL.0000000000001642. Mattsson, N., Cullen, N.C., Andreasson, U., Zetterberg, H., Blennow, K., 2019.
Association between longitudinal plasma Neurofilament light and Neurodegeneration in patients with Alzheimer disease. JAMA Neurol. 76 (7), 791–799. https://doi.org/10.1001/jamaneurol.2019.0765.
McLoughlin, H.S., Moore, L.R., Chopra, R., et al., 2018. Oligonucleotide therapy mitigates disease in spinocerebellar ataxia type 3 mice. Ann. Neurol. 84 (1), 64–77.
https://doi.org/10.1002/ana.25264.
Meeter, L.H., Dopper, E.G., Jiskoot, L.C., et al., 2016. Neurofilament light chain: a biomarker for genetic frontotemporal dementia. Ann Clin Transl Neurol. 3 (8), 623–636. https://doi.org/10.1002/acn3.325.
Moore, L.R., Rajpal, G., Dillingham, I.T., et al., 2017. Evaluation of antisense oligonucleotides targeting ATXN3 in SCA3 mouse models. Mol Ther Nucleic Acids. 7, 200–210. https://doi.org/10.1016/j.omtn.2017.04.005.
Niu, C., Prakash, T.P., Kim, A., et al., 2018. Antisense oligonucleotides targeting mutant Ataxin-7 restore visual function in a mouse model of spinocerebellar ataxia type 7. Sci. Transl. Med. 10 (465) https://doi.org/10.1126/scitranslmed.aap8677. Oosterveld, L.P., Verberk, I.M.W., Majbour, N.K., et al., 2020. CSF or serum
neurofilament light added to α-Synuclein panel discriminates Parkinson’s from
controls. Mov Disord Off J Mov Disord Soc. 35 (2), 288–295. https://doi.org/ 10.1002/mds.27897.
Peng, Y., Zhang, Y., Chen, Z., et al., 2020. Association of serum neurofilament light (sNfL) and disease severity in patients with spinocerebellar ataxia type 3. Neurology 14. https://doi.org/10.1212/WNL.0000000000010671. Published online August. Preische, O., Schultz, S.A., Apel, A., et al., 2019. Serum neurofilament dynamics predicts
neurodegeneration and clinical progression in presymptomatic Alzheimer’s disease. Nat. Med. 25 (2), 277–283. https://doi.org/10.1038/s41591-018-0304-3. Reetz, K., Rodríguez-Labrada, R., Dogan, I., et al., 2018. Brain atrophy measures in
preclinical and manifest spinocerebellar ataxia type 2. Ann Clin Transl Neurol. 5 (2), 128–137. https://doi.org/10.1002/acn3.504.
Scahill, R.I., Zeun, P., Osborne-Crowley, K., et al., 2020. Biological and clinical characteristics of gene carriers far from predicted onset in the Huntington’s disease young adult study (HD-YAS): a cross-sectional analysis. Lancet Neurol. 19 (6), 502–512. https://doi.org/10.1016/S1474-4422(20)30143-5.
Schmitz-Hübsch, T., du Montcel, S.T., Baliko, L., et al., 2006. Scale for the assessment and rating of ataxia: development of a new clinical scale. Neurology. 66 (11), 1717–1720. https://doi.org/10.1212/01.wnl.0000219042.60538.92.
Scoles, D.R., Meera, P., Schneider, M.D., et al., 2017. Antisense oligonucleotide therapy for spinocerebellar ataxia type 2. Nature. 544 (7650), 362–366. https://doi.org/ 10.1038/nature22044.
Seidel, K., Siswanto, S., Brunt, E.R.P., den Dunnen, W., Korf, H.-W., Rüb, U., 2012. Brain pathology of spinocerebellar ataxias. Acta Neuropathol (Berl). 124 (1), 1–21.
https://doi.org/10.1007/s00401-012-1000-x.
Tezenas du Montcel, S., Durr, A., Rakowicz, M., et al., 2014. Prediction of the age at onset in spinocerebellar ataxia type 1, 2, 3 and 6. J. Med. Genet. 51 (7), 479–486.
https://doi.org/10.1136/jmedgenet-2013-102200.
Wild, E.J., Boggio, R., Langbehn, D., et al., 2015. Quantification of mutant huntingtin protein in cerebrospinal fluid from Huntington’s disease patients. J. Clin. Invest. 125 (5), 1979–1986. https://doi.org/10.1172/JCI80743.
Wilke, C., Bender, F., Hayer, S.N., et al., 2018a. Serum neurofilament light is increased in multiple system atrophy of cerebellar type and in repeat-expansion spinocerebellar ataxias: a pilot study. J. Neurol. 265 (7), 1618–1624. https://doi.org/10.1007/ s00415-018-8893-9.
Wilke, C., Rattay, T.W., Hengel, H., et al., 2018b. Serum neurofilament light chain is increased in hereditary spastic paraplegias. Ann Clin Transl Neurol. 5 (7), 876–882.
https://doi.org/10.1002/acn3.583.
Wilke, C., Haas, E., Reetz, K., et al., 2020. Neurofilaments in spinocerebellar ataxia type 3: blood biomarkers at the preataxic and ataxic stage in humans and mice. EMBO Mol Med. 12 (7), e11803. https://doi.org/10.15252/emmm.201911803. Zeitlberger, A.M., Thomas-Black, G., Garcia-Moreno, H., et al., 2018. Plasma markers of
Neurodegeneration are raised in Friedreich’s Ataxia. Front. Cell. Neurosci. 12, 366.
https://doi.org/10.3389/fncel.2018.00366.
Zhang, S., Hu, Z., Mao, C., Shi, C., Xu, Y., 2020. CHIP as a therapeutic target for neurological diseases. Cell Death Dis. 11 (9), 1–12. https://doi.org/10.1038/s41419- 020-02953-5.