HAL Id: hal-02989517
https://hal.archives-ouvertes.fr/hal-02989517
Submitted on 24 Nov 2020HAL is a multi-disciplinary open access archive for the deposit and dissemination of sci-entific research documents, whether they are pub-lished or not. The documents may come from teaching and research institutions in France or abroad, or from public or private research centers.
L’archive ouverte pluridisciplinaire HAL, est destinée au dépôt et à la diffusion de documents scientifiques de niveau recherche, publiés ou non, émanant des établissements d’enseignement et de recherche français ou étrangers, des laboratoires publics ou privés.
Fe3+/ΣFe of olivine-hosted melt inclusions inferred from
Mössbauer and XANES 1spectroscopy
M. Gaborieau, M. Laubier, N. Bolfan-Casanova, C.A. Mccammon, D.
Vantelon, A.I. Chumakov, F. Schiavi, D.R. Neuville, S. Venugopal
To cite this version:
M. Gaborieau, M. Laubier, N. Bolfan-Casanova, C.A. Mccammon, D. Vantelon, et al.. Fe3+/ΣFe of olivine-hosted melt inclusions inferred from Mössbauer and XANES 1spectroscopy. Chemical Geology, Elsevier, 2020, 547, pp.119646. �10.1016/j.chemgeo.2020.119646�. �hal-02989517�
1
Fe3+/ΣFe of olivine-hosted melt inclusions inferred from Mössbauer and XANES
1
spectroscopy
2
M. Gaborieau1*, M. Laubier1, N. Bolfan-Casanova1, C. McCammon2, D. Vantelon3, A.I.
3
Chumakov4, F. Schiavi1, D. R. Neuville5, S. Venugopal1, 6
4
1Université Clermont Auvergne, CNRS, IRD, OPGC, Laboratoire Magmas et Volcans, F-5
63000 Clermont-Ferrand, France
6
2Bayerisches Geoinstitut, Universität Bayreuth, D-95440 Bayreuth, Germany
7
3Synchrotron SOLEIL, BP 48 91192 Gif-sur-Yvette, France
8
4ESRF-The European Synchrotron, CS40220, 38043 Grenoble Cedex 9, France
9
5Institut de physique du globe de Paris, 75238 Paris Cedex 5, France
10
6Centre for Natural Hazards Research, Department of Earth Sciences, Simon Fraser
11
University, BC, V5A 1S6, Canada
12
*Correspondence: marion.gaborieau@uca.fr
13 14
Declarations of interest: none
15 16
Keywords: beam damage, oxygen fugacity, arc magma, synchrotron Mössbauer, melt inclusion,
17
XANES
18 19
Iron speciation is linked to the oxygen fugacity of the system; hence determining the
20
Fe3+/ΣFe ratio of glasses can allow us to determine their oxidation state. Using X-ray
21
Absorption Near Edge Structure (XANES) spectroscopy in silicate glasses and olivine-hosted
22
melt inclusions, previous studies have shown that arc basalts are more oxidized than
mid-23
oceanic ridge basalts (MORB) and oceanic island basalts (OIB). However, Cottrell et al. (2018)
24
have recently demonstrated that hydrous glasses can be affected by beam-induced oxidation
2
during XANES analysis, which leads to an over-estimation of their Fe3+/ΣFe ratios. Here, we
26
determined Fe3+/ΣFe ratios in olivine-hosted melt inclusions from various arcs, MORB and OIB
27
localities by Mössbauer and XANES spectroscopy. A careful evaluation of beam damage
28
during XANES analysis was carried out with attentive investigation of XANES spectra and
29
time series collected on hydrous basaltic and basanitic glasses using different radiation doses.
30
Therefore, the Fe3+/ΣFe ratios obtained with these two methods on the same sample set allowed
31
us to constrain the oxidation state of those magmas by avoiding the effect of beam-induced
32
oxidation that may occur during XANES analysis.
33
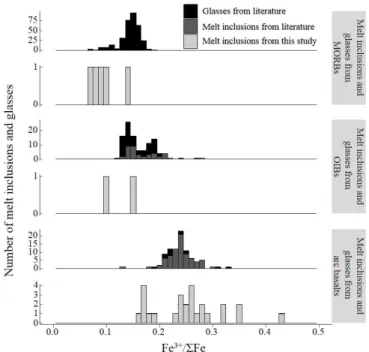
Our results show that melt inclusions from MORBs, OIBs and arc basalts display mean
34
Fe3+/ΣFe ratios of 0.10 ± 0.05 (n=5), 0.13 ± 0.05 (n=2) and 0.25 ± 0.15 (n=19), respectively.
35
Mount Etna melt inclusions display a mean Fe3+/ΣFe ratio of 0.26 ± 0.05 (n=7). Therefore, they
36
confirm that arc magmas are more oxidized than those from hot spots and mid-ocean ridges.
37
Furthermore, they suggest that the range in the oxidation state observed in our melt inclusion
38
dataset may be linked to changes in the oxidation state of the mantle beneath arcs due to
39
subduction processes.
40
1. Introduction
41
Many studies have demonstrated that arc basalts are more oxidized (~ QFM+1.5 ± 1;
42
fO2 given relatively to the quartz-fayalite-magnetite buffer; Gaillard et al. 2015 and references
43
therein) than MORBs (QFM-1.2 to ~ QFM; e.g. Berry et al., 2018; Bézos and Humler, 2005;
44
Birner et al, 2018; Christie et al., 1986; Cottrell and Kelley, 2011, 2013; Mallmann and O’Neill,
45
2009; O’Neill et al., 2018; H. L. Zhang et al., 2018). However, the oxidation state of the
sub-46
arc mantle is still debated. Kelley and Cottrell (2009, 2012) and Brounce et al. (2014, 2015)
47
suggest that variations in the Fe3+/ΣFe ratio measured in basaltic glasses and olivine-hosted
3
melt inclusions from mid-ocean ridges and arcs can be explained by the sub-arc mantle being
49
more oxidized than the mantle beneath ridges. On the other hand, Mallmann and O’Neill (2009)
50
and Lee et al. (2005, 2010) proposed the use of other fO2 proxies, namely V/Sc and Zn/ΣFe
51
ratios in lavas and suggested that the oxidation state of the mantle wedge cannot be
52
distinguished from that of the MORB mantle (see also Dauphas et al., 2009; Li and Lee, 2004).
53
Fe is an abundant multivalent 3d-transition element in silicate glasses, and its speciation
54
is linked to the oxygen fugacity of the system (Kress and Carmichael, 1991). Many techniques
55
allow measurements of the Fe oxidation state, such as wet chemistry (Bézos and Humler, 2005;
56
Christie et al., 1986), Mössbauer spectroscopy (e.g. Jayasuriya et al., 2004; Mccammon, 2004;
57
Partzsch et al., 2004; Zhang et al., 2018), the Flank method on the electron probe (e.g. Fialin et
58
al., 2001; Zhang et al., 2018) and X-Ray absorption near-edge structure (XANES)
59
spectroscopy. Micro-XANES has been widely used to provide Fe3+/ΣFe in silicate glasses (e.g.
60
Berry et al., 2003; Cottrell et al., 2009; Wilke et al., 2004). Its low detection limit and high
61
spatial resolution of ~1-5 µm makes it the ideal technique to analyze melt inclusions trapped in
62
olivine (e.g. Brounce et al., 2014; Hartley et al., 2017; Kelley and Cottrell, 2009, 2012;
63
Moussallam et al., 2016). Because magmas trapped as melt inclusions in primitive crystals are
64
less affected by secondary processes such as degassing of volatiles and fractional crystallization
65
than external magmas, they provide a unique window into the pre-eruptive conditions of
66
magmas.
67
However, a recent study by Cottrell et al. (2018) showed that hydrous glasses can be
68
affected by beam-induced oxidation during XANES analysis. According to this study, the iron
69
oxidation state of glasses can be modified as a function of the radiation dose (which they defined
70
as the total photons delivered per square micrometer) used to perform analyses, their water
71
contents and their initial iron oxidation state. They found that the higher the radiation dose and
4
water content of glasses and the lower their initial Fe3+/ΣFe, the higher the over-estimation of
73
their Fe3+/ΣFe ratios.
74
In this study, Fe3+/ΣFe ratios in olivine-hosted melt inclusions from various arcs, OIB
75
and MORB localities were analyzed by µ-XANES spectroscopy after determination of the
76
analytical conditions that allowed us to mitigate beam damage. In addition, for the first time,
77
the Fe3+/ΣFe ratios of a subset of those melt inclusions were analyzed by synchrotron
78
Mössbauer source spectroscopy. The Fe3+/ΣFe ratios obtained with these two methods on the
79
same sample set allow us to constrain the oxidation state of iron in those magmas by avoiding
80
the effect of beam-induced oxidation that may occur during XANES analysis. Then we were
81
able to confirm that arc magmas are more oxidized than those from hot spots and mid-ocean
82
ridges. Our results suggest that the variation in the oxidation state observed in our melt inclusion
83
dataset may be linked to changes in the oxidation state of the mantle beneath arcs due to
84
subduction processes.
85
2. Natural samples
86
Secondary processes such as magmatic differentiation and degassing of volatile species
87
can affect magmas during their ascent to the surface and modify their chemical composition
88
and their oxidation state (e.g. Cottrell and Kelley, 2011; Kelley and Cottrell, 2012; Moussallam
89
et al., 2016). To investigate the oxidation state of primitive magmas, we selected melt inclusions
90
trapped in high-Mg olivines (i.e., with a forsterite content > 80%). We selected primary melt
91
inclusions that were far from any crack, did not display daughter minerals or devitrification and
92
therefore did not require re-homogenization. The 33 studied melt inclusions are larger than 30
93
µm and most of them contain a bubble that most likely formed after entrapment (Figure 1 of
94
the Supplementary material).
5
We selected glassy melt inclusions from a picritic lapilli layer collected on the Torgil
96
tuff ring and from the Red Cliff pyroclastic sequence (Ao15, Ao17, Ao2T-T, Ao-T; Sorbadere
97
et al., 2011) of Aoba volcano in the Vanuatu arc. Melt inclusions from Mont Etna were selected
98
from the FS marker bed located on its eastern flank, and formed during a subplinian picritic
99
eruption dated at 3930 ± 60 BP (SVP291c; Coltelli et al., 2005; Kamenetsky et al., 2007). We
100
also selected melt inclusions from scoria samples from the ~50 000 year old La Sommata
101
pyroclastic cone on Vulcano Island (Som; Rose-Koga et al., 2012), and from a tephra layer
102
located in a trench dug at 450 m a.s.l. on the northeastern flank of Stromboli volcano (St82p;
103
Métrich et al., 2001; Rosi et al., 2000) in the Aeolian arc. Melt inclusions were selected from a
104
Pleistocene-aged tephra layer from the mosaic ridge in the Mount Meager Volcanic Complex
105
in the Garibaldi volcanic belt in the Cascades volcanic arc (Aw-15-185; Venugopal et al., in
106
prep). Previously studied melt inclusions from a picritic scoria sample from Piton de Caille on
107
the Northwest rift-zone of Piton de la Fournaise, Reunion Island (CAI; Bureau et al., 1998a;
108
Bureau et al., 1998b; Laubier, 2006) and from mid-ocean ridge basalts from the FAMOUS zone
109
(Northern Mid-Atlantic Ridge; ARP73-10-03; Kamenetsky, 1996; Laubier et al., 2007, 2012)
110
and the Gakkel ridge are also part of our dataset.
111
3. Experimental samples
112
A series of 14 basaltic glasses were synthetized experimentally and used as reference
113
material for XANES measurements. The starting composition was a MORB glass collected in
114
the axial rift of the Pacific mid-ocean ridge (Searise 1 DR 04; Latitude 6.71, Longitude -114.30
115
and depth = 2800 m). The sample was ground under ethanol in an agate mortar to a
116
homogeneous powder mixture.
6
Experiments under anhydrous conditions at 0.1 MPa (ML1 to 9) were performed at
118
Laboratoire Magmas et Volcans (Clermont-Ferrand, France) in a vertical quenching furnace,
119
with a CO2–H2 gas atmosphere. The oxygen fugacity was monitored using a ZrO2–CaO oxygen
120
cell calibrated against the Fe-FeO, Ni-NiO and Cu-Cu2O buffers. In order to cover a range of
121
redox conditions, experiments were performed at different fO2 conditions ranging from -3,5 log
122
units below the quartz–fayalite–magnetite buffer (QFM-3.5) to QFM+4. The sample material
123
for these experiments consisted of ~ 50-70 mg of the mixture that had been mixed with
124
polyvinyl alcohol and pressed into a pellet. This pellet was then sintered onto an iron–platinum
125
alloy loop, which had been previously annealed with the starting composition in order to
126
prevent Fe loss to the alloy during the experiment. The run temperature was continuously
127
monitored using a Pt–Pt90Rh10 thermocouple. The thermocouple was placed in the hotspot of
128
the furnace, where the thermal gradient is <1°C over the length of the sample. The sample was
129
suspended alongside the thermocouple in order to minimize the difference between the
130
temperature of the sample and the reading of the thermocouple. The reproducibility and
131
measurement of this arrangement is better than 5°C. The experiments were run isothermally at
132
1350 °C at the run conditions and typically for 24h.
133
The BH hydrous glasses (BH1, BH3, BH6 BH7 and BH10) were synthesized at
134
Laboratoire Magmas et Volcans in a piston-cylinder apparatus at 1 GPa and 1300 °C using a
135
1/2" assembly. The starting materials consisted of anhydrous glasses that were first synthesized
136
by re-melting the starting material in a gas-mixing furnace at one bar, 1350 °C and three
137
different fO2 conditions of ~QFM, QFM+2 and QFM+4. The glasses were then ground under
138
ethanol in an agate mortar to a homogeneous powder mixture. For the piston-cylinder
139
experiments, we used a Pyrex-MgO assembly, a graphite heater, an outer NaCl sleeve, and
140
Au80-Pd20 capsules (with a 4 mm outer diameter for 1/2″ assemblies, 0.2 mm wall thickness, 4–
141
5 mm length). To prepare the capsules, we first added deionized water at the bottom of the
7
capsule using a micro-syringe. After loading and compacting ~50 mg of glass powder, the
143
capsule was welded shut. We checked for leaks during capsule preparation by weighing the
144
welded capsules before and after ≥ 1h heating at 120 °C in an oven. Before starting the
145
experiments, the capsules were placed in an oven at 120 °C overnight to ensure homogenous
146
distribution of the volatiles. During the experiments, the samples were held at 1300 °C and 1
147
GPa for only 15 min in order to minimize fO2 re-equilibration and H2O loss. The temperature
148
was measured very close to the capsule by a W95Re5-W74Re26 thermocouple. Quenching of the
149
hydration experiments was done by switching off the heating power, which led to a cooling
150
rate > 80 °C/s.
151
The glasses recovered from the experiments were polished on both sides for major
152
element characterization by electron microprobe, H2O concentration measurements by Raman
153
spectroscopy (for hydrous glasses only) and XANES measurements. Fragments of the
154
anhydrous glasses were also analyzed by conventional Mössbauer spectroscopy using a
155
radioactive point source at the Bayerisches Geoinstitüt. Details of the experimental conditions
156
for each run, as well as their chemical compositions can be found in Table 1-2 of the
157
Supplementary material.
158
Three basaltic and three basanitic experimental glasses from Magnien et al. (2004) and
159
Schiavi et al. (2018), respectively, were added to our dataset to complete the range of Fe3+/ΣFe
160
ratios and water contents covered by our experimental glasses. Their chemical compositions
161
can be found in Tables 1-2 of the Supplementary material.
8
4. Analytical methods
163
4.1. Electron microprobe analyzes
164Melt inclusions and their host olivines were analyzed for major elements by electron
165
microprobe at Laboratoire Magmas et Volcans with a CAMECA SX 100. All analyzes were
166
performed with a 15 kV accelerating voltage. Olivines were measured with a 1 µm diameter
167
focused beam and a 100 nA beam current. Counting times for each element were: Al (160-220
168
s), Si (20 s), Mg (30 s), Ca (160 s), Fe (40 s), Mn (60 s) and Ni (120 s). Analyzes of Si, Mg and
169
Fe of olivines presenting a slightly tilted surface were performed in EDS mode using the
170
electron microprobe to avoid bias on their stoichiometry. Counting time for these three elements
171
using this analytical condition was 30 s. Melt inclusions were analyzed with a 10 µm diameter
172
beam and two beam current conditions. The elements measured with a 8 nA beam and their
173
respective counting times were: Na (10 s), Mg (30 s), Si (10 s), Al (20 s), Ca (10 s), Ti (30 s)
174
and Fe (30 s). The elements measured at 50 nA and the respective counting times were: K (40
175
s), P (40 s) and Mn (80 s). Volatile elements were analyzed with a 10 µm diameter beam and a
176
beam current of 40 nA. Respective counting times were: S (50 s), Cl (50 s) and F (300 s).
177
Analytical uncertainties on glass data for major elements were obtained from replicate
178
measurements on the natural glass Ve32 (n = 23). The total analytical 2σ error, which
179
corresponds to the maximum value between the precision and accuracy of measurements, for
180
the Ve32 basaltic glass was 1.4% rel. for SiO2, 4.1% for TiO2, 2.8% for Al2O3, 4.8% for FeO*,
181
11% for MnO, 3.4% for MgO, 3.2% for CaO, 9.2% for Na2O, 9.9% for K2O and 4.6% for P2O5.
182
The major and volatile element compositions of melt inclusions and the major element
183
compositions of their host crystals are given in Table 3 of the Supplementary material. The
184
values on the Ve32 standard are also reported in Table 3 of the Supplementary material.
9
4.2. Raman spectroscopy
186
Water content of 14 melt inclusions was determined by Raman spectroscopy. Spectra
187
were collected at Laboratoire Magmas et Volcans using an InVia (Renishaw) confocal Raman
188
micro-spectrometer. Analytical details can be found in Schiavi et al. (2018). The diode laser
189
output power was 150 mW. Laser power on the sample was reduced by filters in order to operate
190
at powers of ~ 1 mW. Laser power on the sample was periodically checked. The analytical
191
conditions used result in lateral and axial spatial resolutions of ~1 and 3 μm, respectively, near
192
the sample surface. Daily calibration of the spectrometer was performed based on a Si 520.5
193
cm−1 peak. Analyzes were carried out at 2 µm depth on polished melt inclusions. The spectra
194
were recorded in the wavenumber ranges from ~100 to 1350 cm−1 (alumino-silicate network
195
domain) for 4 cycles of 30 s and from ~2900 to 3800 cm−1 (water domain) for 7 cycles of 30 s,
196
using Wire 4.2 software. Basaltic, andesitic and rhyolitic glasses, with water content from 0 to
197
6.70 ± 0.35 wt% were used as external reference standards (Médard and Grove, 2008; Schiavi
198
et al., 2018) and analyzed several times during each analytical session at the same conditions
199
as the samples, in order to correct for the dependence of band intensities on delivered energy.
200
Analytical precision calculated based on repeated daily measurements of the reference glass
201
82-72f#9 was better than 16 % rel. Analyzes of host olivines were performed with the same
202
conditions in order to correct melt inclusion spectra that suffered from signal contamination
203
from the host crystal.
204
Absolute intensity areas of the water band and silicate band were determined after
205
subtraction of a cubic and non-parametric baseline, respectively, using PeakFit© software. For
206
determination of water content in glasses, we used both the external calibration procedure,
207
which is based on the absolute intensities of the water band area, and an internal calibration
208
procedure which normalizes the intensity of the water band area to the area of the silicate bands
209
(Schiavi et al., 2018). The two methods often gave different results (up to ~30% rel.). As
10
demonstrated by Schiavi et al., (2018), the internal calibration is sensitive to matrix effects that
211
are related to changes in glass density, the oxidation state or the presence of dissolved carbonate.
212
For those reasons, we used an external calibration to determine the water content of our melt
213
inclusions. The analytical uncertainty was calculated as the 2σ relative standard deviation
214
(RSD) on replicate measurements. When melt inclusions could only be analyzed once, we
215
report an analytical uncertainty that corresponds to the maximal 2σ RSD determined on
216
replicate analyzes of other melt inclusions in the same session. Water contents of melt
217
inclusions are given in Table 3 of the Supplementary material.
218
4.3. FTIR spectroscopy
219The water contents of 16 melt inclusions were determined by Fourier Transform infrared
220
spectroscopy. Analyzes were performed at LMV using a Bruker Vertex 70 spectrometer
221
coupled with a Hyperion microscope. The spectrometer is equipped with a Globar light source,
222
a KBr beamsplitter and a Mercury-Cadmium-Tellurium alloy (MCT) detector. Melt inclusions
223
polished on both sides were placed on a CaF2 window for the acquisition and the CaF2 window
224
was used for background correction. The beam size varied as a function of the melt inclusion
225
size. Absorbance and background spectra were obtained by acquisition of 600 and 300 scans,
226
respectively. The spectral resolution was 4 cm-1. Spectra were collected in the wavenumber
227
range from 7500 to 700 cm-1. Spectra were corrected for atmospheric contamination using
228
OPUS software. The water contents of melt inclusions were calculated using the Beer-Lambert
229
law. Absorption was derived from the area of the 3550 cm-1 band after baseline subtraction
230
using OPUS software. Sample thicknesses were measured as the vertical displacement of the
231
optical microscope stage between the top of the sample and the sample holder using a focused
232
Raman laser beam. The uncertainty on the thickness measurement was estimated to be ~2 µm.
233
The density was calculated following Bouhifd et al. (2015). For basaltic glasses, we used a
11
molar absorption coefficient of 62.8 ± 0.8 Lmol-1cm-1 as proposed by Mercier et al. (2010). For
235
silicate under-saturated samples, we chose to use a molar absorption coefficient of 43.96 ± 0.6
236
Lmol-1cm-1 (Mercier et al., 2010). The analytical uncertainty was calculated as the 2σ relative
237
standard deviation (RSD) on replicate measurements. When melt inclusions could only be
238
analyzed once, we report an analytical uncertainty that corresponds to the maximal 2σ RSD
239
determined on replicate analyzes of other melt inclusions in the same session. Water contents
240
of melt inclusions are given in Table 3 of the Supplementary material.
241
A few melt inclusions were both analyzed by Raman and FTIR spectroscopy. From the
242
comparison between the two methods, we concluded that both methods gave consistent results,
243
but that the uncertainties on the water contents derived from FTIR spectroscopy were larger
244
due to the error on the thickness of melt inclusions and the uncertainty resulting from the range
245
in the published values for the molar absorption coefficient. Therefore, when both types of data
246
were available, the water contents derived from Raman spectroscopy were preferentially used.
247
4.4. Mössbauer analyzes
248The iron speciation of the 12 anhydrous experimental glasses (Table 1 of the
249
Supplementary material) was determined by conventional Mössbauer spectroscopy. Analyzes
250
were carried out at the Bayerisches Geoinstitut, Bayreuth. Glasses were mounted between two
251
pieces of plastic film and centered in a 1000 µm diameter hole drilled in a 25 µm thick Pb foil.
252
Data were collected in transmission mode on a constant acceleration Mössbauer spectrometer
253
with a nominal 370 MBq 57Co point source in a 12 µm Rh matrix with active dimension of
254
500 × 500 µm2. The velocity scale was calibrated with a 25 µm thick natural α-Fe foil. A line
255
width of 0.36 mm/s for the outer lines was obtained for α-Fe at room temperature. Analyzes
256
were performed at room temperature with measuring times from 7 hours to 5 days.
12
Fe3+/ΣFe in 14 olivine-hosted melt inclusions were determined using a synchrotron
258
Mössbauer source (SMS; Potapkin et al., 2012; Smirnov et al., 1997). Analyzes were carried
259
out at the Nuclear Resonance beamline ID18 (Rüffer and Chumakov, 1996) of the European
260
Synchrotron Facility, Grenoble. Melt inclusions were polished on both sides to avoid signal
261
contamination from their host crystal and were centered under a 20-30 µm hole drilled in a 25
262
µm-thick Re foil. Data were collected using a multi-bunch operating mode and a 10 × 15 µm2
263
focalized beam for 4.5 to 9 hours at room temperature. The SMS provided 57Fe resonant
264
radiation with the energy of 14.4125 keV and the bandwidth of ~13 neV tunable in the energy
265
range of about ± 0.3 µeV. The velocity scale was calibrated with a 25 µm-thick natural α-Fe
266
foil and the source line width was checked after each analysis. Spectra were fitted using MossA
267
software using a full transmission integral (Prescher et al., 2012).
268
The fitting methods applied to spectra collected using conventional Mössbauer and SMS
269
spectroscopy are further described in the Results section.
270
4.5. XANES analyzes
271Fe K-edge X-ray absorption near edge structure (XANES) were collected at the LUCIA
272
(Vantelon et al., 2016) beamline of SOLEIL synchrotron, France, during five different sessions
273
in 2014, 2015, 2017, 2018 and 2019. Data were collected in fluorescence mode between 7050
274
and 7300 eV, with 0.1 eV steps in the pre-edge region (7106–7120 eV). The excitation energy
275
was selected using a Si(311) or a Si(111) double crystal monochromator depending on the
276
analytical session, leading to a spectral energy resolution of 0.2 and 1 eV, respectively. The
277
monochromator was calibrated by setting the first inflexion point of a Fe metallic foil to
278
7112 eV. The beam was focused using KB mirrors down to ∼ 3 × 3 μm2 (Table 4 of the
279
Supplementary material). The fluorescence detector was a Bruker silicon drift diode
mono-280
element with a total active area of 60 mm2. The distance between the sample and the detector
13
was adjusted to ensure optimal counting rate for each sample. Samples were tilted at an angle
282
of 5° with respect to the incident beam. X-ray fluorescence (XRF) chemical maps were used to
283
select spots for XANES measurements. Spectra collected in anhydrous reference glasses during
284
each session were used to refine the alignment of the spectra collected during the different
285
cessions and to calibrate Fe3+/ΣFe ratios obtained from the pre-edge region of XANES spectra
286
collected on our unknown samples. For unknown samples, two consecutive XANES spectra
287
were collected at the same location. More details on the analytical conditions are given in Tables
288
4-5 of the Supplementary material.
289
Cottrell et al. (2018) demonstrated that hydrous glasses can be affected by beam-induced
290
oxidation depending on their H2O content, their initial oxidation state and the radiation dose
291
used to collect spectra. Therefore, during our 2019 session, we acquired XANES spectra on
292
hydrous glasses using different radiation doses ranging from 7.9 × 10⁵ to 2.4 × 10⁸
293
photons/s/µm². This was done by changing the beam size from 3.7 × 3 to 35 × 15 µm2 and/or
294
attenuating the beam flux by placing a 60 µm thick Al foil along the beam path (Tables 4-5 of
295
the Supplementary material). The radiation dose corresponds to the number of photons
296
delivered to the sample per square micrometer. The sample area exposed to radiation was
297
determined assuming that the beam had an elliptic shape. Melt inclusions were then analyzed
298
during that 2019 session with a 4 × 3 µm2 focused beam size using radiation doses of 3.7 × 10⁷
299
photons/s/µm².
300
To better constrain conditions at which beam-induced oxidation occurs, we tested for a
301
time dependent variation in the intensity of the pre-edge multiplets. Following Debret et al.
302
(2015) and Cottrell et al. (2018), we measured the peak amplitude at two fixed energies that
303
correspond to the energies of the Fe2+ and Fe3+ pre-edge peaks, respectively (7112.6 and 7114
304
eV), during 300 s. The duration of a time series acquisition corresponds to the time needed to
14
collect the pre-edge part of our XANES spectra. The time series were acquired at the same
306
conditions as the XANES spectra (Tables 4-5 of the Supplementary material).
307
XANES spectra were normalized and corrected for self-absorption using Athena
308
software (IFFEFIT suite; Ravel et Newville, 2005). Melt inclusion spectra were tested for
309
potential contamination from the host olivine crystal by carrying out a comparison with spectra
310
collected on synthetic glasses and using the principal component analysis procedure described
311
in Hartley et al. (2017) and Shorttle et al. (2015). The Fe3+/ΣFe ratios of samples were derived
312
by fitting the pre-edge region using PeakFit© software. The pre-edge region was fitted between
313
7108 and ∼7118 eV with two Gaussian peaks, constrained to have the same width and line
314
shape, simultaneously with the background, which was modeled as the tail of two other
315
Gaussian functions. The pre-edge centroid energies, integrated areas and intensity ratios
316
calculated as 𝐼𝐹𝑒3+/(𝐼𝐹𝑒3++ 𝐼𝐹𝑒2+) are reported in Table 6 of the Supplementary material. 317
Intensities collected as a function of time at 7112.6 and 7114 eV in the same sample were
318
normalized as I[(Fe3+)/[I(Fe3+)+I(Fe2+)]] = I(7114)/[I(7114)+I(7112.6)] in order to track the
319
evolution of the Fe3+/ΣFe ratios through time.
320
5. Results
321
5.1. Mössbauer spectroscopy
3225.1.1. Independent characterization of the Fe
3+/ΣFe ratios in reference
323glasses
324Several methods were tested to fit the Mössbauer spectra (e.g. Berry et al., 2018; Cottrell
325
et al., 2009) in order to define the best fitting method to apply to our data. The best fit as judged
15
by statistics and consistency of parameters across all spectra for reference glasses was obtained
327
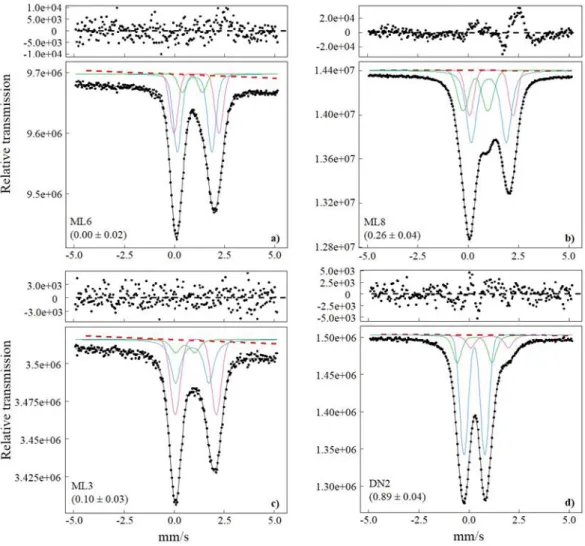
with three pseudo-Voigt doublets (Figure 1).
328 329
330
Figure 1: Results of the fitting procedure of four Mössbauer spectra collected for anhydrous
331
basaltic reference glasses (Table 1 of the Supplementary material). The Fe3+/ΣFe ratios of the
332
glasses are given in brackets. The red dashed line corresponds to the linear baseline. The black
333
line represents the modeled spectra. Blue, green and pink lines correspond to the three
pseudo-334
Voigt doublets used to characterize iron environments. For the most reduced glasses (a) the
335
three doublets are attributed to the Fe2+ environment. For reduced and oxidized glasses (b-c),
336
the green pseudo-Voigt doublet was attributed to the Fe3+ environment whereas the two others
337
were attributed to the Fe2+ environment. For the more oxidized sample (d), the pink
16
Voigt doublet was attributed to the Fe2+ environment whereas the two others were attributed to
339
the Fe3+ environment. Residuals obtained from the fitting procedure are given at the top of the
340
spectra.
341 342
The values for the center shift (δ), quadrupole splitting (∆) and the full width at half
343
maximum (FWHM) for each doublet were set as free to vary at first. Then, the FWHMs of the
344
three doublets were constrained to be equal when unrealistic values were obtained for hyperfine
345
parameters. Reduced χ² values range from 0.95 to 1.93. Values obtained for hyperfine
346
parameters are summarized in Table 7 of the Supplementary material. The values obtained for
347
the hyperfine parameters indicate that two doublets are attributed to the Fe3+ environment,
348
whereas one doublet is attributed to the Fe2+ environment in our most oxidized glass. In contrast,
349
two doublets are attributed to the Fe2+ environment and one doublet is attributed to the Fe3+
350
environment in the less oxidized glasses. Three doublets are attributed to the Fe2+ environment
351
in our most reduced glasses (e.g. Alberto et al., 1996; Berry et al., 2018; Cottrell et al., 2009;
352
Zhang et al., 2018); Table 7 of the Supplementary material). Fe3+/ΣFe ratios were obtained from
353
the relative area of each doublet. Determination of the 2σ uncertainty is based on both the
354
statistical uncertainty derived from the fit and the reproducibility given by results obtained from
355
the several tested methods. The fit results are reported in Table 7 and Figure 1.
356
The values obtained for the hyperfine parameters in our most reduced glass standards
357
suggest that no Fe3+ component is required. However, the doublets are characterized by broad
358
lines and the hyperfine parameters show a systematic overlap of the Fe2+ components that
359
suggests that a small amount of Fe3+ could be present in these reference glasses (Figure 1a).
360
Therefore, we conclude that we are not able to determine the iron speciation accurately in
361
glasses with < 10 % Fe3+/ΣFe, and for that reason we decided not to use those in our XANES
362
calibration (Table 1 of the Supplementary material).
17
5.1.2. Fe
3+/ΣFe in melt inclusions
364
Due to a limited beamtime, synchrotron Mössbauer source spectra collected on melt
365
inclusions have a lower signal to noise ratio than conventional Mössbauer spectra in the
366
reference glasses (Figure1-2). The consequence of this lower signal quality is that we were not
367
able to apply the same fitting method for melt inclusions and reference glasses (Figure 2).
368
However, in order to be as consistent as possible with the fitting procedure used for reference
369
glasses, spectra collected on melt inclusions were fitted using two pseudo-Voigt doublets,
370
where one doublet was attributed to the Fe2+ environment and the other one was attributed to
371
the Fe3+ environment. As for reference glasses, hyperfine parameters (δ and ∆) and the FWHM
372
of the doublets were first set as free to vary. Then, the FWHM of the doublets attributable to
373
the Fe3+ environment was fixed to 0.4 mm/s when unrealistic values were obtained for hyperfine
374
parameters. An asymmetric Lorentzian doublet with fixed hyperfine parameters was added to
375
the fitting procedure (Figure 2) to correct the spectra for 57Fe contamination from the Be lenses.
376
Reduced χ² values range from 0.86 to 1.15. Hyperfine parameters are summarized in Table 8 of
377
the Supplementary material.
378
Since the 57Fe contamination due to the Be lenses is larger for spectra collected on
iron-379
poor or thin melt inclusions, we tested for a correlation between the relative area of the
380
Lorentzian doublet from the Be lenses and the Mössbauer thickness of the different samples
381
(Table 9 and Figure 2 of the Supplementary material). The Mössbauer thickness is calculated
382
from the density (g/cm3), porosity (%), thickness (µm) and total iron content (in wt% of
383
element) of the sample (Long et al., 1983). The broad negative trend follows the expected
384
behavior of the two parameters, i.e. the area of the Lorentzian doublet increases as either the
385
iron content or the sample thickness decreases, confirming our approach to correct for 57Fe
386
contamination by the Be lenses.
18
Fe3+/ΣFe ratios were derived from the relative areas of each doublet and 2σ uncertainties
388
were calculated from the statistical fitting uncertainties reported by the software. Results are
389
shown in Table 3 of the Supplementary material.
390 391
392 393
Figure 2: Results of the fitting procedure applied to two room temperature Mössbauer spectra
394
collected on melt inclusions using the synchrotron Mössbauer source. The Fe3+/ΣFe ratios of
395
selected melt inclusions are given in brackets. The red dashed line corresponds to the quadratic
396
baseline. The black line represents the modeled spectra. The grey line is the Lorentzian doublet
397
used to correct spectra for 57Fe contamination from the Be lenses. Blue and green lines are the
398
pseudo-Voigt doublets attributed to the Fe2+ and Fe3+ environments, respectively. Residuals
399
obtained after the fitting procedure are given at the top of the spectra.
19
5.2. XANES
401
5.2.1. Calibration of the XANES spectra
402To derive Fe3+/ΣFe ratios from the pre-edge region of XANES spectra collected on
403
unknown samples, these spectra have to be calibrated using XANES spectra collected on
404
reference glasses with independently known Fe3+/ΣFe ratios (e.g. derived from Mössbauer
405
spectroscopy). In previous studies, the XANES calibration uses either the pre-edge centroid
406
energy (i.e., intensity-weighted energy) or the pre-edge intensity ratio (i.e., the ratio of the total
407
area of the Fe3+ peak [I(Fe3+)] to the sum of the areas of the Fe3+ peak [I(Fe3+)] and the Fe2+
408
peak [I(Fe2+)], or I(Fe3+)/[ I(Fe3+)+I(Fe2+)]). Pre-edge centroid energy-based calibrations are
409
less sensitive to changes in the coordination environment (Berry et al., 2003; Wilke et al., 2004),
410
however they are more sensitive to energy shifts that can occur during and between analytical
411
sessions (Cottrell et al., 2009). As spectra were collected on the same reference glasses during
412
every session, we were able to correct our spectra for any shift in energy between sessions (no
413
drift occurred within single sessions). Therefore, we applied the pre-edge centroid energy based
414
calibration to estimate the Fe3+/ΣFe ratios in the unknown samples.
415
Cottrell et al. (2009) also used a pre-edge centroid energy based calibration and found
416
that the use of a second order polynomial fit to their most oxidized reference glasses was
417
appropriate for their data. The use of this calibration leads to the determination of an average
418
Fe3+/ΣFe ratio of 0.16 ± 0.01 for MORB glasses (Cottrell and Kelley, 2011). More recently,
419
Berry et al. (2018) proposed that a linear calibration can be used to determine Fe3+/ΣFe of
420
MORB glasses when only considering the appropriate Fe3+/ΣFe range for MORBs (Fe3+/ΣFe <
421
0.3). They derived an average Fe3+/ΣFe ratio of 0.11 ± 0.02 for MORB glasses when they use
422
the linear calibration and 0.10 ± 0.02 when they use the polynomial calibration. Results derived
423
from these two calibrations are similar within error, which indicates that both calibrations can
20
be applied to determine Fe3+/ΣFe ratios in the unknown samples. These authors have also
425
proposed that the difference in the average Fe3+/ΣFe ratio in MORB glasses arises from the
426
method applied to fit the Mössbauer spectra of reference glasses. On the one hand, Cottrell et
427
al. (2009) fitted their Mössbauer spectra using two 2D-gaussian doublets, with one doublet
428
being attributed to the Fe2+ environment and the other one to the Fe3+ environment. On the other
429
hand, Berry et al. (2018) have proposed that a third doublet has to be attributed to the Fe2+
430
environment, in particular in the case of reduced samples, otherwise their Fe3+/ΣFe would be
431
over-estimated. In the current study, we used three doublets to fit the Mössbauer spectra
432
collected on our reference glasses and the third doublet was attributed to the Fe2+ environment
433
in our most reduced samples, therefore we expect that our derived Fe3+/ΣFe ratios are not
over-434
estimated.
435
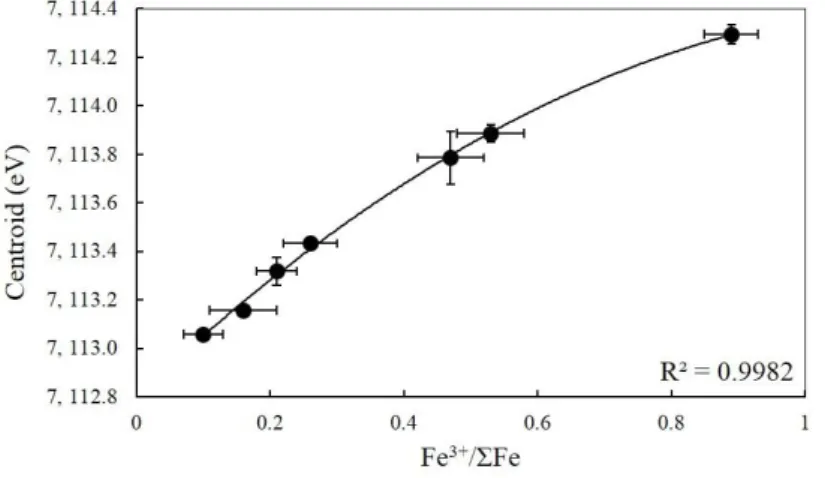
Fe3+/ΣFe ratios derived from XANES spectra were determined for our natural glass
436
samples from the centroid energy of the fitted pre-edge region using a polynomial calibration
437
derived from seven basaltic reference glasses (Figure 3; Table 1 of the Supplementary material).
438
As the Fe3+/ΣFe ratios of our more reduced standards are below the detection limit of Mössbauer
439
spectroscopy (<10 %), we did not use them in our calibration (Table 1 of the Supplementary
440
material).
441
The XANES calibration is given by the equation:
442 443 𝐸𝑐𝑒𝑛𝑡𝑟𝑜𝑖𝑑 = −1.0540 (𝐹𝑒3+⁄Σ𝐹𝑒)𝑀ö𝑠𝑠𝑏𝑎𝑢𝑒𝑟2+ 2.6146 (𝐹𝑒3+⁄Σ𝐹𝑒)𝑀ö𝑠𝑠𝑏𝑎𝑢𝑒𝑟+ 444 7 112.8004 (1) 445 446
in which 𝐸𝑐𝑒𝑛𝑡𝑟𝑜𝑖𝑑 corresponds to the centroid energy (in eV) and (𝐹𝑒3+⁄Σ𝐹𝑒)𝑀ö𝑠𝑠𝑏𝑎𝑢𝑒𝑟 is the
447
Fe3+/ΣFe value obtained by Mössbauer spectroscopy. This calibration is applicable to samples
448
with Fe3+/ΣFe ratios ranging between 0.10 and 0.90. The accuracy of the calibration was tested
21
by using one of our anhydrous experimental glasses (ML4; Table 1 of the Supplementary
450
material) as an external standard. The mean Fe3+/ΣFe ratio of 0.22 ± 0.02 (n=6) calculated for
451
the ML4 glass using this calibration is in good agreement with the Fe3+/ΣFe of 0.21 ± 0.03
452
obtained by Mössbauer spectroscopy. This result demonstrates that our calibration can be used
453
to determine Fe3+/ΣFe ratios of our unknown samples. The uncertainty on the ML4 glass is
454
reported as the 2σ standard deviation of the replicate analyzes. This uncertainty will then be
455
used as the 2σ error on the Fe3+/ΣFe ratios of our unknown samples.
456 457
458
Figure 3: XANES calibration curve for the determination of the Fe3+/ΣFe ratios of melt
459
inclusions and glasses. The solid curve is the second order polynomial fit result. Averaged
460
centroid energies and Fe3+/ΣFe ratios from Mössbauer spectroscopy of anhydrous basaltic
461
reference glasses are shown in Table 1 of the supplementary material. Error bars are reported
462
as 2σ uncertainties (Table 1 of the supplementary material).
463
5.2.2. Time series in hydrous synthetic glasses
464The measurement of the evolution of the pre-edge peak intensities with time at fixed
465
energies gives us access to the evolution of the iron speciation of glasses during the time
466
required to acquire the XANES pre-edge region, which, in our set-up, is about 5 minutes. The
467
time series allows us to spot the occurrence of beam damage during acquisition. Time series
22
collected on hydrous experimental glasses with water contents ranging from 0.02 ± 0.002 to
469
2.86 ± 0.34 wt% and equilibrated at various fO2 show no clear evidence of beam damage when
470
using radiation doses lower than 1.2 × 10⁸ photons/s/µm². When using higher doses, the time
471
series collected on water-rich glasses (≥ 2.48 ± 0.20 wt% H2O) show a systematic increase in
472
the intensity ratio I(7114)/[I(7114)+I(7112.6)] (Figure 4). As time series are collected at fixed
473
energies, the effect of beam-induced oxidation cannot be monitored using centroid positions.
474
However, when considering a XANES spectrum, the use of the centroid position allows us to
475
determine more accurate Fe3+/ΣFe ratios.
476
At 2.4 × 10⁸ photons/s/µm², time series collected on the BH1 glass (0.74 ± 0.02 wt%
477
H2O) also show an increase in its intensity. This suggests that beam damage can even occur for
478
very low water contents when using such high radiation doses.
23 480
Figure 4: Time series of the intensity ratio I(7114)/[I(7114)+I(7112.6)] collected over 300 s in
481
the most hydrous experimental glass BSN101117 - 2 (Table 2 of the Supplementary material)
482
using radiation doses from 7.9 × 10⁵ to 2.4 × 10⁸ photons/s/µm². No evidence of beam damage
483
is visible when using radiation doses lower than 1.2 × 10⁸ photons/s/µm². When using higher
484
radiation doses (≥ 1.2 × 10⁸ photons/s/µm²) beam damage effects are recorded as an increase in
485
the intensity through time. The overestimation of the Fe3+/ΣFe calculated from these time series
486
is 10% rel. and 15% rel. using 1.2 × 10⁸ and 2.4 × 10⁸ photons/s/µm² respectively.
24
We converted the intensity of absorption recorded in the time series into Fe3+/ΣFe ratios
488
using a calibration based on non-normalized pre-edge peak intensity ratios in the reference
489
glasses. Then we applied a linear regression through the variation of Fe3+/ΣFe with time to
490
calculate the over-estimation of Fe3+/ΣFe induced by beam damage. We find that Fe3+/ΣFe
491
ratios are over-estimated by 6 to 10 % rel. and 6 to 15 % rel. when using radiation doses of
492
1.2 × 10⁸ and 2.4 × 10⁸ photons/s/µm², respectively. The percentage of over-estimation of the
493
Fe3+/ΣFe ratios shows a poor positive correlation with the water content of glasses (Figure 5a)
494
and no correlation with their original Fe3+/ΣFe ratios (i.e., as determined from the pre-edge
495
centroid energy of a spectrum collected in non-damaging conditions (5.1 × 10⁶ photons/s/µm²;
496
Figure 5b). Cottrell et al. (2018) found that the beam damage susceptibility φ, which they define
497
as the product of the water concentration and the ferrous/ferric oxide ratio on a molar basis, is
498
positively correlated with the percentage of over-estimation of Fe3+/ΣFe ratios recorded for
499
hydrous glasses. Our data do not show such correlation (Figure 5c). The lack of correlation
500
between these parameters implies that we were not able to quantify the over-estimation of
501
Fe3+/ΣFe ratios for glasses analyzed using standard radiation doses (~108 photons/s/µm²) and
502
for which time series have not been collected.
25 504
Figure 5: Overestimation of the Fe3+/ΣFe ratios recorded by time series collected in hydrous
505
glasses as a function of (a) their water content, (b) their ‘initial’ Fe3+/ΣFe ratios determined in
506
non-photo-oxidizing conditions (5.1 × 10⁶ photons/s/µm²) and (c) the beam damage
507
susceptibility φ (φ = XHO0.5 × XFeO/XFeO1.5; Cottrell et al., 2018). Squares and triangles
508
represent the overestimation of Fe3+/ΣFe ratios recorded for radiation doses of 1.2 × 10⁸ and
509
2.4 × 10⁸ photons/s/µm², respectively. Errors given on water contents and ‘initial’ Fe3+/ΣFe
510
ratios are expressed as 2σ errors (Table 2 of the Supplementary material).
26
5.2.3. XANES spectra in hydrous synthetic glasses
512
We first compared the pre-edge features of XANES spectra successively collected at
513
the same location in our synthetic hydrous glasses to look for evidence for beam-induced
514
oxidation between the two consecutive spectra (Figure 6). Changes in the pre-edge feature
515
indicating that beam damage occurred during the acquisition were visible for water-rich glasses
516
(≥ 2.48 ± 0.20 wt% H2O) that were analyzed with radiation doses of 1.2 × 10⁸ and 2.4 × 10⁸
517
photons/s/µm². When we compared the Fe3+/ΣFe ratios obtained for these spectra, the
over-518
estimation of the Fe3+/ΣFe ratios derived from the second spectrum is systematically contained
519
in the 2σ uncertainty on these ratios. Similarly, we compared the Fe3+/ΣFe ratios obtained for
520
these spectra with their original Fe3+/ΣFe ratios (i.e., as determined from the pre-edge centroid
521
energy of a spectrum collected in non-damaging conditions of 5.1 × 10⁶ photons/s/µm²). The
522
over-estimation of Fe3+/ΣFe derived from XANES spectra that were affected by beam damage
523
(as evidenced by time series and modification of the pre-edge region of XANES spectra) lies
524
within the error except for BH7 at the highest radiation dose. We can also note that all the
525
glasses that show changes in the pre-edge feature between two consecutive spectra also show
526
evidence of beam induced oxidation in the time series. However, the inverse is not
527
systematically observed (and this might indicate that the photo-oxidation has reached a plateau
528
and/or that it is irreversible).
529
When no beam damage was detected either from the time series and/or the comparison
530
of the pre-edge regions of the two consecutive spectra, we calculated a mean Fe3+/ΣFe from the
531
two spectra collected at the same spot. 2σ uncertainties were calculated as the propagation of
532
the 2σ uncertainty of the Fe3+/ΣFe ratios of both spectra. On the other hand, when there was
533
evidence for oxidation from the difference in the two spectra, we discarded the value from the
534
second spectrum and only kept the Fe3+/ΣFe ratio derived from the first spectrum.
27 536
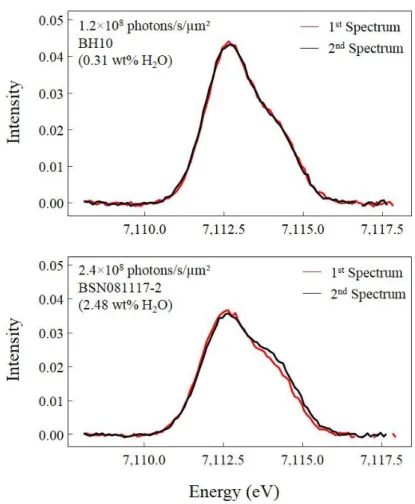
Figure 6: Pre-edge regions after baseline subtraction of two successive XANES spectra
537
collected at the same spot. The spectra shown here were collected in hydrous glasses BH10 and
538
BSN081117 - 2 (their water contents are given in brackets; Table 2 of the Supplementary
539
material) with radiation doses of 1.2 × 10⁸ and 2.4 × 10⁸ photons/s/µm², respectively. The first
540
and second spectra are shown in red and black, respectively. The two spectra collected in the
541
BH10 glass are identical. In contrast, the second spectrum collected in the BSN081117 - 2 glass
542
shows a small decrease in its Fe2+ component and an increase in its Fe3+ component compared
543
to the first spectrum, indicating beam damage.
544 545
When using a radiation dose of about 107 photons/s/µm², we record no evidence of
546
beam-induced oxidation from the time series and the two consecutive spectra. This indicates
547
that decreasing the radiation dose of about one order of magnitude provides more accurate
28
Fe3+/ΣFe ratios while still keeping the small beam size that is required for melt inclusion
549
analysis.
550
5.2.4. Determination of Fe
3+/ΣFe in melt inclusions
551Time series were collected using a radiation dose of 3.7 × 10⁷ photons/s/µm² in melt
552
inclusions that were large enough to accommodate several XANES spots. As we saw no
553
evidence for beam-induced oxidation in the hydrous experimental glasses at the same beam
554
conditions, we expected no beam damage in the melt inclusions. As expected, we found no
555
evidence for beam damage in the time series of most melt inclusions except for three arc melt
556
inclusions: the relative increase of the Fe3+/ΣFe ratio with time ranges from 6 to 63% rel. for
557
water contents ranging from 2.31 to 4.14 wt% (Table 3 of the Supplementary material). The
558
percentage of over-estimation of the Fe3+/ΣFe ratios does not, however, correlate with the water
559
content in the melt inclusions. One should note that the largest amount of over-estimation of
560
the Fe3+/ΣFe ratio (63% rel.) is comparable or sometimes lower than the 2σ uncertainties
561
attributed to the Fe3+/ΣFe ratios calculated from Mössbauer spectra. However, we have
562
demonstrated that the absolute Fe3+/ΣFe value calculated from the XANES spectrum is biased.
563
In addition to the time series, we also compared the pre-edge features of two spectra that
564
were successively acquired at the same location. Beam damage affecting the second spectrum
565
is clearly visible in eleven water-rich arc melt inclusions with water contents ranging from 2.31
566
to 4.59 wt%. Still, this effect is minimal and only one of them (inclusion SVP291c n4) shows
567
an over-estimation of its Fe3+/ΣFe ratio that is larger than the 2σ uncertainty on the Fe3+/ΣFe
568
ratio. Surprisingly this melt inclusion shows no clear evidence for beam damage in the time
569
series, which suggests that the first spectrum has not been affected by beam damage and that
570
the Fe3+/ΣFe ratio derived from it is reliable. In the end, more than half of the water-rich (> 1
29
wt% H2O) melt inclusions did not show modification of the pre-edge feature between the two
572
consecutive spectra.
573
When no sign of beam damage was recorded in the time series and/or in the comparison
574
of the pre-edge regions of two spectra collected on the same spot, we calculated a mean
575
Fe3+/ΣFe ratio from the two spectra. 2σ uncertainties were calculated as the propagation of the
576
2σ uncertainties of the Fe3+/ΣFe ratios of both spectra. When time series could not be collected
577
for lack of space in the inclusion, we calculated a mean Fe3+/ΣFe ratio from the two spectra
578
when their Fe3+/ΣFe ratios lie within the 2σ errors. Melt inclusions for which time series exhibit
579
evidence of beam damage were removed from our dataset. When melt inclusions have been
580
analyzed in different spots, mean Fe3+/ΣFe ratios were calculated using only the first spectra
581
collected at each spot when the time series didn’t record any beam damage. Results are given
582
in Table 3 of the Supplementary material.
583
6. Discussion
584
6.1. The effect of beam-induced oxidation on the determination of
585Fe
3+/ΣFe ratios in silicate glasses
586The time series collected on hydrous experimental glasses by XANES indicate that
587
beam damage systematically takes place at high water contents (≥ 2.5 wt% H2O) for durations
588
of 5 minutes and standard radiation doses (~108 photons/s/µm²; Figure 4). At lower water
589
contents (< 1 wt% H2O), beam damage is not systematically observed. Beam induced oxidation
590
recorded in the time series is usually, but not systematically, supported by changes in the
pre-591
edge feature between the two XANES spectra collected successively at the same location (one
592
spectrum acquisition lasts for 7 to 20 min; Figure 6), which suggests that the oxidation process
30
continues to occur during acquisition of the second spectrum. To explain the cases where time
594
series showed oxidation through time, but no change was noticeable between the pre-edge
595
features of the two spectra successively collected, we can make two hypotheses. The first
596
hypothesis is that beam damage is “completed” after full acquisition of the pre-edge (Cottrell
597
et al., 2018). The second hypothesis is that the modification due to beam damage is not
598
systematically large enough to be visible given our spectral resolution. The Fe3+/ΣFe ratios
599
calculated for hydrous experimental glasses from their pre-edge centroid energies suggest that
600
the effect of this process may be within the error associated with the calculation of these ratios.
601
However, based on time series, an over-estimation of Fe3+/ΣFe of about 15 % rel. may occur
602
when using a radiation dose of 2.4 × 10⁸ photons/s/µm². Thus, the Fe3+/ΣFe ratios of melt
603
inclusions, and especially of arc melt inclusions that are usually water-rich, will likely be
over-604
estimated when analyzing them with such doses.
605
A large number of melt inclusions have been analyzed with standard radiation doses
606
(~108 photons/s/µm²) during our first synchrotron sessions. At the time, as we did not realize
607
how large the effects of beam damage could be, we did not systematically collect time series.
608
The lack of or the poor correlation between the chemical composition of glasses (in particular
609
their H2O contents and/or initial Fe3+/ΣFe) and the over-estimation of the Fe3+/ΣFe ratios
610
recorded by time series collected on hydrous synthetic glasses (Figure 5) means that we are not
611
able to quantify the over-estimation that potentially affected the Fe3+/ΣFe ratios derived from
612
XANES spectra collected on these melt inclusions using standard beam conditions. Therefore,
613
we were not able to correct them and we decided not to use them.
614
Time series collected on hydrous experimental glasses using radiation doses lower than
615
~108 photons/s/µm² do not show any evidence for oxidation. However, time series acquired in
616
three hydrous melt inclusions using a radiation dose of 3.7 × 10⁷ photon/s/µm² show evidence
617
of beam damage. Moreover, melt inclusions that exhibit an over-estimation of the Fe3+/ΣFe
31
ratio derived from the second spectrum compared to the first one do not systematically display
619
an evolution of the speciation through time in the time series. These observations corroborate
620
the ones carried out by Cottrell et al. (2018) showing that lowering the radiation dose to about
621
~107 photons/s/µm² allows us to mitigate but not definitively eliminate beam-induced oxidation
622
during XANES analyzes. Using these more appropriate beam conditions, only three melt
623
inclusions out of thirty show clear signs of beam damage during the acquisition of the first
pre-624
edge spectrum.
625
6.2. Fe
3+/ΣFe inferred from Mössbauer vs. XANES spectroscopy
626For the first time, the Fe3+/ΣFe ratios of olivine-hosted melt inclusions were determined
627
by Mössbauer spectroscopy. Despite counting times of 4.5 to 9 h, the limited thickness of our
628
melt inclusions resulted in much larger uncertainties in Fe3+/ΣFe than the ones determined for
629
reference glasses using conventional Mössbauer spectroscopy (Tables 1 and 3 of the
630
Supplementary material). The difference can be explained by the lower signal to noise ratio of
631
spectra collected on melt inclusions (Figure 1-2). Furthermore, these uncertainties are even
632
larger for the most reduced melt inclusions (Fe3+/ΣFe < 0.15; Figure 3 of the Supplementary
633
material). The increased uncertainties with decreasing Fe3+/ΣFe ratio are explained by
634
decreasing signal to noise ratio with decreasing Fe3+ content in the melt inclusions.
635
Figure 7 shows the comparison between Fe3+/ΣFe ratios obtained by synchrotron
636
Mössbauer source and XANES spectroscopy.
32 638
Figure 7: Fe3+/ΣFe ratios from Mössbauer spectroscopy compared to those from XANES
639
spectroscopy. Here we report data from MORB and OIB melt inclusions from the Gakkel ridge
640
(black triangles) and Piton de la Caille (Reunion island; grey squares), arc melt inclusions from
641
Aoba (empty circles), Mount-Meager (squares), La Sommata (inverted triangles) and melt
642
inclusions from Mount Etna (diamonds). Errors bars are reported as 2σ uncertainties (Table 3
643
of the Supplementary material).
644 645
The figure shows that Fe3+/ΣFe ratios derived from these two methods mostly overlap within
646
the 2σ uncertainties, with a distribution close to the 1:1 line. Nevertheless, we note that the
647
absolute Fe3+/ΣFe values calculated from Mössbauer spectra are generally lower than the ones
648
obtained from XANES. Only two arc melt inclusions from Aoba (inclusions Ao17-D6 and
Ao-649
T8) show significantly lower Mössbauer-derived Fe3+/ΣFe. The first hypothesis we can make
650
is that these two melt inclusions were oxidized during XANES analysis. However, we see no
651
evidence for beam-induced oxidation in the time series nor in the comparison of two
652
consecutive spectra. A second hypothesis is that a small proportion of host olivine was sampled
653
by the beam during Mössbauer analyses. The spectra collected in the Ao-T8 melt inclusion do
654
not show evidences of signal contamination from the host olivine (Figure 2). Thus, it is more
655
likely that the Fe3+/ΣFe ratio obtained from Mössbauer spectroscopy in Ao-T8 is
33
underestimated because of the low signal to noise ratio and increased error. The poor signal to
657
noise ratio of the spectra collected in the Ao17-D6 melt inclusion does not allow us to be as
658
definitive as for the spectra collected in the Ao-T8 melt inclusion (Figure 4 in the supplementary
659
material).
660
Generally, the comparison of Fe3+/ΣFe ratios inferred from these two methods seems to
661
indicate that we managed to detect beam damage when it occurred during XANES analysis.
662
However, the fact that the Fe3+/ΣFe ratios obtained by Mössbauer spectroscopy exhibit larger
663
uncertainties because of the low spectral resolution indicates that we are not able to determine
664
precise Fe3+/ΣFe ratios using synchrotron Mössbauer yet, unless we increase counting times
665
significantly.
666
6.3. The oxidation state of melt inclusions
667In order to discuss further the oxygen fugacity at which melt inclusions equilibrate, their
668
compositions have to be corrected for post-entrapment modification. Melt inclusions were
669
corrected for host crystallization and/or ‘Fe loss’ using Petrolog3 software (Danyushevsky and
670
Plechov, 2011). Details on the correction method used in this study are available in the
671
Supplementary material. Corrected compositions and ‘original’ Fe3+/ΣFe ratios are reported in
672
Table 3 of the Supplementary material.
673
Our results show that melt inclusions from MORB display a mean Fe3+/ΣFe ratio of
674
0.10 ± 0.05 (n=5). Melt inclusions from OIB and arcs display mean Fe3+/ΣFe ratios of
675
0.13 ± 0.05 (n=2) and 0.25 ± 0.15 (n=19) respectively. Mount Etna is not classified as an arc
676
volcano and has a more complex geodynamic setting than the other volcanoes presented in this
677
study. Many authors suggested that Mount Etna has an OIB signature but for which the mantle
678
is metasomatized by subduction-derived fluids. Nevertheless, the composition of the mantle
679
beneath Mount Etna is still debated (e.g. Correale et al., 2014; Schiano et al., 2001; Schiavi et

![Figure 4: Time series of the intensity ratio I(7114)/[I(7114)+I(7112.6)] collected over 300 s in 481](https://thumb-eu.123doks.com/thumbv2/123doknet/14028238.457902/24.892.304.597.106.781/figure-time-series-intensity-ratio-i-i-collected.webp)