Publisher’s version / Version de l'éditeur:
Chemistry of Materials, 29, 13, pp. 5727-5735, 2017-06-21
READ THESE TERMS AND CONDITIONS CAREFULLY BEFORE USING THIS WEBSITE.
https://nrc-publications.canada.ca/eng/copyright
Vous avez des questions? Nous pouvons vous aider. Pour communiquer directement avec un auteur, consultez la
première page de la revue dans laquelle son article a été publié afin de trouver ses coordonnées. Si vous n’arrivez pas à les repérer, communiquez avec nous à [email protected].
Questions? Contact the NRC Publications Archive team at
[email protected]. If you wish to email the authors directly, please see the first page of the publication for their contact information.
NRC Publications Archive
Archives des publications du CNRC
This publication could be one of several versions: author’s original, accepted manuscript or the publisher’s version. / La version de cette publication peut être l’une des suivantes : la version prépublication de l’auteur, la version acceptée du manuscrit ou la version de l’éditeur.
For the publisher’s version, please access the DOI link below./ Pour consulter la version de l’éditeur, utilisez le lien DOI ci-dessous.
https://doi.org/10.1021/acs.chemmater.7b02014
Access and use of this website and the material on it are subject to the Terms and Conditions set forth at
Two-step nucleation of CdS magic-size nanocluster MSC–311
Zhu, Tingting; Zhang, Baowei; Zhang, Jing; Lu, Jiao; Fan, Hongsong; Rowell,
Nelson; Ripmeester, John A.; Han, Shou; Yu, Kui
https://publications-cnrc.canada.ca/fra/droits
L’accès à ce site Web et l’utilisation de son contenu sont assujettis aux conditions présentées dans le site LISEZ CES CONDITIONS ATTENTIVEMENT AVANT D’UTILISER CE SITE WEB.
NRC Publications Record / Notice d'Archives des publications de CNRC:
https://nrc-publications.canada.ca/eng/view/object/?id=22bccd04-9e96-4587-9499-a81ee1778e13 https://publications-cnrc.canada.ca/fra/voir/objet/?id=22bccd04-9e96-4587-9499-a81ee1778e13Two-Step Nucleation of CdS Magic-Size Nanocluster MSC−311
Tingting Zhu,
†,⊥Baowei Zhang,
†,⊥Jing Zhang,
†Jiao Lu,
‡Hongsong Fan,
‡Nelson Rowell,
§John A. Ripmeester,
§Shuo Han,
*
,†and Kui Yu
*
,†,‡,δ†
Institute of Atomic and Molecular Physics, Sichuan University, Chengdu 610065, P. R. China ‡
Engineering Research Center in Biomaterials, Sichuan University, Chengdu 610065, P. R. China §
National Research Council of Canada, Ottawa, Ontario K1A 0R6, Canada
δSchool of Chemical Engineering, Sichuan University, Chengdu 610065, P. R. China
*
S Supporting InformationABSTRACT: Nucleation has been generally acknowledged as a rapid but uncontrollable process that is difficult to decouple from the subsequent growth phase. Here, we report our finding that nucleation of semiconductor magic-size clusters (MSCs) can be well-regulated, without a subsequent evolution in size. Colloidal semiconductor CdS MSCs were synthesized by a two-step approach intentionally designed, without the simultaneous formation of nanocrystals of other sizes. The nuclei MSCs exhibit a sharp optical absorption peaking at 311 nm and are thus denoted by MSC−311. We prepared the immediate precursor for MSC−311 denoted by IP311 which is liquid-like, through a reaction which was normally performed to grow CdS conventional quantum dots
(QDs), but at a different temperature (180 °C) prior to the nucleation and growth of CdS QDs. We demonstrate that the nucleation of MSC−311 from IP311 followed first order kinetics remarkably well, and the presence of a small amount of methanol accelerated this process effectively. Moreover, the liquid-like prenucleation cluster IP311 and the nuclei MSC−311 have similar masses. Accordingly, we propose that the intramolecular reorganization of IP311 results in the nuclei MSC−311, the formation of which features a two-step nucleation pathway. The present study introduces methodology via absorption spectroscopy to monitor the nucleation kinetics of semiconductor MSCs from their immediate precursors. The repeatable, predictable, and controllable nucleation process investigated here brings a deeper insight into nucleation of other semiconductor nanocrystals and contributes to the foundation for the future development of advanced theoretical models for crystal nucleation.
C
rystallization is fundamental to many processes in nature and in industry.1−12Nucleation in solution, the process of which consists of a phase transformation, plays a decisive role in regulating the resulting crystal properties (such as size and size distribution). A two-step model,1−9
instead of the one-step model employed in the classical nucleation theory (CNT),10−12
has recently been applied to understand the fundamentals of nucleation in various systems, such as proteins,2,5small organic molecules,3,6 biominerals,4,7,8 and noble metals.9The two-step process accounts for the existence of prenucleation clusters which are liquid-like. However, to the best of our knowledge, for all experimentally reported materials which have con-tributed to the development of the two-step model, it is yet uncertain how to assess the progression from prenucleation clustering to the nucleation stage and further to the postnucleation growth which takes place rapidly. Accordingly, it has been a grand challenge to understand nucleation kinetics even with the aid of the advanced two-step mechanism that has been published.1−9
The present study endeavors to explore nucleation kinetics in a different material system, in which the nucleation period is decoupled from the prenucleation cluster stage and the growth phase (as shown byScheme S1).
Colloidal semiconductor quantum dots (QDs) are of great utility for their size-dependent absorption properties and have received considerable attention since the 1990s in view of their technological potential.13−20
Much effort has been directed toward the synthesis of conventional, regular quantum dots (RQDs), in particular attempting to control their size and size distribution.21−23
Much less attention has been paid to the formation of semiconductor magic-size clusters (MSCs), which are single-sized and consist of a discrete number of atoms.24−39
The bandgap absorption of the former (RQDs) is much broader than that of the latter (MSCs), due to the unavoidable size distribution of RQDs. In a specific synthesized batch, RQDs are sometimes produced along with MSCs. Studying MSCs should be able to improve our understanding of the nucleation and growth of QDs in a synthetic batch.
For the cadmium sulfide (CdS) MSCs reported to date, they were usually produced together with CdS RQDs.21,25,26,30,32,37 The first report on the observation of CdS MSCs, which were present along with RQDs from a reaction mixture of
Received: May 15, 2017
Revised: June 7, 2017
Published: June 21, 2017
Cd(ClO4)2·6H2O and H2S in water or alcohol, was in 1984.21
However, the relation between the growth of the MSCs and RQDs was not addressed.21In 2008, a two-phase synthesis in a mixture of toluene and water was presented to generate CdS RQDs together with MSCs which exhibited an optical absorption peaking at 311 nm.25The MSCs were claimed to
be the critical nuclei of the RQDs in that work.25
However, there does not appear to be a consensus with regard to the relation between the growth of MSCs and RQDs. In addition to the conjecture that MSCs were the actual nuclei of RQDs,25 it was suggested that MSCs provided key intermediates for the growth of existing RQDs30,39 or that MSCs were essentially a “dead end” product in equilibrium with monomers.31The definition of monomers (such as Cd1S1
or Cd2S2) can be found elsewhere.40
−45
Very recently,46a study was conducted on the induction period prior to nucleation and growth of cadmium telluride (CdTe) RQDs. This study suggested that CdTe MSC precursors were formed in the induction period. Yet, there was a lack of data regarding the mass of both the precursor proposed and the MSC detected by absorption; furthermore, the kinetics of the evolution of the MSC from the precursor has not been dealt with. Such information would provide a more in depth insight regarding the transformation of the precursor into the MSC.
Here, we report our investigation on the nucleation of CdS MSCs that exhibit a sharp absorption peaking at 311 nm. In view of this optical characteristic, we will refer to such MSCs as MSC−311 in the present study. They occurred in a single-size form. As source materials, we used cadmium oxide (CdO) and elemental sulfur. The synthesis consisted of two distinct steps, as illustrated inScheme 1. The first step involves a reaction in 1-octadecene (ODE) which was heated from room temperature to 180 °C where the reaction was held for approximately 20 min, with cadmium oleate (Cd(OA)2) and SODE as Cd and S
precursors, respectively. These conditions were critical as longer reaction periods or higher reaction temperatures
would have led to nucleation and growth of CdS RQDs. When the reaction temperature was ∼160 °C, the absorbance of our reaction mixture started increasing for wavelengths shorter than 310 nm (more than the superimposed absorption of the two precursors), suggesting the onset of the formation of Cd−S bonds. The methodology developed here to monitor the onset of the evolution of Cd−S bonds was effective and should be applicable to other semiconductor syntheses. In the second step, the reaction product (without the presence of CdS RQDs) was dispersed in a solvent such as toluene (Tol) or cyclohexane (CH). The nucleation of CdS MSC−311 in the dispersion was monitored in situ by absorption spectroscopy at room temperature. A continuous increase of the absorbance at 311 nm was accompanied by a simultaneous decrease of the optical density (OD) around 290 nm and a concurrent redshift of the absorption peak which finally stabilized at 311 nm. We observed that the evolution of MSC−311 in dispersion could be efficiently accelerated by adding a small amount of methanol. Interestingly, only first order reaction equations are able to describe precisely the rate of the development of the absorbance at 311 nm. For this reason, we hypothesize that intramolecular reorganization is responsible for the formation of MSC−311 from its immediate precursor, which is denoted by IP311. The formation of IP311, exhibiting absorption at wavelengths shorter than 310 nm, took place in the induction period at ∼180 °C prior to nucleation and growth of CdS RQDs. A matrix-assisted laser desorption/ionization time-of-flight (MALDI-TOF) mass spectrometry (MS) study indicated that the IP311 and MSC−311 species have similar masses. The present study introduces a synthetic approach for the growth of MSCs in a single-size form, develops a method to study nucleation kinetics, and brings an in depth understanding of the nucleation of CdS MSC−311, the formation of which follows a two-step pathway and features first order kinetics.
Scheme 1. Schematic Drawing Illustrating the Two-Step Approach to CdS Magic-Size Nanoclusters (MSCs) in a Single-Size Form without the Presence of Other Size Nanocrystalsa
aThe MSCs exhibit a sharp absorption peaking at 311 nm and are thus denoted as MSC−311. When the reaction mixture consisting of the Cd and S
precursors is heated, Cd−S bonds form at ∼160 °C. After the reaction is kept at 180 °C for about 20 min, the mixture of the MSC−311 immediate precursor (IP311) is cooled to room temperature and dispersed into a solvent such as toluene or cyclohexane. Slowly, nucleation took place and MSC−311 developed with a first order reaction rate as monitored by UV−vis absorption spectroscopy. When the reaction is kept at 180 °C for longer periods or at higher temperatures, conventional QDs (RQDs) form. The formation of MSC−311 follows a two-step nucleation model.
Chemistry of Materials Article
DOI:10.1021/acs.chemmater.7b02014
Chem. Mater. 2017, 29, 5727−5735 5728
■
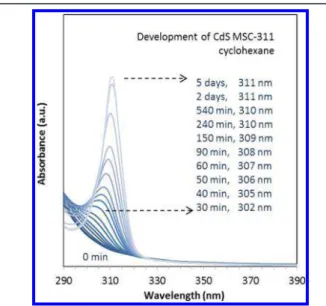
RESULTS AND DISCUSSIONFigure 1 illustrates the result from our in situ UV−vis spectroscopic study of the temporal evolution of the absorption
of one reaction mixture dispersed in cyclohexane at room temperature. The mixture was preheated at 180 °C for about 20 min, with a feed molar ratio of 4 to 1 of Cd(OA)2to S in ODE
and a feed S concentration of 30 mmol/kg. Afterward, about 3.7 mg of the reaction mixture was sampled and stored at −196 °C for 4 days. It is noteworthy that the samples used forFigures 2−4 were prepared under the same condition but stored at −196 °C for only 2 days. After the mixture was dispersed in 3 mL of cyclohexane, the absorption was monitored in situ for days at room temperature. At the very beginning (0 min trace), there was no significant absorption detected at wavelengths longer than 310 nm from the dispersion. Slowly but steadily, the absorbance at 311 nm increased. After approximately 2 days, the sharp absorption peaking at 311 nm became well developed, with the full width at half-maximum (fwhm) of about 10 nm. The monotonic increase of the absorbance at 311 nm, accompanied by the continuous redshift of the absorption peaks, can be explained by the gradual formation of MSC−311. Furthermore, along with the increase of the absorbance at 311 nm, there was a correlated, significant decrease of the absorbance at 290 nm.
When other aprotic solvents such as toluene were used instead of cyclohexane, similar development patterns were observed (such as shown in Figure S1-1). The development rate of MSC−311 in toluene was obviously faster than that in
cyclohexane; the underlying reason might be related to polarity and the possible presence of moisture as an impurity. The exact peak position of the absorption of MSC−311 dispersions varied slightly over about ±3 nm; such variation seemed to be affected by factors such as the nature of the dispersing solvent, the sample concentration, and the temperature.
It is noteworthy that all the MSCs produced in the dispersions are single-sized and do not coexist with other-size nanocrystals. We hereby propose a model to describe the development of CdS MSC−311, as represented ineq 1, which was reflected in the continuous increase of the absorbance at 311 nm with the concurrent decrease of the absorbance at 290 nm,
→ −
IP311 MSC 311 (1)
where IP311 was formed at ∼180 °C exhibiting little significant absorbance at 311 nm (0 min trace of Figure 1). The slow development of MSC−311 from IP311 suggests a two-step nucleation process (such as shown inFigure S1-2a), which is contrary to the one-step nucleation model.10−12
The present step nucleation pathway is similar to those published two-step nucleation models (Scheme S1).1−9
Our experimental observation of a continuous absorption redshift with an increment smaller than 0.5 nm (Figure 1and Figure S1-1) does not agree with the expected bandgap redshift if it had been due to the addition of Cd−S pairs. Based on the empirical equation proposed for the relation between the bandgap absorption peak position (nm) and radius of CdS RQDs,47we estimated the magnitude of the redshift that would
have occurred after a hypothetical addition of a single Cd−S pair (Figure S1−2b). For those assumed CdS RQDs whose absorption was peaked between 300 and 311 nm, the addition of a Cd−S pair would have led to a bandgap redshift larger than 1 nm; thus, the redshift pattern would have been in discrete rather than continuous steps. For this reason, the continuous redshift, with the shift which was less than 0.5 nm detected during the development of MSC−311 (Figures 1 and S1), should not be attributed to the growth via the addition of single Cd−S pairs. We propose that this specific redshift is caused by intramolecular reorganization. Our in situ experimental detection of the time-dependent change of the absorption, together with our examination on the redshift, facilitates our understanding of the MSC−311 formation; such comprehen-sion could contribute to the study of crystal nucleation from solution in a general way.1−12
Usually, kinetic studies enhance our in depth understanding of reaction pathways. In order to understand the formation pathway of MSC−311, we explored further the reaction kinetics of eq 1. First of all, the concentration dependence of the absorbance at 311 nm (below 1.0) was tested via dilution experiments for well-developed MSC−311 in toluene or cyclohexane dispersions (Figure S2−1). Clearly, the absorbance at 311 nm exhibits a linear relationship with the concentration of MSC−311 in dispersion. Thus, our kinetic study was conducted using the absorbance obtained at 311 nm, the range of which matches the Beer−Lambert Law. IP311 samples of five different amounts ranging from 13.0 mg to 34.8 mg were dispersed in 3 mL of toluene at room temperature (298 K). Figure S2-2shows the absorption spectra collected in situ from the five dispersed samples, at 4 min time intervals up to a maximum elapsed time of 196 min.
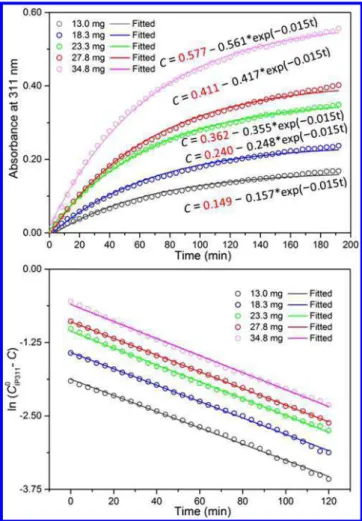
Figure 2a illustrates the time-dependent absorbance at 311 nm of the five dispersions (open circles with five different Figure 1.In situ absorption spectroscopy study of the development of
CdS MSC−311 in cyclohexane at room temperature from a reaction mixture which was preheated at 180 °C for 20 min. The feed molar ratio of the mixture was 4Cd(OA)2 to 1S in ODE and the feed concentration of S was 30 mmol/kg. About 3.7 mg of the preheated reaction mixture was stored at −196 °C for 4 days, before being dispersed in 3 mL of cyclohexane. The time-resolved spectra are presented with the color change from dark blue (0 min) to light blue (5 days). At 0 min, the sample, IP311, exhibited no significant absorption at 311 nm. It took about 2 days for the formation of MSC− 311, as indicated by the development of the absorption peaking at 311 nm. The development period and the corresponding peak position are denoted. The increase of the absorbance at 311 nm is coupled with the decrease of the absorbance at 290 nm and the redshift of the absorption peak position to 311 nm.
colors; up to 196 min). The development of MSC−311 fits the first order reaction equations, shown byeqs 2and3.
= − − C C C exp( k t) IP3110 IP3110 1 (2) − = − + C C k t I ln( IP3110 ) 1 (3) where C is the time-dependent absorbance at 311 nm detected after subtracting the background absorbance at 311 nm (t = 0 min). The quantity CIP3110 represents the initial amount of
IP311 calculated, which should be equal to the final amount of MSC−311 produced, k1is the rate constant, and I is a constant.
The five fitted curves fromeq 2are shown inFigure 2a as lines with colors corresponding to those of the data symbols. The values of CIP3110 highlighted in red inFigure 2a were used for
Figure 2b. Figure 2b contains the time dependent ln(CIP3110 −
C) (open circles with the same color convention as previous), together with the first order reaction equation fits based oneq 3. The slope of the fitted lines represents the negative rate constant. We show times only up to 120 min as the absorbance
change for times beyond 120 min is below the sensitivity limit (0.001) of absorbance.
For each of the five dispersions, the reaction of IP311 → MSC−311 occurred meticulously obeying a first order kinetic model, with a rate constant k = 0.015 min−1and t
1/2= 46 min,
independent of the initial sample concentration. With the values of CIP3110 calculated and highlighted in red in Figure 2a,
the bottom right part in Figure S2-2 reveals a nearly linear relationship between the amount of CIP3110 and the weight of the
IP311 sample used. The reproducibility of the kinetic study was reasonably high as shown in Figure S2-3. Accordingly, the reaction IP311 → MSC−311 follows closely a first order kinetics model; it thus seems reasonable that a single IP311 results in the production of a single MSC−311 via intra-molecular reorganization. To the best of our knowledge, there are a few types of reactions whose kinetics are described adequately by first order reaction equations, including intra-molecular reorganization and decomposition reactions.35,48−50
It is of further relevance that the reaction of IP311 → MSC− 311 was accelerated by the presence of a small amount of methanol (MeOH). Figures S3−1 and S3−2 show the absorption spectra in situ collected without or with the presence of a small amount of MeOH. The pattern of the absorption evolution, which could be attributed to the development of MSC−311, is not influenced by the presence of MeOH, except that the peak position settled at 308 nm instead of 311 nm.
Figure 3 shows our kinetic analyses of the development of MSC−311 accelerated by methanol, the quantity of which
ranged from 0.67 to 2.69 μL in a mixture with toluene upon a total volume of 3.00 mL. The sample (20 μL) was preheated under the same experimental conditions as those forFigure 1. In a manner similar to the analyses shown in Figure 2, the evolution of the absorbance at 308 nm of the four reactions was fitted with first order reactioneq 3.
Figure 2.Kinetic data from the growth of CdS MSC−311 at room temperature (298 K) with five identical samples in 3 mL of toluene; the sample weights are indicated. (a) Time-dependent absorbance at 311 nm (open circles, C, with the deduction of the background absorbance (0 min) at 311 nm (Figure S2-2)) collected from the five dispersions and fitted by first order reaction (eq 2) represented by the gray, blue, green, red, and magenta lines for the samples of 13.0 mg (gray), 18.3 mg (blue), 23.3 mg (green), 27.8 mg (red), and 34.8 mg (magenta). (b) Time-dependent ln(C0 − C) (corresponding open circles) with CIP3110 values are the red numbers in (a). The corresponding linear fitting (corresponding lines) is based on the first order reaction ofeq 3.
Figure 3. Kinetic data from the methanol-accelerated formation of CdS MSC−311 in toluene. Similar to that shown inFigure 2, CIP3110 was obtained according toeq 2. Here, C is the absorbance at 308 nm with the correction of the background absorbance at 308 nm at 0 min (Figure S3-1). The four amounts of MeOH used are indicated with four different colors. The time dependent ln(CIP3110 −C) (open circles with the corresponding colors; up to 60 min due to the practical sensitivity limit of the absorbance of 0.001), together with the first order reaction equation fitting based on eq 3 (lines with the four corresponding colors), provides the four corresponding rate constants.
Chemistry of Materials Article
DOI:10.1021/acs.chemmater.7b02014
Chem. Mater. 2017, 29, 5727−5735 5730
From this analysis, the rate constant for the formation of MSC−311 was found to increase from 0.028 min−1 to 0.037
min−1, along with an increase of the amount of MeOH from
0.67 to 2.69 μL. These rate constants are larger than the rate constant obtained in the absence of MeOH (which is 0.015 min−1as presented in Figure 2). Evidently, the addition of a
relatively small amount of MeOH effectively speeded up the development of MSC−311, particularly, within the early stage (Figure S3-3). Here, the small amount of MeOH seems to have played the role of a “catalyst”. Thus, we propose a proton-mediated ligand loss mechanism for the intramolecular reorganization of IP311 → MSC−311, which could be facilitated by the presence of a small amount of an acidic proton containing agent such as MeOH via partial ligand exchange. The surface ligand exchange, partially with MeOH, was reported previously.35,51−54
It is helpful to summarize briefly that when the cationic (M) and anionic (E) precursors are mixed with each other, their interaction leads to the formation of “micellar-like” aggregates of ∼1 nm in size and then to the development of covalent bonds between the M and the E atoms with no signficiant change in size of the “liquid-like” aggregates.46 Here, the “liquid-like” IP311 aggregate has Cd−S bonds formed, similar to the previously proposed Intermediate 2with Cd−Te bonds developed.46We concluded
that there was a general mechanism of proton-mediated ligand exchange (of HY molecules with Y = OR, OOCR, SR, PPh2,
and NRH) that was responsible for the formation of colloidal QDs including MSCs, with the detailed evolution demonstrated for the formation of M2Enmonomers.42
−45
Our proposed Yu Pathway,42−46from the self-assembly of the M and E precursors
to the formation of monomers and then QDs upon proton-mediated ligand exchange, explains well the experimental observations which include those associated with the use of H2O to facilitate the formation of QDs55and the use of ROH
for MSC−311 in the present study. Apparently, further study is needed to comprehend the chemistry on the molecular level which is involved in the nucleation of MSC−311 from IP311, together with the surface ligands and the chemical identity of the surface atoms of both IP311 and MSC−311.
To further explore the innovative concept of the nucleation of MSC−311 from its immediate precursor IP311, we have monitored their “molecular weights” by MALDI-TOF mass spectroscopy. Both IP311 and MSC−311 were characterized at a low laser power (50%).Figure S4−1shows that both IP311 and MSC−311 are quite stable in the range of the lasing power applied. Figure 4 presents the mass spectra collected from IP311 and MSC−311 in the m/z range of 4000 to 6500 Da. Remarkably, each of the two samples exhibited a molecular ion peak at ∼5167 Da. It is expected that the species detected did not have surface ligands, as has been reported.56,57Therefore, it appears that IP311 and MSC−311 are quite similar in the molecular weight and chemical composition. Moreover, we have inspected the nucleation process from IP311 to MSC− 311 by MALDI-TOF MS. Each of the four intermediate samples tested during the development of MSC−311 exhibited a molecular ion peak at ∼5167 Da (Figure S4-2).
Therefore,Figures 2−4support the novel perception that the nucleation of a single IP311 results in a unique single MSC− 311 via intramolecular reorganization by a proton-mediated ligand loss mechanism. Conventional characterization of MSC−311 was performed, such as X-ray photoelectron spectroscopy (XPS), X-ray powder diffraction (XRD), and
transmission electron microscopy (TEM) (Figures S4−3 to S4−5).
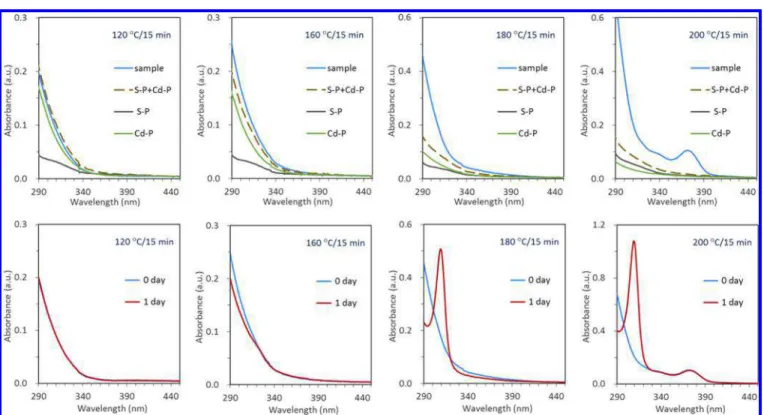
Let us turn our attention to the formation of IP311. It will be meaningful to probe the onset of the formation of Cd−S bonds. As shown in Scheme 1, our synthetic approach is a heating process. Three experimental batches were designed, the absorption of which are presented in Figure 5. The green traces were obtained from a batch of the Cd precursor with a concentration of 120 mmol/kg. The gray traces were from a batch of the S precursor with a concentration of 30 mmol/kg. The blue traces were from a batch of the Cd and S precursors with a 4 to 1 feed molar ratio and a S concentration of 30 mmol/kg. Each of the three batches had the same weight of 5 g. We will now refer to the batches by the colors of their traces. The green (without the S precursor) and gray (without the Cd precursor) batches can be considered as the two background batches of the blue batch (with both the Cd and S precursors). Samples (25 μL) from the three batches were taken at 120 °C, 160 °C, 180 °C, and 200 °C, with each of these temperatures being held for 15 min. Afterward, the samples were dispersed in 3 mL of toluene and studied by UV−vis absorption spectroscopy. The absorptions from the two background batch samples were superimposed and are represented by the dashed traces. For the samples from the blue batch, their dispersions after 1 day of storage at room temperature were studied again by UV−vis absorption spectroscopy (red traces in Figure 5).
As expected, the onset of the formation of Cd−S bonds was readily determined through a comparison of the absorption at ∼290 nm collected from the blue batch dispersion samples at the different reaction temperatures (blue traces) with the corresponding background absorption (dashed traces).Figure 5 (top panel) shows that, at 120 °C, there is almost no difference in the absorption displayed by the blue and dashed traces. Thus, there were no Cd−S bonds formed and the Cd and S precursors in the blue batch were only mixed physically. At 160 °C, the blue trace exhibits larger absorbance values in the wavelength range below ∼350 nm; the difference in absorbance is attributed to Cd−S bonds having been formed. At 180 °C, such a difference in absorbance between the blue and dashed Figure 4. MALDI-TOF mass spectra collected from one as-synthesized IP311 sample before and after 3 days of storage in toluene at room temperature; upon storage, MSC−311 developed from IP311. Such development is similar to that shown inFigure S1-1
with a complete transformation. The m/z range is from 4000 to 6500 Da; the species around 5167 Da were detected for both IP311 and MSC−311.
traces increased. At this temperature, the absorbance difference at 290 nm manifested itself significantly, indicating that more and more Cd−S bonds formed in the induction period prior to nucleation and growth of RQDs. At 200 °C, RQDs developed (blue trace), which further increased the absorbance at 290 nm. Figure 5 (bottom panel) presents the absorption spectra collected from the blue batch sample dispersions. The absorption of the as-prepared dispersions (blue traces) is compared with the absorption after storage for 1 day (red traces). For the 120 °C sample, the blue and red traces almost overlap, and little change took place during the 1 day of storage. For the 160 °C sample after one-day storage, the absorbance at ∼311 nm increased marginally, together with the noticeable decrease of the absorbance at 290 nm. For the 180 °C sample, a sharp absorption peaking at ∼311 nm developed after 1 day of storage, together with a significant decrease of the absorbance at 290 nm. For the 200 °C sample after 1 day of storage, a sharp absorption peaking at ∼311 nm also developed but with much larger optical density; a decrease of the absorbance at 290 nm is also apparent. Meanwhile, the RQDs exhibited little change in their absorption. The transformation of IP311 into MSC−311 does not seem at all to affect the population of RQDs. Apparently, a single MSC−311 is a single nucleus and does not undergo further growth in size in the present study. The relation between CdS MSC−311 and RQDs in the current study is similar to that proposed for CdTe MSC−371 and RQDs.46 We also explored the formation of IP311 with MALDI-TOF MS, as shown inFigure S5.
Along with the increase of the reaction temperature, there was no formation of the Cd−S bonds at 120 °C. At 160 °C, the Cd and S precursors started to react with each other, as indicated by the absorbance at 290 nm, which was larger than
the superimposed absorbance of the Cd and S precursors. At 180 °C, a certain number of IP311 formed in the absence of RQDs. In addition to the large-scale increase of the absorbance at 290 nm for the as-synthesized sample (as compared with that of the superimposed absorbance of the Cd and S precursors), the development of a sharp absorption peak at 311 nm after the one-day storage indicates the existence of IP311. At 200 °C, there are more IP311 formed together with the presence of RQDs. The methodology is noteworthy, whereby we use optical absorption to monitor the onset of the formation the Cd−S bonds as well as to probe the formation of MSC−311 after storage and thus the existence of IP311.
■
CONCLUSIONSIn conclusion, we demonstrate that via a two-step approach, CdS MSC−311 could be engineered in a single-size form, which does not coexist with different size nanocrystals. This approach to CdS MSC−311 exhibits highly synthetic reproducibility. The first step requires a relatively high reaction temperature but still occurs in the induction period prior to nucleation and growth of RQDs, while the second step can be performed at room temperature. The formation of IP311 took place during the first step at 180 °C, with the formation of the Cd−S bonds starting to take place at 160 °C. The nucleation of MSC−311 from IP311 (eq 1) follows first-order kinetics. During the nucleation, the absorbance at 311 nm increased, accompanied by the decrease of the absorbance at ∼290 nm. IP311 and MSC−311 have similar masses, as demonstrated by our MALDI-TOF MS study. Furthermore, the nucleation kinetics could be readily accelerated by the presence of a tiny amount of MeOH. A similar proton-mediated ligand loss pathway is proposed for the intramolecular reorganization of Figure 5.Exploration of the onset of the formation of Cd−S bonds and the existence of IP311 in a heating-up reaction from 120 to 200 °C by UV− vis absorption spectroscopy. (Top) Absorption of sample dispersions (blue traces) is compared with the superimposed absorption (dashed traces) of the Cd and S precursors and. The Cd precursor batch (Cd−P) without the S precursor and the S precursor batch (S−P) without the Cd precursor are represented by green and gray traces, respectively. (Bottom) Absorption of sample dispersions (blue traces) is compared with that after 1 day of storage at room temperature (red traces). The nucleation of MSC−311 (red traces) from IP311 (blue traces) takes place during storage.
Chemistry of Materials Article
DOI:10.1021/acs.chemmater.7b02014
Chem. Mater. 2017, 29, 5727−5735 5732
IP311 leading to the formation of nuclei MSC−311.45 Accordingly, the formation of MSC−311 from IP311 follows a two-step nucleation pathway, which is similar to those in the literature (such as that presented byScheme S1).1−9
Here, the MSCs are nuclei and exhibit sharp absorption; they are single-size and stable without further evolution in single-size detected. The nucleation of MSC−311 is decoupled from the formation of IP311. The present study establishes a methodology for investigating the nucleation kinetics of MSCs from their immediate precursors which can be stored for future examination. Also, the present work introduces a practical means to monitor the onset formation of Cd−S bonds in a reaction. Thus, the present study provides deeper insights into the induction period of colloidal semiconductor QD formation, which may share general developmental principles, such as those regarding the formation pathway of Cd2E2 monomers
and the existence of liquid-like clusters before and after nucleation and growth of RQDs.42−45,55
The two-step nucleation mechanism proposed in the present study via intramolecular reorganization is promising and contributes to the fundamental base for future theoretical advances to resolve the mysteries and to reveal the beauty of crystal nucleation. We are actively studying additional experiments to further elucidate that the nucleation of MSC−311 is concentration-independent (Figure 2) and is thus supersaturation-independent. Also, we are dynamically applying the concept developed in the present study to systems other than those containing Cd such as ZnSe.
■
METHODSChemicals.Cadmium oxide (CdO, 99.99%), oleic acid (OA, 90%), and 1-octadecene (1-ODE, 90%) were purchased from Sigma-Aldrich. Powder sulfur (S, 99.5%), methanol (MeOH, 99.5%), isopropanol (i-PrOH, 99.7%), cyclohexane (CH, 99.5%), and toluene (Tol, 99.5%) were obtained from Chengdu Ke Long Chemical. [(trans-2-[3-(4-tert-Butylphenyl)-2-methyl-2-propenylidene]malononitrile (DCTB, 98.0%) was obtained from Tokyo Chemical Industry. All chemicals were used as received without purification, except for toluene which was distilled when it was used for the study shown byFigures 2and3. Synthesis.To prepare our Cd precursor Cd(OA)2stock solution, a mixture of 0.770 g (6 mmol) of CdO and 3.728 g (13.2 mmol) of OA in 5 g of ODE was placed in a 50 mL three-necked reaction flask and heated up to 220 °C to form a clear solution and then cooled down to 120 °C under nitrogen (N2). The mixture was then pumped for 60 min at 120 °C. The stock solution was stored under N2 at room temperature.
The first step of our two-step approach is the synthesis of CdS IP311. Typically, Cd(OA)2 (0.6 mmol from the stock solution), elementary S (0.15 mmol), and ODE (4 g) were mixed (with a total weight of 5 g) at room temperature. Then, the mixture was heated to 180 °C and kept for 20 min or to 190 °C and kept for 5 min under N2. The mixture containing IP311 was cooled down to room temperature and may be stored at −196 °C (in a liquid N2environment) for future studies, such as kinetics study.
The second step of our two-step approach is the transformation of IP311 to MSC−311. When the first-step mixture was dispersed in 3 mL of toluene or cyclohexane at room temperature, the evolution of MSC−311 took place slowly.
Characterization.Absorption spectra were collected with a 1 nm data collection interval by an ultraviolet−visible (UV−vis) spectrom-eter (General TU1901, Beijing Purkinje) and an ultraviolet−visible (UV−vis) spectrometer (UV 2310 II, TECHCOMP). MALDI-TOF MS data were collected on two MALDI-TOF mass spectrometers (Autoflex III, Bruker), one in the Key Lab of Analytical Chemistry for Life Science in the Institute of Chemistry, Chinese Academy of Sciences, and the other one at Sichuan University. [(trans-2-[3-(4-tert-Butylphenyl)-2-methyl-2-propenylidene]malononitrile (DCTB) was
used as a matrix, and a DCTB stock solution was made with a concentration of 10 mg in 0.5 mL of toluene. A CdS dispersion solution was prepared with 10 μL of sample dispersed in 500 μL of toluene. The matrix (2.5 μL) and CdS (2.5 μL) solutions were mixed, in order to optimize the mass signal for detection. The sample-matrix mixture was then spotted onto a MALDI plate and then loaded into the mass spectrometer for characterization. The detector gain (linear detector, positive mode) was set as 7.2× and 14.0×.
X-ray photoelectron spectroscopy (XPS) measurements were performed with an electron spectrometer (XSAM800, Kratos), with the purified MSC−311 sample pressed on a silicon pellet in an ambient atmosphere. TEM images were collected with a field emission electron microscope (JEM-2100F) operating at 200 kV. X-ray powder diffraction (XRD) was conducted with an X-ray diffractometer (EMPYREAN, PANalytical B.V.) using a Cu Kα beam (λ = 1.5418 Å), with our purified MSC−311 placed on a low-background quartz. Purification. When the first-step mixture was stored at temper-atures such as −20 °C for an extended period of time (a week), MSC-311 formed directly. Thus, the CdS MSC−MSC-311 sample was purified as follows. About 160 mg of the as-synthesized first-step sample was stored at −20 °C for about 1 week for the development of MSC−311; the nucleation kinetics are significantly affected by factors including temperature. Afterward, the sample was added to a mixture of isopropanol (3 mL) and toluene (1 mL). After centrifugation, the supernatant was removed, and the residual solvent was quickly removed by vacuum from the precipitate to avoid aggregation.
■
ASSOCIATED CONTENT*
S Supporting InformationThe Supporting Information is available free of charge on the ACS Publications website at DOI: 10.1021/acs.chemma-ter.7b02014.
Absorption spectra collected in toluene showing a continuous redshift pattern of absorption to peak at 311 nm, XPS, XRD, and TEM studies, absorption spectra used for the first order reaction equation fitting without additives, absorption spectra collected with the additive methanol, and MALDI-TOF mass spectroscopy study of samples from a reaction batch in the temperature range from 120 to 200 °C (PDF)
■
AUTHOR INFORMATIONCorresponding Authors
*(S.H.) E-mail:[email protected]. *(K.Y.) E-mail:[email protected].
ORCID Hongsong Fan:0000-0003-3812-9208 Shuo Han:0000-0003-0880-1833 Kui Yu:0000-0003-0349-2680 Author Contributions ⊥
T.Z. and B.Z. equally contributed to this paper.
Notes
The authors declare no competing financial interest.
■
ACKNOWLEDGMENTSWe thank Dr. Qiyu Yu for the general discussion on the synthesis of CdS colloidal quantum dots and Dr. Dennis M. Whitfield for his helpful comments on the initial manuscript preparation. Also, we thank Mr. Zuqing Liang at the Chinese Academy of Sciences for inspiring the MALDI-TOF mass measurements. K.Y. thanks National Natural Science Founda-tion of China (NSFC) 21573155, the Fundamental Research Funds for the Central Universities SCU2015A002, and Open Project of Key State Laboratory for Supramolecular Structures
and Materials of Jilin University for SKLSSM 2015025 and SKLSSM 201731.
■
REFERENCES(1) Myerson, A.; Trout, B. L. Nucleation from Solution. Science 2013, 341, 855−856.
(2) Erdemir, D.; Lee, A. Y.; Myerson, A. S. Nucleation of Crystals from Solution: Classical and Two-Step Models. Acc. Chem. Res. 2009, 42, 621−629.
(3) Davey, R. J.; Schroeder, S. L. M.; ter Horst, J. H. Nucleation of Organic CrystalsA Molecular Perspective. Angew. Chem., Int. Ed. 2013, 52, 2166−2179.
(4) Niederberger, M.; Cölfen, H. Oriented Attachment and Mesocrystals: Non-classical Crystallization Mechanisms based on Nanoparticle Assembly. Phys. Chem. Chem. Phys. 2006, 8, 3271−3287. (5) Sleutel, M.; Van Driessche, A. E. Role of Clusters in Nonclassical Nucleation and Growth of Protein crystals. Proc. Natl. Acad. Sci. U. S. A. 2014, 111, E546−E553.
(6) Garetz, B. A.; Matic, J.; Myerson, A. S. Polarization Switching of Crystal Structure in the Nonphotochemical Light-Induced Nucleation of Supersaturated Aqueous Glycine Solutions. Phys. Rev. Lett. 2002, 89, 175501−175504.
(7) Gebauer, D.; Völkel, A.; Cölfen, H. Stable Prenucleation Calcium Carbonate Clusters. Science 2008, 322, 1819−1822.
(8) Demichelis, R.; Raiteri, P.; Gale, J. D.; Quigley, D.; Gebauer, D. Stable Prenucleation Mineral Clusters are Liquid-like Ionic Polymers. Nat. Commun. 2011, 2, 590.
(9) Loh, N. D.; Sen, S.; Bosman, M.; Shu, F. T.; Zhong, J.; Nijhuis, C. A.; Král, P.; Matsudaira, P.; Mirsaidov, U. Multistep Nucleation of Nanocrystals in Aqueous Solution. Nat. Chem. 2017, 9, 77−82.
(10) Gibbs, J. W. On the Equilibrium of Heterogeneous Substances. Trans. Connect. Acad. Sci. 1876, 3, 108−248.
(11) Gibbs, J. W. On the Equilibrium of Heterogeneous Substances. Trans. Connect. Acad. Sci. 1878, 16, 343−524.
(12) Sanz, E.; Vega, C.; Espinosa, J. R.; Caballerobernal, R.; Abascal, J. L.; Valeriani, C. Homogeneous Ice Nucleation at Moderate Supercooling from Molecular Simulation. J. Am. Chem. Soc. 2013, 135, 15008−15017.
(13) Kim, J.; Biondi, M. J.; Feld, J. J.; Chan, W. C. Clinical Validation of Quantum Dot Barcode Diagnostic Technology. ACS Nano 2016, 10, 4742−4753.
(14) Pinchetti, V.; Meinardi, F.; Camellini, A.; Sirigu, G.; Christodoulou, S.; Bae, W. K.; De Donato, F. D.; Manna, L.; Zavelani-Rossi, M.; Moreels, I.; Klimov, V. I.; Brovelli, S. Effect of Core/Shell Interface on Carrier Dynamics and Optical Gain Properties of Dual-Color Emitting CdSe/CdS Nanocrystals. ACS Nano 2016, 10, 6877−6887.
(15) Chernomordik, B. D.; Marshall, A. R.; Pach, G. F.; Luther, J. M.; Beard, M. C. Quantum Dot Solar Cell Fabrication Protocols. Chem. Mater. 2017, 29, 189−198.
(16) Li, C.; Li, F.; Zhang, Y.; Zhang, W.; Zhang, X.; Wang, Q. Real-Time Monitoring Surface Chemistry-Dependent In Vivo Behaviors of Protein Nanocages via Encapsulating an NIR-II Ag2S Quantum Dot. ACS Nano 2015, 9, 12255−12263.
(17) Zhao, J.; Chen, G.; Gu, Y.; Cui, R.; Zhang, Z.; Yu, Z.; Tang, B.; Zhao, Y.; Pang, D. J. Ultrasmall Magnetically Engineered Ag2Se Quantum Dots for Instant Efficient Labeling and Whole-Body High-Resolution Multimodal Real-Time Tracking of Cell-Derived Micro-vesicles. J. Am. Chem. Soc. 2016, 138, 1893−1903.
(18) Zhang, X.; Lin, H.; Huang, H.; Reckmeier, C.; Zhang, Y.; Choy, W. C.; Rogach, A. L. Enhancing the Brightness of Cesium Lead Halide Perovskite Nanocrystal Based Green Light-Emitting Devices through the Interface Engineering with Perfluorinated Ionomer. Nano Lett. 2016, 16, 1415−1420.
(19) Xing, J.; Yan, F.; Zhao, Y.; Chen, S.; Yu, H.; Zeng, R.; Demir, H. V.; Sun, X.; Huan, A.; Xiong, Q.; Zhang, Q. High-Efficiency Light-Emitting Diodes of Organometal Halide Perovskite Amorphous Nanoparticles. ACS Nano 2016, 10, 6623−6630.
(20) Bao, J.; Bawendi, M. G. A colloidal Quantum Dot Spectrometer. Nature 2015, 523, 67−70.
(21) Fojtik, A.; Weller, H.; Koch, U.; Henglein, A. Photo-Physics of Extremely Small CdS Particles: Q-State CdS and Magic Agglomeration Numbers. Ber. Bunsenges. Phys. Chem. 1984, 88, 969−977.
(22) Cao, Y. C.; Wang, J. One-Pot Synthesis of High-Quality Zinc-Blende CdS Nanocrystals. J. Am. Chem. Soc. 2004, 126, 14336−14337. (23) Murray, C. B.; Norris, D. J.; Bawendi, M. G. Synthesis and Characterization of Nearly Monodisperse CdE (E = S, Se, Te) Semiconductor Nanocrystallites. J. Am. Chem. Soc. 1993, 115, 8706− 8715.
(24) Kudera, S.; Zanella, M.; Giannini, C.; Rizzo, A.; Li, Y.; Gigli, G.; Cingolani, R.; Ciccarella, G.; Spahl, W.; Parak, W. J.; Manna, L. Sequential Growth of Magic-Size CdSe Nanocrystals. Adv. Mater. 2007, 19, 548−552.
(25) Pan, D.; Ji, X.; An, L.; Lu, Y. Observation of Nucleation and Growth of CdS Nanocrystals in a Two-Phase System. Chem. Mater. 2008, 20, 3560−3566.
(26) Ouyang, J.; Kuijper, J.; Brot, S.; Kingston, D.; Wu, X.; Leek, D.; Hu, M. Z.; Ripmeester, J. A.; Yu, K. Photoluminescent Colloidal CdS Nanocrystals with High Quality via Noninjection One-Pot Synthesis in 1-Octadecene. J. Phys. Chem. C 2009, 113, 7579−7593.
(27) Li, M.; Ouyang, J.; Ratcliffe, C. I.; Pietri, L.; Wu, X.; Leek, D. M.; Moudrakovski, I.; Lin, Q.; Yang, B.; Yu, K. CdS Magic-Sized Nanocrystals Exhibiting Bright Band Gap Photoemission via Thermodynamically Driven Formation. ACS Nano 2009, 3, 3832− 3838.
(28) Wang, R.; Calvignanello, O.; Ratcliffe, C. I.; Wu, X.; Leek, D. M.; Zaman, M. B.; Kingston, D.; Ripmeester, J. A.; Yu, K. Homogeneously-Alloyed CdTeSe Single-Sized Nanocrystals with Bandgap Photoluminescence. J. Phys. Chem. C 2009, 113, 3402−3408. (29) Wang, R.; Ouyang, J.; Nikolaus, S.; Brestaz, L.; Zaman, M. B.; Wu, X.; Leek, D.; Ratcliffe, C. I.; Yu, K. Single-sized Colloidal CdTe Nanocrystals with Strong Bandgap Photoluminescencew. Chem. Commun. 2009, 8, 962−964.
(30) Yu, Q.; Liu, C. Y. Study of Magic-Size-Cluster Mediated Formation of CdS Nanocrystals: Properties of the Magic-Size Clusters and Mechanism Implication. J. Phys. Chem. C 2009, 113, 12766− 12771.
(31) Jiang, Z. J.; Kelley, D. F. Role of Magic-Sized Clusters in the Synthesis of CdSe Nanorods. ACS Nano 2010, 4, 1561−1572.
(32) Zanella, M.; Abbasi, A. Z.; Schaper, A. K.; Parak, W. J. Discontinuous Growth of II-VI Semiconductor Nanocrystals from Different Materials. J. Phys. Chem. C 2010, 114, 6205−6215.
(33) Cossairt, B. M.; Owen, J. S. CdSe Clusters: At the Interface of Small Molecules and Quantum Dots. Chem. Mater. 2011, 23, 3114− 3119.
(34) Evans, C. M.; Love, A. M.; Weiss, E. A. Surfactant-Controlled Polymerization of Semiconductor Clusters to Quantum Dots through Competing Step-Growth and Living Chain-Growth Mechanisms. J. Am. Chem. Soc. 2012, 134, 17298−17305.
(35) Wang, Y.; Liu, Y. H.; Zhang, Y.; Wang, F.; Kowalski, P. J.; Rohrs, H. W.; Loomis, R. A.; Gross, M. L.; Buhro, W. E. Isolation of the Magic-Size CdSe Nanoclusters [(CdSe)13(n-octylamine)13] and [(CdSe)13(oleylamine)13]. Angew. Chem., Int. Ed. 2012, 51, 6154− 7157.
(36) Yu, K. CdSe Magic-Sized Nuclei, Magic-Sized Nanoclusters and Regular Nanocrystals: Monomer Effects on Nucleation and Growth. Adv. Mater. 2012, 24, 1123−1132.
(37) Zhang, H.; Hyun, B. R.; Wise, F. W.; Robinson, R. D. A Generic Method for Rational Scalable Synthesis of Monodisperse Metal Sulfide Nanocrystals. Nano Lett. 2012, 12, 5856−5860.
(38) Kim, B. H.; Hackett, M. J.; Park, J.; Hyeon, T. Synthesis, Characterization, and Application of Ultrasmall Nanoparticles. Chem. Mater. 2014, 26, 59−71.
(39) Gary, D. C.; Terban, M. W.; Billinge, S. J. L.; Cossairt, B. M. Two-Step Nucleation and Growth of InP Quantum Dots via Magic-Sized Cluster Intermediates. Chem. Mater. 2015, 27, 1432−1441.
Chemistry of Materials Article
DOI:10.1021/acs.chemmater.7b02014
Chem. Mater. 2017, 29, 5727−5735 5734
(40) van Embden, J.; Mulvaney, P. Nucleation and Growth of CdSe Nanocrystals in a Binary Ligand System. Langmuir 2005, 21, 10226− 10233.
(41) Steckel, J. S.; Yen, B. K. H.; Oertel, D. C.; Bawendi, M. G. On the Mechanism of Lead Chalcogenide Nanocrystal Formation. J. Am. Chem. Soc. 2006, 128, 13032−13033.
(42) Yu, K.; Liu, X.; Zeng, Q.; Leek, D. M.; Ouyang, J.; Whitmore, K. M.; Ripmeester, J. A.; Tao, Y.; Yang, M. Effect of Tertiary and Secondary Phosphines on Low-Temperature Formation of Quantum Dots. Angew. Chem., Int. Ed. 2013, 52, 4823−4828.
(43) Yu, K.; Liu, X.; Zeng, Q.; Yang, M.; Ouyang, J.; Wang, X.; Tao, Y. The Formation Mechanism of Binary Semiconductor Nanomateri-als: Shared by Single-Source and Dual-Source Precursor Approaches. Angew. Chem., Int. Ed. 2013, 52, 11034−11039.
(44) Yu, K.; Liu, X.; Chen, Q. Y.; Yang, H.; Yang, M.; Wang, X.; Cao, H.; Whitfield, D. M.; Hu, C.; Wang, X.; Tao, Y. Mechanistic Study of the Role of Primary Amines in Precursor Conversions to Semi-conductor Nanocrystals at Low Temperature. Angew. Chem., Int. Ed. 2014, 53, 6898−6904.
(45) Yu, K.; Liu, X.; Qi, T.; Yang, H.; Whitfield, D. M.; Chen, Q. Y.; Huisman, E. J. C.; Hu, C. General Low-temperature Reaction Pathway from Precursors to Monomers before Nucleation of Compound Semiconductor Nanocrystals. Nat. Commun. 2016, 7, 12223.
(46) Liu, M.; Wang, K.; Wang, L.; Han, S.; Fan, H.; Rowell, N.; Ripmeester, J. A.; Renoud, R.; Bian, F.; Zeng, J.; Yu, K. Probing Intermediates of the Induction Period Prior to Nucleation and Growth of Semiconductor Quantum Dots. Nat. Commun. 2017, 8, 15467.
(47) Yu, W. W.; Qu, L.; Guo, W.; Peng, X. Experimental Determination of the Extinction Coefficient of CdTe, CdSe, and CdS Nanocrystals. Chem. Mater. 2003, 15, 2854−2860.
(48) Pignolet, L. H. Dynamics of Intramolecular Metal-Centered Rearrangement Reactions of Tris-Chelate Complexes; Springer: Berlin, Heidelberg, 1975; pp 91−137.
(49) Krebs, E.; Silvi, B.; Raybaud, P. Mixed sites and promoter segregation: A DFT Study of the Manifestation of Le Chatelier’s Principle for the Co(Ni)MoS Active Phase in Reaction Conditions. Catal. Today 2008, 130, 160−169.
(50) Yang, H.; Zhang, T.; Tian, H.; Tang, J.; Xu, D.; Yang, W.; Lin, L. Effect of Sr Substitution on Catalytic Activity of La1‑xSrxMnO3(0 ≤ x ≤ 0.8) Perovskite-type Oxide for Catalytic Decomposition of Hydrogen Peroxide. React. Kinet. Catal. Lett. 2001, 73, 311−316.
(51) Endo, M.; Fukui, T.; Jung, S. H.; Yagai, S.; Takeuchi, M.; Sugiyasu, K. Photoregulated Living Supramolecular Polymerization Established by Combining Energy Landscapes of Photoisomerization and Nucleation−Elongation Processes. J. Am. Chem. Soc. 2016, 138, 14347−14353.
(52) Hassinen, A.; Moreels, I.; De Nolf, K.; Smet, P. F.; Martins, J. C.; Hens, Z. Short-Chain Alcohols Strip X-Type Ligands and Quench the Luminescence of PbSe and CdSe Quantum Dots, Acetonitrile Does Not. J. Am. Chem. Soc. 2012, 134, 20705−20712.
(53) Anderson, N. C.; Hendricks, M. P.; Choi, J. J.; Owen, J. S. Ligand Exchange and the Stoichiometry of Metal Chalcogenide Nanocrystals: Spectroscopic Observation of Facile Metal-Carboxylate Displacement and Binding. J. Am. Chem. Soc. 2013, 135, 18536− 18548.
(54) Beecher, A. N.; Yang, X.; Palmer, J. H.; LaGrassa, A. L.; Juhas, P.; Billinge, S. J. L.; Owen, J. S. Atomic Structures and Gram Scale Synthesis of Three Tetrahedral Quantum Dots. J. Am. Chem. Soc. 2014, 136, 10645−10653.
(55) Liu, H.; Owen, J. S.; Alivisatos, A. P. Mechanistic Study of Precursor Evolution in Colloidal Group II-VI Semiconductor Nano-crystal Synthesis. J. Am. Chem. Soc. 2007, 129, 305−312.
(56) Kim, B. H.; Shin, K.; Kwon, S. G.; Jang, Y.; Lee, H.-S.; Lee, H.; Jun, S. W.; Lee, J.; Han, S. Y.; Yim, Y.-H.; Kim, D.-H.; Hyeon, T. Sizing by Weighing: Characterizing Sizes of Ultrasmall-Sized Iron Oxide Nanocrystals Using MALDI-TOF Mass Spectrometry. J. Am. Chem. Soc. 2013, 135, 2407−2410.
(57) Xie, L.; Shen, Y.; Franke, D.; Sebastian, V.; Bawendi, M. G.; Jensen, K. F. Characterization of Indium Phosphide Quantum Dot
Growth Intermediates Using MALDI-TOF Mass Spectrometry. J. Am. Chem. Soc. 2016, 138, 13469−13472.