Analyzing the Impact of Structure in
Handwriting Recognition Software
MASSAHUSETTS INTITUTEby
JUN
2 1 2011
Neil E. Chao LIBRARIES
B.S., Massachusetts Institute of Technology (2010)
ARCHNVES
Submitted to the Department of Electrical Engineering and Computer Science in Partial Fulfillment of the Requirements for the Degree of Master of Engineering in
Electrical Engineering and Computer Science at the Massachusetts Institute of Technology
May 2011
Copyright 2011 Massachusetts Institute of Technology All rights reserved. The author hereby grants to M.I.T. permission to reproduce and
to distribute publicly paper and electronic copies of this thesis document in whole and in part in any medium now known or hereafter created.
Author .
Department of Electrical Engineering and Computer Science Certified by
Kimberle Koile, Ph.D. Research Scientist, MIT CECI Thesis Supervisor May 20, 2011 Accepted by
Dr. Christopher J. Terman Chairman, Masters of Engineering Thesis Committee
Analyzing the Impact of Structure in
Handwriting Recognition Software
by
Neil E. Chao
Submitted to the Department of Electrical Engineering and Computer Science May 20, 2011
in Partial Fulfillment of the Requirements for the Degree of Master of Engineering in Electrical Engineering and Computer Science
ABSTRACT
Handwriting recognition for text and numbers has existed for Tablet PCs and specialty devices for almost a decade. The use of such software in a classroom can shorten the latency between answers to exercises and teacher feedback. While text and number inputs have already been well explored, graphical examples and math problems are a relatively new territory for recognition software. Under the guidance of the NSF-funded INK-12 Project, I explored the impact of structure on the ability of Ink-Analysis Handwriting Recognition to understand students' solutions math and science exercises, hoping to find the ideal balance between accurate grading and minimal human effort. I tested a prototype system aimed at supporinting "virtual-teacher-guided" learning in elementary school classrooms in the Greater Boston area.
Thesis Supervisor: Kimberle Koile, Ph. D. Title: Research Scientist, MIT CECI
Contents
1 Introduction 17 2 Previous Work 20 2.1 INK12 20 2.2 Existing Technology 21 2.3 Related Research 223 Research of Existing Handwriting Recognition Technology 25 3.1 Microsoft Tablet SDK 25
3.2 Ink Stroke Representation and Saving Ink 26
4. The Recognition Grid 27
5. Handwriting Diagnostic and Curriculum Analysis 28
5.1 Math and Science Curriculum in the CLP Notebooks 28 5.2 The Handwriting Diagnostic Program and Exercises 30
6. Results of the Handwriting Diagnostic 53
6.1 Structure in Fraction Coloring Problems 54 6.2 Results of Detecting Table Entries 65 6.3 Detecting the Number Grid Solutions 72
6.4 The Effects of Structure in Graph Recognition 78
7. Conclusion and Future Works 89 7.1 The Impact of Structure 89
7.2 Algorithm Changes to Improve Detection 90
7.4 Future Work 93
7.5 Contribution 94 Bibliography 95
Appendix A. Test Applications to Explore the Technology 97
Appendix B. Design Choices in the Recognition Grid 104 Appendix C. The Authoring Tool 125
List of Figures
Figure 1-1: An example of a student solution that is difficult to interpret. A teacher can easily understand that the lines from the x and y-axis are a student's way of measuring from the tick marks so that his or her points are accurate. A computer may not expect this behavior and thus might misinterpret the lines as foreign artifacts.
Figure 5-1: A fraction coloring problem with a faded grid on the interior. The interior grid helps students measure out 1/3 of the shape and is expected to increase student accuracy in solving the problem.
Figure 5-2: A fraction coloring problem without the interior grid but with the outer
boundary. Students will have to measure out of this shape on their own, either by drawing their own interior grid or by eyeballing the outer shape.
Figure 5-3: A fraction coloring problem without the interior grid or the outer boundary.
Students must provide the shape and then color in /4 of it. This difficult for the
Recognition Grid to do because it must distinguish between Ink Strokes that are meant to represent the edges of the shape and Ink Strokes that are meant to color in the shape.
Figure 5-4: A fraction coloring problem with a non-traditional shape. This problem tests
the Authoring Tool's ability create unique shapes for students to work on, proving that we are not limited to basic squares and rectangles for our problems. To create this, we
used the Snapping Strokes method in the Authoring Tool.
Figure 5-5: A basic table entry problem. Students are asked to fill numbers into the table.
This will test the Recognition Grid's ability to understand elementary school level handwriting as well as the students' ability to stay within the lines for each cell.
Figure 5-6: A table entry problem with check marks and X's. This problem will test the
Recognition Grid's ability to understand non-traditional characters, on top of the list of difficulties described in Figure 5-5.
Figure 5-7: A table entry problem with decimals. The problem tests the Ink Analyzer's
ability to detect decimal points in addition to all of the complications mentioned in Figure
5-5.
Figure 5-8: A basic number
additional layer of structure Possible difficulties include
grid problem. The use of color in the problem adds an that the Recognition Grid will use to grade the problem. Ink Strokes spilling into neighboring cells and errant marks.
Figure 5-9: A basic shape drawing problem. To grade this advanced problem, the
Recognition Grid must be able to detect and trace the boundary of the shape and then calculate the area inside.
then draw circles above the number line. The Recognition Grid must distinguish between tick marks and labels but then determine which labels correspond to which tick marks. Then, the program must measure the drawn shapes according to the interpreted labels to determine if the circles are drawn at the proper location.
Figure 5-11: Another complicated number line problem. This version of the number line adds structure to the student solution by requiring the different seashells be in different colors.
Figure 5-12: Students are asked to plot different points in different colors. They are given the x and y-axis as well as background grid lines to help them visually draw lines from the axes.
Figure 5-13: Another problem where students are asked to plot points in different colors. Unlike the problem in Figure 5-12, the background grid is no longer provided for the students, making it harder to measure from the axes visually. We expect less accurate solutions as a result of this removal of structure.
Figure 5-14: Students are asked to plot points and then connect them with a line. This will test students' abilities to associate different data columns with different axes and their ability to comprehend line graphs.
the x or y-axis. This will test the Recognition Grid's ability to recognize the axes and their labels and then determine the correctness of the line graph with respect to these axes. This is extremely complicated and we will collect data so that a future version of the Recognition Grid can eventually test its grading mechanism for this problem.
Figure 5-16: Students are asked to copy a piece of text and then give a one-word answer in the box. Hopefully the students will keep their answers contained in the box.
Figure 5-17: Another problem to test the Recognition Grid's text recognition ability.
Figure 6-1: The student solutions for the first fraction coloring problem, where students were giving the interior grid.
Figure 6-2: The statistics of all the student solutions for the first fraction-coloring problem.
Figure 6-3: The ECDF for the first fraction-coloring problem's solutions. The green circle is the point closest to the average of the student solutions. The blue circles are the left and right bounds for all data-points within one standard deviation of the mean. The two red rectangles are the solutions determined to be incorrect by eye.
Figure 6-4: How well the above methods classified the solutions. They are measured against my eyeball judgment to show how the program's grading would compare against
human grading.
Figure 6-5: A visual representation of the method's effectiveness in grading the first
fraction-coloring problem. We see that for this problem, using the exact solution as the model solution and a 10% margin yields the most correctly classified student solutions.
Figure 6-6: The solutions for the second coloring problem. This is the fraction-coloring problem in which the students did not have the interior grid but still had the outer boundary of the square visible. We expect students to be less accurate without the interior grid to rely on, so we expect the standard deviation of the solutions to be slightly larger than in the first fraction-coloring problem.
Figure 6-7: The statistics for the second fraction-coloring problem. Notice that even if we are only looking at the human-judged eyeball correct student solutions, the standard deviation is much larger than in the previous problem.
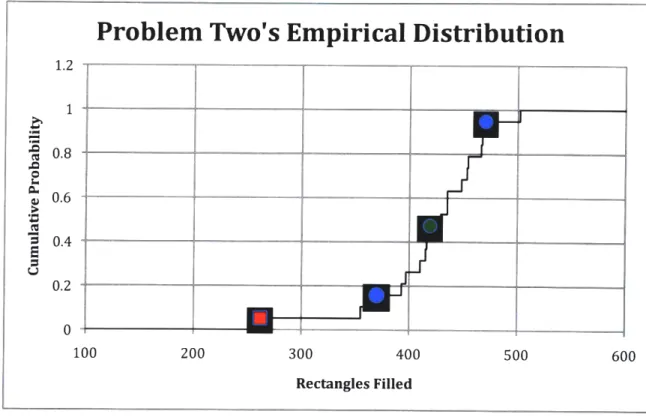
Figure 6-8: The EDCF for the second fraction-coloring problem's solutions. The green circle is the point closest to the average of all the solutions. The blue circles are the left and right bounds for all solutions within one standard deviation of the mean. The red square is the one solution deemed incorrect by eye.
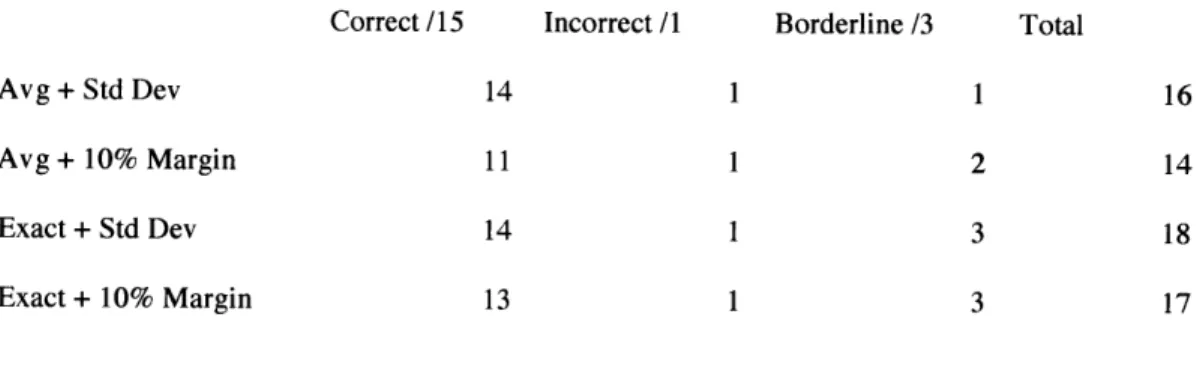
Figure 6-9: How well the second fraction-coloring problems' solutions were classified by the Recognition Grid. Once again, I had to eyeball the solutions so that the program's
classifications could be matched against a human's.
Figure 6-10: A visual representation of how well the Recognition Grid classified the student solutions. In this case, it appears that using the exact solution as the model solution and the standard deviation yielded the best results. Using the exact solution instead of the average in both this problem and the previous one appears to be the best way to classify solutions.
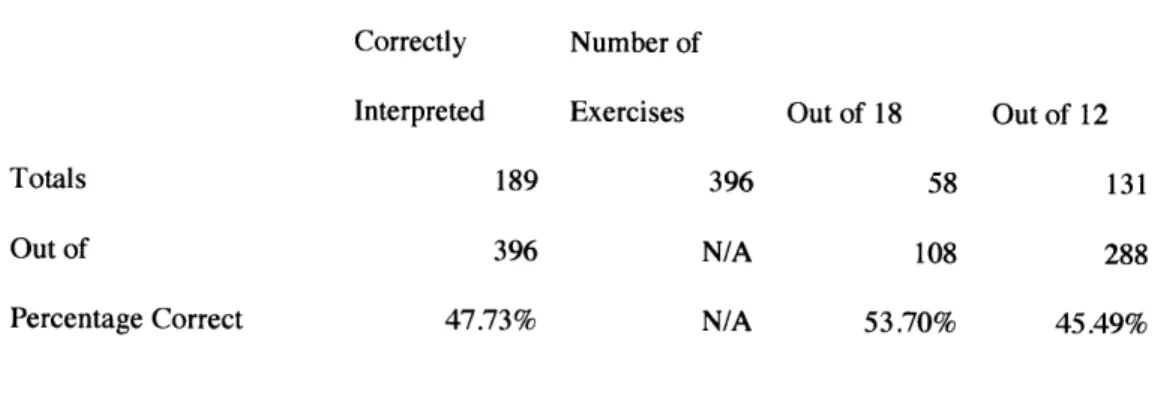
Figure 6-11: The results when we interpreted all the table entry problems using the first option - interpreting the answers cell by cell using the clipped results of the grid in each cell as the Ink Strokes of that data entry.
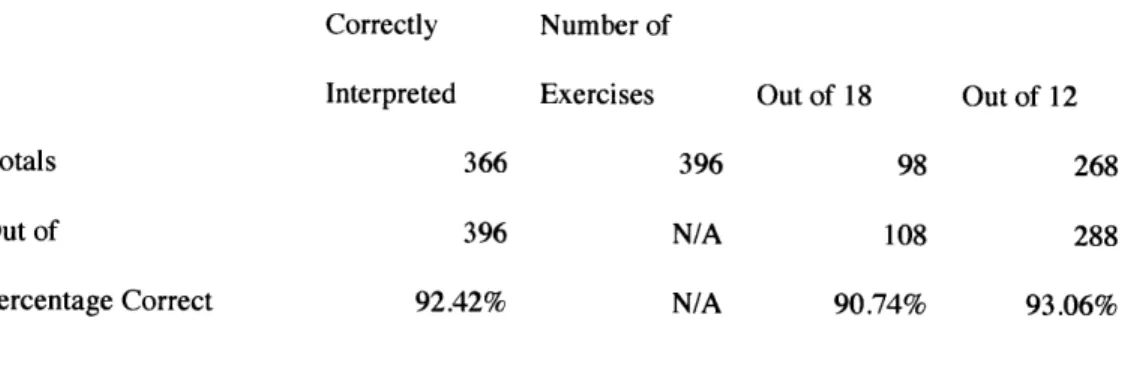
Figure 6-12: The results when we interpreted the table entry problems using option the second option - interpreting all of the Ink Strokes in the table at once and looking for consistency in the consecutive numbers.
Figure 6-13: Statistics for the correctly interpreted exercises when the Ink Analyzer interprets cell by cell.
Figure 6-14: Statistics for correctly interpreted exercises when the Ink Analyzer interprets the entire table at once.
grid exercise. Out of the 24 student solutions that we collected, 8 were obviously incorrect - the students circled the wrong numbers as multiples.
Figure 6-16: The statistics for how much the spilled-over strokes affected the Recognition Grid's ability to determine correctness. These statistics were calculated on the 16 correct solutions.
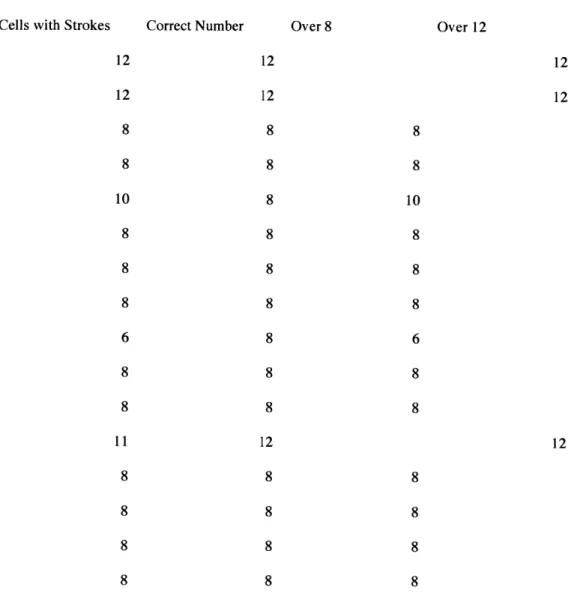
Figure 6-17: The amount of strokes spilling into other cells when we used thresholding. Notice that this substantially reduced the amount of spillvoer, but caused two cases where Strokes were undercounted. This is because several students didn't circle the numbers in the cells but instead put dots in them. These dots ended up being smaller than the cut off threshold, and the Recognition Grid did not count them.
Figure 6-18: The statistics of how many cells had spillover Strokes when the Recognition Grid used a threshold.
Figure 6-19: The Recognition Grid's ability to classify student solutions in the graphing problem with a background grid. I accepted solutions up to 100 squared pixels away from the model solutions. Notice that this margin was small enough such that no false positives were allowed.
Figure 6-20: Statistics for the Recognition Grid's ability to classify solutions. All incorrect solutions were correctly classified as incorrect while almost three quarters of
correct solutions were classified as correct. The correct solutions that were mistakenly classified as incorrect were done so because of errant strokes and students drawing guidelines to accurately plot the points, as these factors would impede the detection process.
Figure 6-21: An example of a student drawing guidelines from the axes to help plot the point. Because of the nature of the detection algorithm, the guidelines were counted into the Strokes for each color and impacted the bounding box's center. The cyan squares show where the Recognition Grid thinks the students' solutions are.
Figure 6-22: An example of the Recognition Grid's accuracy in detection incorrect solutions. The red point should be plotted at (0,5) but is actually plotted at (1,5). The 100 squared pixels threshold is so small that the Recognition Grid rejects the red point and determines that the red point is plotted in the wrong place.
Figure 6-23: An example in which errant purple strokes skewed the purple points' location detection.
Figure 6-24: Student solutions on the graphing problem without the background grid. The Recognition Grid still uses the 100 squared pixels as the cutoff for correct solutions so there are a lot more solutions counted as incorrect than in Figure 6-19. Notice that there
Figure 6-25: Statistics for classification of student graphing problems when they were not given a background grid.
Figure 6-26: Classification of student solutions after I raised the cutoff threshold from
100 pixels squared to 800 pixels squared.
Figure 6-27: Statistics for solution classification with a threshold of 800 pixels squared. One surprising result is that even with the relaxed threshold (800 pixels squared up from
100), we still don't have any false positives.
Figure A-1: The Real-Time Interpreter. Ink Strokes are inputted in the top, white area and the translated results are displayed in the bottom, blue area.
Figure A-2: The Real-Time Interpreter in action. I drew the Ink Strokes that made up the word "he" and then the word "hello", while the Microsoft Ink Analyzer outputted the translated results in the blue TextBox below.
Figure A-3: Color strokes drawn into the Color Entry Recognizer. The Ink Strokes were drawn into the Ink Canvas on the left.
Figure A-4: The Color Entry Recognizer's Get Colors button reads the Ink Strokes and then outputs their locations and hex color codes. Notice that the relative left to right ordering of the color strokes is preserved, and the x-coordinates of the Strokes' horizontal
bounds are shown to pixel level precision.
Figure A-6: The previous functions are collapsed into a table. I also experimented with alternative forms of inputting answers, such as the calculator like number grid on the bottom left.
Figure B-1: An example of a group of dense Ink Strokes making up a bounding box.
Figure B-2: A single Ink Stroke that has the same bounding box as the dense group from Figure B-1. This example shows a flaw in just using bounding boxes in determining between similar groups of Strokes.
Figure B-3: A basic L shaped stroke and the bounding box it produces.
Figure B-4: Three rectangles and the boundaries that they create on the Ink Canvas. The three rectangles will be used to clip the Ink Strokes from Figure B-3 so that different portions of the resulting child Strokes fall separately into the final rectangles.
Figure B-5: After clipping the L shaped stroke using the three rectangles. Now instead of seeing a single bounding box, we see that two out of the three rectangles have a resulting child Stroke in them while one of the three rectangles did not clip with any part of the L-shaped Stroke.
Figure B-6: The grid structure of the Recognition Grid. The grey colors of the individual rectangles denote that no Ink Strokes have been clipped into them yet.
Figure B-7: The Recognition Grid after Ink Strokes are drawn on it. After clipping the input Ink Strokes, the rectangles that have resulting child Strokes are colored light green, while the rest remain grey.
Figure B-8: The Recognition Grid with threshold mode turned on. The threshold values are displayed in the top left corner of each rectangle. The closer the value of the bounding box in the rectangle is to 1, the greener that rectangle is.
Figure B-9: A Recognition Grid with very low precision. Although the Ink Stroke has been captured, we learn very little information about the Ink Stroke and what the user intended it to represent.
Figure B-10: A Recognition Grid with higher precision. By using more columns and rows in the Recognition Grid, we can obtain more information about the Ink Stroke.
Figure B-11: A Recognition Grid with a drawing of an x and y axis and a circle.
Figure B-12: A plain Ink Stroke.
middle of the Stroke.
Figure B-14: The Ink Stroke further divided into fourths using more erase-by-point mouse actions.
Figure C-1: The options prompt window in Authoring Mode. This controls all of the settings that a teacher currently needs to create the basic math and science problems that we used in the Handwriting Diagnostic.
Figure C-2: An example of snapped student strokes. Students' Ink Strokes are snapped to the background grid to create rigid strokes. This helps make problems and solutions
neater and can even aid in detection.
Figure C-3: An Ink Stroke, with snapping turned on, before it is erased in half. I curved the Ink Stroke to highlight what happens when it gets cut in half.
Figure C-4: The resulting snapped lines when the original Ink Stroke is cut in half. Both remaining halves are valid Ink Strokes, so the consistent behavior here is to snap both of these halves to the grid.
Chapter 1
Introduction
What is so difficult about student free-hand solution interpretation?
There are many factors involved in answering that question. While text and number inputs can be relatively accurately translated using modern day Ink tools, the lack of structure when it comes to open-ended problems makes it difficult to determine
correctness. When a fourth-grade teacher reads a student's graph, the teacher can take into account bad handwriting and errant scribbles while understanding that not all fourth-grade students will draw perfectly straight lines or adhere strictly to tic marks. Teachers can also quickly distinguish between scratch work and the final answer. In addition, teachers can more easily figure out why students made a mistake than a computer can. Current interpretation software may tell you that a plotted line is not done correctly, while the teacher can reason from the drawing that the student mixed up the x and y-axes.
One example of the difficulties of Ink interpretation is shown in Figure 1 below. The problem asks students to plot points on a graph. To make interpretation even easier, the problem specifies that the different points be drawn in different colors.
11. Plot these points in the color indicated (5, 10) black (0, 5) red (15, 15) green (2, 2) purple 20 is --S10 15 20
Figure 1- 1: An example of a student solution that is difficult to interpret. A teacher
can easily understand that the lines from the x and y-axes are a student's way of
measuring from the tick marks so that his or her points are accurate. A computer may not expect this behavior and thus might misinterpret the lines as foreign artifacts.
From the example, we see that students can add artifacts to their solutions that the computer may not be expecting. A teacher can easily decipher that this student used guidelines to measure from the tic marks up to the point. If the computer is not expecting this behavior, the computer may mark the entire solution as incorrect due to its inability to separate guidelines from points. Unexpected student behavior is one of the most difficult things to take into account when interpreting student solutions.
My thesis explores the tradeoff between exercise structure and the ability for a
software system to accurately grade student answers. I aim to use structure as a way to organize student answers, allowing artifacts such as the guidelines above while
minimizing their ability to impede interpretation and recognition. I do not want to
completely structure problems in a way to remove all the fun and exploration: I only wish to provide enough structure to keep problems entertaining and novel while giving the computer enough context to act as a virtual teacher. With new Ink technology and classroom-tested structure, I hope to bring Ink Interpretation to the level of reading, processing, and understanding student work.
Chapter 2
Previous Work
2.1 INK12
The goal of the NSF-Funded INK-12 project is to study virtual-teacher-guided learning and its impact in the classroom.
For a previous project, we experimented with immediate communication between students in the forms of handwritten notes, submissions, and grading comments passed through a classroom's wireless network, reducing the amount of time required for traditional flow in between the student's desk and the teacher's. In addition, teachers could explore peer learning. With a click of a button, a teacher could display a student's solution on a projector for the entire class to see without revealing that student's identity. Another feature allowed the teacher to virtually swap student work with other students. Using this function, students were able to benefit from peer learning by grading each other's work. Finally, a database was designed such that student work could always be saved, and any child's submissions relating to a certain lesson could be quickly queried and examined.
The software developed, called Classroom Learning Partner, or CLP, provided a tablet PC-based platform for students and teachers to engage in classroom discussion and formative assessment. CLP integrated existing tools with math and science curriculum to allow teachers to be more involved with student work as it took place during lessons and
not after them. Our research explored these passive teacher aids in a series of classroom visits in the 2008-2010 school years.
The most recent grant is aimed at developing a new version of CLP, one that will give active support to teachers by automatically interpreting student submissions. We wish to create software that interprets, aggregates, and analyzes student submissions. For example, imagine a graphing problem that involves a student plotting some points on a graph. In a traditional classroom, the teacher would have to collect assignments and grade the plots overnight. With active virtual-teacher-guided learning, the students would immediately receive feedback on their plots. The software would automatically interpret student graphs by converting them into a computer intelligible representation and
grouping them into correct solutions and incorrect solutions. The software would then take the incorrect solutions and sort them into buckets of common mistakes, allowing the teacher to instruct according to the most frequent errors. With the help of active
interpretation, INK-12 aims to greatly improve student-teacher feedback by allocating much of the grading process to the computers.
2.2 Existing Technology
Existing classroom tools such as SMART® Boards and Mimio Virtual Ink provide a glimpse into the capabilities and limitations of modern day classroom feedback technology. SMART Boards allow the sharing of written ink faster than transparencies or slides can be created. Student answers can be chosen from the classroom and displayed on the board so that the children can review a peer's thought process. <Citation needed>
Mimio "vote pads" allow teachers to instantly survey the level of understanding of a given lesson. The vote pads are basically mobile "multiple choice" boxes. Teachers can ask a question and then take a poll of the number of A's, B's, C's, and D's that students respond with. This process shortens the amount of time it takes for a teacher to understand the general level of comprehension. In the past, educators would either have to grade assignments or take verbal hands-up polls of the classroom. Neither of these methods are ideal, as grading assignments take time and verbal / hands-up polls could easily be influenced by peer pressure and lack of privacy. In addition, multiple-choice questions often limit teaching and learning to the regurgitation of facts.
The INK-12 project aims to expand upon these technologies by creating an ink-based notebook and virtual-teacher that can provide feedback on wider variety of problems. The long-term goal is to move well beyond multiple choice and basic word problems into modern context-based math problems including graphs, number lines, drawings, and diagrams. We aim to support all aspects of classroom curriculum without restricting student submissions to easily interpretable solutions. Throughout this process, we will continue to provide the same passive teacher-support using our tablet computers, databases, and projectors.
2.3 Related Research
In the paper "The Usability of Handwriting Recognition for Writing in the Primary Classroom", Read, MacFarlane et al. set about studying the usability of
working with children ages 7 to 10, to test student likes and dislikes of three mediums of communication: pen and paper, tablet PC and stylus, and laptops with keyboards.
The stimulus for this writing was a parable about an ant and a grasshopper in which the ant stored food for the winter, while the grasshopper played his cello all
summer and subsequently went hungry in the winter. The children were asked to write a story about what happened the next year.
Children were asked to rate their predicted enjoyment of the activity as well as the actual enjoyment afterwards using a scale called the Smileyometer; students were asked to choose from varying smiley faces to describe how much they enjoyed each activity. Their stories were graded on quality and quantity, or the word count. Finally, the students were asked to assess the experience using each of the three mediums.
The researchers found the following results, all ranked from greatest to least:
Quality of writing: 1) Pen, 2) Tablet, slightly ahead of 3) Keyboard Quantity of writing: 1) Pen, 2) Tablet, 3) Keyboard
Preferences Expected: 1) Keyboard, 2) Tablet, slightly ahead of 3) Paper Preferences Actual: 1) Keyboard, 2) tie between tablet and paper
The researchers noted that when using a keyboard, students spent time looking for what key to press and were more aware of spelling mistakes when using the keyboard. The age of the students may have played a role in their reaction to the keyboard.
This experiment shows that the tablet and stylus are usable mediums for classroom exercises. While students appear to work faster using pen and paper, we believe that the benefits of being able to send work through a wireless network,
automatically grading student answers, supporting real-time classroom discussions of student work, will outweigh the disadvantages.
Chapter 3
Research of Existing Handwriting Recognition
Technology
3.1 Microsoft Tablet SDK
My thesis's focus is not to reinvent the wheel. There are plenty of well-researched
and developed handwriting recognition technologies out there, created by teams of researchers or entire corporate divisions. My first task was to examine the most popular technologies and to choose something suitable for use in the classroom. Through this process, I had to keep in mind the adaptability of the SDK to account for my own additions, most importantly graph recognition.
I found the Microsoft Tablet SDK to contain the most suitable handwriting
recognition software. Not only was the text input success rate very high, but the Tablet SDK was also very robust in support of Ink Strokes, enabling me to easily save and load student Ink examples, slice up individual strokes, and manipulate the ink in a way to understand individual lines and curves.
Starting from the Microsoft Tablet Ink Resources, I began my thesis project of creating structured math problems for students that went beyond simple text and number answers. Using these libraries, I created tools that could be shaped into a virtual-teacher that could provide instant feedback for students in the classroom.
3.2 Ink Stroke Representation and Saving Ink
In the Microsoft Tablet SDK, strokes are represented as a series of points, much like Bdzier Curves are defined by a series of "control points". Rather than saving every pixel location of a single Ink Stroke, I could simply save an Ink Stroke's less numerous Stroke Points to a file. To load data stored in saved files, I could reconstruct ink using these points. This would create an identical replica of the Ink saved earlier. These basic tools would allow me to go into elementary school classrooms, have students test out the
software by doing basic exercises, and then go back to the computer lab to analyze the results before having to wait for the new CLP software to be completely functional.
Chapter 4
The Recognition Grid
I created a modular class that contained all of the functions necessary to interpret
ink. I call this class the "Recognition Grid" and it integrates several key concepts that allow it to interpret text, numbers, and free-hand other strokes (e.g. graph axes and lines) all at the same time.
Recognition Grids use certain techniques in order to be able to specifically detect when student solutions are incorrect while providing enough leeway that the differences in how two students go about solving a problem will not be enough to deem one version correct and another incorrect. To see the discoveries and prototypes leading up to the creation of the Recognition Grid, please see Appendix A. To see the design choices behind the Recognition Grid, please see Appendix B. To see how a teacher creates a Recognition Grid in a CLP Notebook and all of the options it can take, please see Appendix C.
Chapter
5
Handwriting Diagnostics and Curriculum Analysis
The CLP Team decided that a large sample of student's handwriting should be collected in order to determine the feasibility of automatic interpretation of different exercises. While we continued to develop the Recognition Grid, the CLP Notebook, networking features, and all other components of the CLP Software, we wanted proceed with testing how students performed traditional paper-based math problems on a tablet computer. We especially wanted to take note of any interesting patterns or outlying solutions that would be difficult to interpret with the current Handwriting Recognition system. Since we were at the beginning of the INK-12 grant, we understood that we would limit ourselves to only a subset of all possible handwriting recognition problems and later would add to the Handwriting Recognition software new functionality, e.g. the ability to distinguish being correct and incorrect handwritten solutions.
5.1. Math and Science Curriculum in the CLP Notebooks
The current INK-12 curriculum, developed by the Principle Investigators Andee Rubin of TERC and Dr. Kimberle Koile of MIT CECI were chosen for several similar qualities:
1. The exercises required critical thinking while staying relevant to the existing
elementary school curriculum.
2. The exercises asked for solutions and explanations that, if shared with the entire classroom, could benefit other students through peer learning.
3. The exercises asked for solutions that are not limited to text and numbers, thus
requiring new methods of handwriting recognition.
4. The exercises utilized the expanded capabilities of tablet PCs. For example, they asked students to quickly switch between colors, to highlight certain parts of the exercise, and to use various other new tools, like CLP Stamps, that would be more difficult and tedious to do on traditional pen and paper.
As we both observed students in the classroom and analyzed their exercise solutions afterwards, we kept the following questions in mind:
Are some exercises too difficult to interpret in their current state?
Is this difficulty because the student solutions are too varied for a single pattern detection to recognize? Could this difficulty be solved by adding additional structure to the exercise, perhaps by requiring certain parts of the solution to be supplied in different colors?
Is there too much information cluttered on a single page that would make interpretation very difficult? If so, can we add a table that will structure where students have to put certain answers?
Is there more than one correct answer? Exercises that have a wide range of answers will be difficult to categorize as correct or incorrect. For some of these exercises, it may be possible to separate the answer into a computer-graded component and then a teacher-graded component.
5.2
The Handwriting Diagnostic Program and Exercises
The Handwriting Diagnostic tests took place over the course of four days in April
2011. Two different elementary schools were visited: Northeast Elementary School in
Waltham, Massachusetts, and Baldwin Elementary in Cambridge, Massachusetts. We worked with three teachers and roughly 70 students.
The problems that PIs Andee Rubin and Dr. Kimberle Koile developed for this experiment fell into <insert number> categories.
1. Fraction Coloring Problems
2. Table Entry Problems
3. Number Grid Problems
4. Shape drawing Problems
5. Number Line problems
6. Graphing Problems 7. Text Sampling
Each of the following problems was created using a Canvas and an InkCanvas. The Canvas element is a Microsoft User Interface element that allows us to draw primitive shapes. The InkCanvas, as discussed before, accepts the Ink Strokes when the user writes in the specified area. The problem that the student sees is created on the Canvas layer, while the capturing of the strokes and processing through the Recognition Grid is done on the InkCanvas layer.
5.2.1 Fraction Coloring Problems
The fraction coloring problems were very straightforward: students were asked to color in a certain fraction of a shape in whatever color they chose. We created four different fraction coloring problems, but we varied the amount of structure provided to the students in each exercise. For some problems, the shape would be provided as well as guidelines within the shape that students could use to help figure out the fractions. In other problems, students were asked to draw shapes of their own and then color in a specified fraction of it. We wanted to compare these answers to each other to see if the added structure significantly impacted some student's ability to correctly do the exercises. In addition, we wanted to understand the impact of structure on the
Recognition Grid's ability to interpret the solution correctly. Does providing the shape and guidelines remove some artifacts that would be difficult to interpret? Or can it even introduce artifacts?
1. Use the marker to color in 1/3 of this shape
Figure 5-1: A fraction coloring problem with a faded grid on the interior. The interior
grid helps students measure out 1/3 of the shape and is expected to increase student accuracy in solving the problem.
This initial Fraction Coloring Problem is the easiest for the students and the easiest for us to interpret. Upon seeing the guidelines, students are very likely to use them, increasing their level of precision when coloring in the square. This in turn allows the program to have to use less leeway when interpreting between correct and incorrect answers. However, the problem may be too simple for the students, and teachers and curriculum creators are always looking for a good balance between problem difficulty and problem guidance.
2. Use the marker to color in 1/2 of this shape
Figure 5-2: A fraction coloring problem without the interior grid but with the outer boundary. Students will have to measure out of this shape on their own, either by drawing their own interior grid or by eyeballing the outer shape.
The next Fraction Coloring Problem takes away the guiding lines within the shape, but it retains the outer boundary of the square. This will test how much leeway the Recognition Grid must have been interpreting a solution as correct or incorrect. In resolving this, we may have to group definitely correct solutions together and definitely incorrect solutions together while allowing the teacher to visually judge the solutions that are in a grey
middle area.
Using a Recognition Grid with lots of rows and columns will be useful here. To determine the exact ratio of the shape that is colored in, we will take the number of rectangles that have strokes in them and divide that by the number of total rectangles that make up the shape. This ratio will not necessarily be a perfectly 0.50, and this problem
will help us determine how much error we should allow in the Recognition Grid's detected ratio.
Fraction Coloring Problem 3
3. Draw a square and color in 1/4 of it.
Figure 5-3: A fraction coloring problem without the interior grid or the outer
boundary. Students must provide the shape and then color in of it. This difficult for the Recognition Grid to do because it must distinguish between Ink Strokes that are meant to represent the edges of the shape and Ink Strokes that are meant to color in the shape.
This Fraction Coloring Problem further removes structure from the student solution. Students are asked to draw for themselves a square and then color in a fourth of it. To accomplish this task, the Recognition Grid will have to distinguish between which strokes are part of the outline of the shape and which strokes are part of the colored-in region. To do this, the Recognition Grid could look for thin, consecutive lines of
rectangles that have strokes in them while they are surrounded by rectangles without strokes. These rectangles would be categorized as boundary-containing rectangles. Meanwhile, stroke-containing rectangle clusters that are more than some threshold thick will be categorized as filler-containing rectangles.
Different students may choose different sized rectangles to draw, and rectangles that are too small may inhibit our ability to perform the above technique. We will try to gather enough data to determine if this type of problem can be accurately interpreted on a consistent basis.
Fraction Coloring Problem 4
4. Color in 1/2 of this shape
Figure 5-4: A fraction coloring problem with a non-traditional shape. This problem
that we are not limited to basic squares and rectangles for our problems. To create this, we used the Snapping Strokes method in the Authoring Tool.
The final Fraction Coloring Problem provides an outer-boundary but not inner guidelines for an odd, non-orthodox shape. This exercise is designed to show that the Recognition Grid is not limited to basic shapes such as squares. Instead, the Recognition Grid will be able to trace the boundary of the provided by the problem creator and determine the total area of the shape. Then when students color in the shape, the Recognition Grid will determine which rectangles that contain strokes are within the boundary of the outer shape and use these rectangles to contribute to the final ratio of rectangles colored. That ratio will be used to determine if the student colored in the correct fraction of the shape or not.
5.2.2 Table Entry Problems
The next class of problems is table entry problems. Tables are great for handwriting recognition because they specify to the program where it should expect certain solutions. In this group of problems, the Diagnostic attempts to find what tables can and cannot convey to the Recognition Grid tool.
5. Write the numbers 1 to 12 in order in the table, starting at the beginning of the top row.
Problem 5-5: A basic table entry problem. Students are asked to fill numbers into the
table. This will test the Recognition Grid's ability to understand elementary school level handwriting as well as the students' ability to stay within the lines for each cell.
The next problem has students write numbers in a grid in ascending order, starting at the beginning of the top row. Behind each of these cells in the grid, we have a rectangle in the Recognition Grid that is waiting to capture and interpret the Strokes. This exercise will test the Ink Analyzer's ability to recognize numbers. In addition, we want to see if fourth grade students are able to stay within the lines when writing their solutions. If students begin writing too large of numbers and those numbers spill over into other cells in the table, the Ink Analyzer's accuracy will drop.
6. Put check marks in the white squares, put X marks in the gray squares, put nothing in the yellow squares
Figure 5-6: A table entry problem with check marks and X's. This problem will test
the Recognition Grid's ability to understand non-traditional characters, on top of the list of difficulties described in Figure 7-5.
This next problem asks students to put check marks and "X" marks depending on the background color of the square. This exercise is easily designable by a teacher in the authoring mode. During the handwriting diagnostic, we want to make sure that the Recognition Grid can process non-traditional characters such as a check mark. We may be forced to write our own symbol detector by adding more rows and columns to the Recognition Grid that is behind the Canvas and creating tools that can distinguish between a check mark's gridded pattern and an X mark's gridded pattern.
Table Entry Problem 3
7. Write these numbers in order in the table starting at the beginning of the top row:
0.0 1.1 2.2 3.3 4.4
5.5 6.6 7.7 8.8 9.9
Figure 5-7: A table entry problem with decimals. The problem tests the Ink Analyzer's
ability to detect decimal points in addition to all of the complications mentioned in Figure 7-5.
This next problem is very similar to Table Entry Problem 1. In this problem, we want to test the Ink Analyzer's ability to recognize decimal points. Depending on how the Recognition Grid is able to interpret these numbers, we may or may not have to add additional structure to problems that have decimals in their solutions.
5.2.3 Number Grid Problems
Teachers often ask number grid problems that consist of a large grid with integers
identify multiples of certain numbers, because the number grid can help reveal the pattern behind certain multiples. This is a good class of problems to include in our handwriting diagnostic because they inherently have a lot of structure in them. Student Ink Strokes will naturally be concentrated inside of the grid cells, and any handwriting recognition being performed can specifically look for Ink there.
Number Grid Problem 1
8. Circle in red the multiples of 2. Circle in blue the multiples of 3
1
2
3
4
5
6
7
8
9
10
11
12
Figure 5-8: A basic number grid problem. The use of color in the problem adds an
additional layer of structure that the Recognition Grid will use to grade the problem. Possible difficulties include Ink Strokes spilling into neighboring cells and errant marks.
In another problem, we asked students to circle the multiples of two and then the multiples of three. We add the notion of color because we determined earlier than color can be extracted from the strokes and used as a great structuring mechanism. Not only can the Recognition Grid look in specific cells for Ink, but the Recognition Grid can also parse the color to determine what numbers the student believes are multiples of two and multiples of three. As long as the students' Ink Strokes stay within the lines, this
solutions for this exercise should be fairly straightforward to interpret.
5.2.4
Shape Drawing Problems
9. Make a shape with an area of 5 square units. Draw and color it in on the dot grid.
Use squares and trianqles in your answer
Figure 5-9: A basic shape drawing problem. To grade this advanced problem, the
Recognition Grid must be able to detect and trace the boundary of the shape and then calculate the area inside.
This problem asks the students to use the dots in the background as guidance to draw a shape with area of five square units. The Recognition Grid may try to detect the boundary rectangles of the shape. If proves too difficult, we could remake the problem by asking the students to color in their shape, allowing the Recognition Grid to take a ratio of
rectangles with strokes to total rectangles.
5.2.5 Number Line Problems
Number line problems are a great example of the advantages of new active-support CLP tools. We are able to ask students questions relating to the material they are currently
learning without having to simplify the questions into multiple-choice problems. In number lines and graphs, students interact with the problem environment in interesting ways. If the Recognition Grid was able to interpret the students' solutions, INK-12 can begin introducing a new class of interesting problems that can be auto-graded by the software itself.
Number Line Problem 1
10a. On the number line below add number markers in black for 3, 4, and 5.
b. Add number markers in black for 6 through 9.
c. Add number labels in blue for 6 through 9.
d. Above 2, 6, and 8 draw circles of any color and size and color them in
0 1 2 3 4 5 10
Figure 5-10: Students are asked to put tick marks on a number line and label them and then draw circles above the number line. The Recognition Grid must distinguish
between tick marks and labels but then determine which labels correspond to which tick marks. Then, the program must measure the drawn shapes according to the interpreted labels to determine if the circles are drawn at the proper location.
This number line problem takes advantage of color structure by asking the students to add number markers in black and number labels in blue. This makes life easier on the
Recognition Grid by allowing the Recognition Grid to limit its search to only Strokes with a specific color. Then, the problem asks students to draw circles above the number line. This stipulation allows the Recognition Grid to try to interpret the circles only in a particular location on the problem. We will see if these conditions are enough for the Recognition Grid to be able to distinguish between correct and incorrect solutions, and if there are incorrect solutions, we will see if the Recognition Grid can single out which part of the problem was done incorrectly.
Number Line Problem 2
10e. A weight line is a number line for weights. Fill in the number markers for the weight
line below. Each label should have a number and the letter g (for grams), just like the Og,
4g, and 10g below.
Og 4g log
10f. You have 3 seashells that have different weights---2 grams, 5 grams, and 8 grams. On the weight line above that you just labeled, show where you would put each shell by drawing a shape above its weight. Draw the shape for the 2 gram shell in red, for the 5 gram in blue, and for the 8 gram in green.
Figure 5-11: Another complicated number line problem. This version of the number line adds structure to the student solution by requiring the different seashells be in different colors.
This next number line problem is very similar to the last one, except now we are testing the Ink Analyzer's ability to read numbers and letters within the same area. We want to be able to parse the number as well as the units, which in this problem is 'g' for grams.
Number Line Problem 3 (see Figure 7-11)
This final problem number line problem allows the students to design their own shapes, in this case a shell. The students can design the shells in any way they choose; the Recognition Grid will use the color of the shells to figure out which shell the student meant to correspond to which weight.
5.2.6 Graph Problems
Graph Problems are an important goal of Recognition Grids. Being able to understand free-hand graphs requires a lot of detection and inference on the computer's part: detecting the axes and axes labels, finding the tic marks and their corresponding labels, and finally reading the curves as well as any annotations the students may have added. In order to slowly work our way there, we first structure the problem such that there are less factors for the Recognition Grid to deal with. Graphing problems will continue to be an important part of INK-12 research in the coming years.
Graph Problem 1
11. Plot these points in the color indicated (5, 10) black
(0, 5) red (15, 15) green (2, 2) purple
Figure 5-12: Students are asked to plot different points in different colors. They are
given the x and y-axis as well as background grid lines to help them visually draw lines from the axes.
One helpful tool that young students may need when graphing is a grid. A grid in the background of the graph gives students guidelines to follow when tracing from the x-axis and y-axis. In the first problem, we provide the students the axes, the axes labels, tic marks, tic labels, and a background grid. We have isolated it so that they only thing the
students need to add are the points in their specified colors. This example will test if, by providing enough structure to the problem, students will answer the problem in a way that is very easy for the Recognition Grid to interpret.
Graph Problem 2
12. Plot these points in the color indicated
(0, 5) black (15, 20) green (10, 10) blue
(12, 7) purple 201
Figure 5-13: Another problem where students are asked to plot points in different
colors. Unlike the problem in Figure 7-12, the background grid is no longer provided for the students, making it harder to measure from the axes visually. We expect less accurate solutions as a result of this removal of structure.
The next graph problem poses the same question as the previous problem, except now we have removed the background grid. We will see if the removal of this structure in the problem affects how students answer the problem. Once again, the optimal solutions for the Recognition Grid are if the student only plots the points in the specified colors and does not add any other additional strokes to the InkCanvas. If the student does add extra strokes that are not the points, the Recognition Grid must figure out which Ink Strokes are relevant to the answer and which strokes are scratch work.
Graph Problem 3
13. Here is a table that shows how tall a plant was each day for 6 days. Create a graph that shows the growth of the plant by plotting these 6 points and connecting with them a line.
Day Height of Plant
1 1 cm 2 3 cm 3 5 cm 4 6 cm 5 10 cm 6 11 cm -4-* V
Kay
Figure 5-14: Students are asked to plot points and then connect them with a line. This will test students' abilities to associate different data columns with different axes and their ability to comprehend line graphs.
The next problem adds the notion of a "line graph" so that the Recognition Grid is no longer just detecting points. Lines are harder to interpret than points for several reasons. With points, the Recognition Grid can narrow down exactly where the areas of interest are. With lines and curves, the Recognition Grid must be able to detect where the lines change direction, which in turn correspond to the points that the students are asked to plot. Even if the students first plot the points and then connect them with the lines, the Recognition Grid must face the difficult task of distinguishing between points and the lines that go through them.
14. Here is a table that shows how tall a plant was each day for 6 days. Create a graph that shows the growth of the plant by plotting these 6 points and connecting with them a line.
Day Height of Plant
1 2 cm 2 5 cm 3 6 cm 4 9 cm 5 10 cm 6 11 cm it ~
Figure 5-15: A similar problem to the one in Figure 7-14, except students are not given the x or y-axis. This will test the Recognition Grid's ability to recognize the axes
and their labels and then determine the correctness of the line graph with respect to these axes. This is extremely complicated and we will collect data so that a future version of the Recognition Grid can eventually test its grading mechanism for this problem.
This is the most difficult problem in the whole diagnostic for the Recognition Grid to interpret, and I do not expect the current iteration of the CLP software to be able to solve this until much later into the four year grant. In this problem, the students are provided a grid and nothing else. They are tasked to draw the axes, the tic marks, the tic mark labels,
the points from the table, and then the lines to connect the points. All of the above strokes must be interpreted by the Recognition Grid and sorted into the proper category, and if any one of these elements is interpreted correctly, the student solution could be
recognized incorrectly. For example, if an x-axis tic marker label is interpreted incorrectly, the software may mistakenly believe that the student plotted the line incorrectly along the x-axis. This problem is designed not so much to test the existing capabilities of the Recognition Grid, but the gather data for future development on it.
5.2.7 Text Sampling Problems
The text sampling problems are the last two problems that show up on the page. These problems are meant to test the accuracy of the Ink Analyzer when it is tasked with interpreting plain text. We separate the copying section from the answer section by asking the students to write their solution in a bolded box. This way, we can test if there is enough structure in the problem when we try to geographically separate two different parts of a student solution.
15. Copy the following words and punctuation exactly, then in the box write your answer to the riddle: 1. What goes up the chimney down,
But can't go down the chimney up?
zmJ
Figure 5-16: Students are asked to copy a piece of text and then give a one-word
answer in the box. Hopefully the students will keep their answers contained in the box.
16. Copy the following words and
2. What comes once in a minute, Twice in a moment,
But never in a thousand years?
punctuation exactly, then in the box write your answer to the riddle:
Elilill
Chapter 6
Results of the Handwriting Diagnostic
This thesis focuses on testing the effects of structure on handwriting recognition in the classroom. The groups of handwriting diagnostic exercises were chosen
specifically so that students would answer similar questions consecutively with the same general knowledge on the topic. Each of the questions in a group varied not in its
difficulty but in the amount of structure provided to the student. We wanted to quantify the impact that this structure would provide the student.
Initially, I hypothesized that as a student is provided more structure for an exercise, the more accurate the results would be when interpreted by the Recognition Grid. We will test this hypothesis by comparing within the groups of diagnostic exercises and quantifying the differences in the student results. This task will require some
subjective decision making on my part, because I have to visually check if certain student solutions are obviously correct or obviously incorrect. To produce more accurate
representations of the Recognition Grid results, I added a third category called
"borderline" answers that will encompass results that are not entirely correct or incorrect. The ultimate goal of the Handwriting Diagnostic, beyond proving or disproving the hypothesis, is seeing whether or not a statistical method can be created to aggregate
and sort the different student solutions. For example, is it possible to use the standard deviation of students' results as a way to sort the correct and incorrect solutions? Would all correct solutions fall within X standard deviations, and all incorrect solutions fall
outside Y standard deviations? As we examine the results of the diagnostic problems, we will keep this goal in mind. Due to time constraint, not all students worked all problems. The following sets of problems had sufficient numbers of student answers for our analysis.
6.1 Structure in the Fraction Coloring Problems
For our first comparison, we took exercises 1 and 2, which are the problems in which the students are asked to color in 1/3 of a square and then 1/2 of a square, respectively. Students worked with an internal grid in problem 1, whereas the students did not have that internal grid in problem 2. In both problems, the students were given the outer boundary of the square that they are asked to color.
We collected 19 student solutions of the first problem, of which two were obviously incorrect. The two students who answered the problem incorrectly colored in 1/9 of the square or 5/9 of the square. Of the remaining 17 solutions, 13 had the correct solution, while four were mostly correct but were either slightly under-colored or oddly colored in a way, and I subjectively classified these 4 solutions as "borderline" prior to seeing the results of the Recognition Grid. It is important that the "borderline" tag was applied before seeing what the Recognition Grid returned, as this will give me a fair assessment of how well the Recognition Grid classifies the student solutions compared to human classification.
For the second problem, we also collected 19 student solutions from the same students, of which one was obviously incorrect. Of the remaining 18 solutions, 15 were obviously correct, while three were subjectively tagged as borderline. Once again, the borderline description was applied before the results of the Recognition Grid were calculated.
In both problems, the dimensions of the Recognition Grid were 50 x 50, or 2500
rectangles in total. The number of rectangles enclosed by the square is only 900, because the Recognition Grid provided some padding between the edge of the outer bounds of the square and the edge of the Recognition Grid. This is done so that for some exercises, the computer can record the ink strokes outside of the exercise, either for scratch work analysis or other purposes.
So out of the 900 rectangles that are apart of the square's interior, the fully correct
solution to problem one would have Ink Strokes in 300 of those grid rectangles (1/3), and the fully correct solution to problem two would have Ink Strokes in 450 of those grid rectangles (1/2).
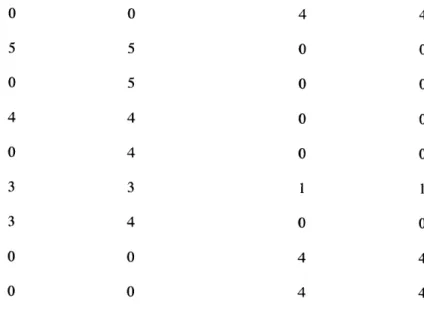
Rectangles with Ink Human Correct Human Incorrect Human Borderline
305 305 284 284 288 288 284 284 322 322 100 100 313 313
272 522 264 280 293 297 287 277 294 266 245 293 272 522 264 280 293 297 287 277 294 266 245 293
Figure 6-1: The student solutions for the first fraction-coloring problem, where
students were giving the interior grid.
Rectangles with Ink Human Correct
288.734 290.46 72.92 12.93 Human Incorrect 311 298.40 Human Borderline 272 28.93
Figure 6-2: The statistics of all the student solutions for the first fraction-coloring
problem.
Average
Problem One's Empirical Distribution
1.2 1 0.8 0.6 0.4 0.2 0 - . I I. --
-
.
.I
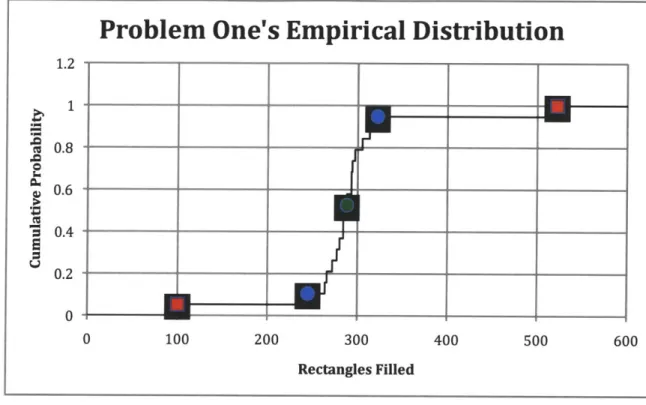
0 100 200 300 400 500 600 Rectangles FilledFigure 6-3: The empirical distribution function (ECDF) for the first fraction-coloring problem's solutions. The green circle is the point closest to the average of the
student solutions. The blue circles are the left and right bounds for all data-points within one standard deviation of the mean. The two red rectangles are the solutions determined to be incorrect by eye.
We see here that the overall trend of the students was skewed slightly to the left of the absolute 300 rectangles for a correct solution. We attribute this to not fully coloring in every part of the square shape's third and the fact that we discounted the filled rectangles that were outside of the square's outer boundary. These two factors led to the
Recognition Grid producing scores lower than the absolute 300, and this is something we should account for in future exercises.
There are several ways that the Recognition Grid could distinguish between correct, incorrect, and borderline solutions. The two variables in determining this are 1) what the software uses as the model solution and 2) how we separate between correct, borderline, and incorrect solutions.
Two options that the Recognition Grid could use as the model solution are the exact correct solution or the average student solution. On one hand, using the exact correct solution avoids the scenario in which many students solve the problem incorrectly in the same manner, skewing the average solution away from the correct solution. On the other hand, the average solution accounts for factors such as under-coloring that might be apart of the reality of doing a problem on a tablet computer instead of on paper.
Two options that we could use to determine the correctness of solutions are to use the standard deviation of the student provided solutions or some arbitrary margin of error that we create ourselves. The arbitrary margin of error will probably depend on the amount of structure the problem has, as the more structure a problem has the less leeway instructors should give the students. For both, let's assume that anything within one margin is correct, anything between one and two margins is borderline, and anything greater than two margins from the model solution is incorrect.
Correct /13 Incorrect /2 Borderline /4 Total
Avg + 10% Margin
Exact + Std Dev
Exact + 10% Margin
Figure 6-4: How well the above methods classified the solutions. They are measured
against my eyeballed judgment to show how the program's grading would compare against human grading.
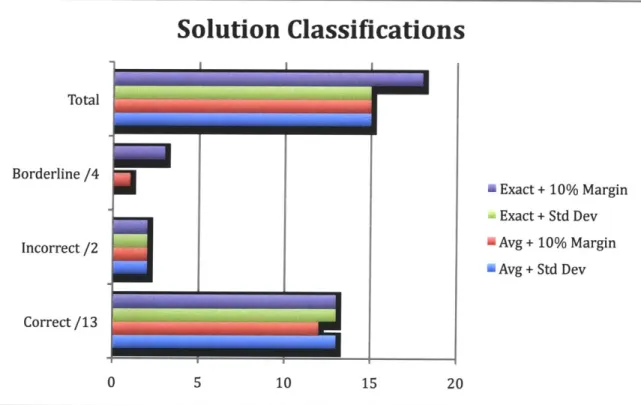
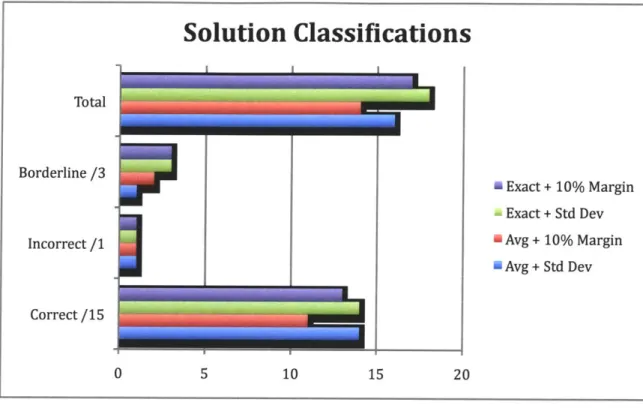
Solution Classifications
Total Borderline /4 Incorrect /2 Correct /13 U Exact + 10% Margin Exact + Std Dev Avg + 10% Margin mAvg + Std Dev 0 5 10 15Figure 6-5: A visual representation of the method's effectiveness in grading the first
fraction-coloring problem. We see that for this problem, using the exact solution as the
model solution and a 10% margin yields the most correctly classified student solutions.