HAL Id: insu-02515922
https://hal-insu.archives-ouvertes.fr/insu-02515922
Submitted on 23 Mar 2020
HAL is a multi-disciplinary open access
archive for the deposit and dissemination of
sci-entific research documents, whether they are
pub-lished or not. The documents may come from
teaching and research institutions in France or
abroad, or from public or private research centers.
L’archive ouverte pluridisciplinaire HAL, est
destinée au dépôt et à la diffusion de documents
scientifiques de niveau recherche, publiés ou non,
émanant des établissements d’enseignement et de
recherche français ou étrangers, des laboratoires
publics ou privés.
high-latitude ionospheric convection during an IMF
By-dominated period
I. Coco, E. Amata, M.F. Marcucci, D. Ambrosino, J.P Vilain, Christian
Hanuise
To cite this version:
I. Coco, E. Amata, M.F. Marcucci, D. Ambrosino, J.P Vilain, et al.. The effects of an interplanetary
shock on the high-latitude ionospheric convection during an IMF By-dominated period. Annales
Geophysicae, European Geosciences Union, 2008, 26 (9), pp.2937-2951. �10.5194/angeo-26-2937-2008�.
�insu-02515922�
ionospheric convection during an IMF B
y
-dominated period
I. Coco1, E. Amata1, M. F. Marcucci1, D. Ambrosino1, J.-P. Villain2, †, and C. Hanuise21Istituto di Fisica dello Spazio Interplanetario (IFSI), INAF, Rome, Italy
2Laboratoire de Physique et Chimie de l’Environnement (LPCE), CNRS/Université d’Orléans, Orléans, France †deceased January 2008
Received: 4 April 2008 – Revised: 25 July 2008 – Accepted: 27 August 2008 – Published: 25 September 2008
Abstract. On 6 January 1998 an interplanetary shock hit
the magnetosphere around 14:15 UT and caused a recon-figuration of the northern high-latitude ionospheric convec-tion. We use SuperDARN, spacecraft and ground magne-tometer data to study such reconfiguration. We find that the shock front was tilted towards the morning flank of the mag-netosphere, while the Interplanetary Magnetic Field (IMF) was By-dominated, with By<0, IMF Bz>0 and |By| Bz. As expected, the magnetospheric compression started at the first impact point of the shock on the magnetopause caus-ing an increase of the Chapman-Ferraro current from dawn to dusk and yielding an increase of the geomagnetic field at the geostationary orbit and on the ground. Moreover, the high-latitude magnetometer data show vortical struc-tures clearly related to the interaction of the shock with the magnetosphere-ionosphere system. In this context, the Su-perDARN convection maps show that at very high latitudes above the northern Cusp and in the morning sector, intense sunward convection fluxes appear, well correlated in time with the SI arrival, having a signature typical for Bz>0 dom-inated lobe reconnection. We suggest that in this case the dy-namic pressure increase associated to the shock plays a role in favouring the setting up of a new lobe merging line albeit |By| Bz≥0.
Keywords. Interplanetary physics (Interplanetary shocks) –
Magnetospheric physics (Magnetosphere-ionosphere inter-actions; Plasma convection)
1 Introduction
The global patterns of the high-latitude ionospheric convec-tion are mostly determined by magnetic reconnecconvec-tion at the magnetopause and in the tail. When the Interplanetary
Mag-Correspondence to: I. Coco
netic Field (IMF) points southward, i.e. when its GSM z component is negative (Bz<0), reconnection occurs close to the subsolar magnetopause and far in the tail, producing a two-cell ionospheric convection pattern where plasma flows antisunward in the polar cap, and sunward at lower latitudes; when Bz>0, reconnection should take place at high latitudes tailward of the Cusps, producing double reversed-cell pat-terns, where plasma flows sunward in the polar cap and anti-sunward at lower latitudes (e.g. Dungey, 1961; Burke et al., 1979; Huang et al., 2000). The IMF By component acts on the size and the symmetry of the convection patterns in the east-west direction: when By<0 (>0) the whole pattern is ro-tated dawnward (duskward) and the dusk (dawn) cell is usu-ally bigger than the other one (e.g. Crooker, 1979; Reiff and Burch, 1985; Gosling et al., 1990; Ruohoniemi and Green-wald, 1996, 2005). When Bz≥0, an important role can be played by the magnetic dipole tilt and the IMF Bx compo-nent (Cowley, 1983; Crooker and Rich, 1993; Lockwood and Moen, 1999): the dipole tilt could favour reconnection tailward of the Cusp in the Northern Hemisphere during the boreal summer, and in the Southern Hemisphere during the austral summer; however, a large negative (positive) Bxis be-lieved to alter such seasonal effect, and favour reconnection tailward of the Northern (Southern) Cusp.
The variations of solar wind dynamic pressure are known to affect the energy and momentum transfer between the so-lar wind and the magnetosphere and, as a consequence, the ionospheric convection patterns (e.g. Sibeck, 1990; Araki, 1994). To this respect, two important factors are the rise time and the duration of the pressure perturbation. For short rise times strong transient perturbations are observed both in the magnetosphere and in the ionosphere until a new location of the magnetopause boundary is established; on the other hand, the duration of a pressure perturbation determines whether the effects will be localized or global (Boudouridis et al., 2003).
If the duration is long enough to engulf most of the magne-tosphere in the solar wind region of enhanced/reduced pres-sure, the pressure variation causes typical global increases of the geomagnetic field strength measured at the geosta-tionary orbit, and on the ground at equatorial and middle latitudes, which are usually called Sudden Commencements (SC) or Sudden Impulses (SI), depending on whether they are followed by a geomagnetic storm (SC), or not (SI); in such cases, often one refers to the pressure variation itself as an SI, and this is the notation we will follow from now on. A pressure perturbation of that kind generates a compres-sive MHD wave which will propagate in the magnetospheric cavity (e.g. Wilken et al., 1982; Southwood and Kivelson, 1990; Erlandson et al., 1991). Coupling to the high-latitude ionosphere requires the generation of a Field Aligned Cur-rent (FAC) system that is carried by a field-guided Alfvén mode: this can occur where inhomogeneities exist in the magnetospheric plasma and magnetic field (Araki, 1994, and references therein). The FAC system leads to the forma-tion of pairs of current and convecforma-tion vortices in the high-latitude ionosphere, almost symmetric around noon, whose signatures are well identified in ground magnetometers (e.g. Araki, 1994; Russell and Ginskey, 1995), and radar data (e.g. Thorolfsson et al., 2001; Vontrat-Reberac et al., 2002): they cover wide magnetic latitude and local time regions and their centres usually lie on closed field lines. Also aurora obser-vations have evidenced SI-induced global effects: the bright-ness of the aurora and the intensity of electron precipitation increase in the whole oval, and a southward expansion of the equatorward edge of the auroral oval has often been reported (e.g. Zhou and Tsurutani, 1999; Boudouridis et al., 2003; Kozlovsky et al., 2005). It is generally thought that Field-Line Resonances (FLRs) can originate in the inner magneto-sphere due to the Alfvén modes excitation, and this mecha-nism, along with the pure mechanical compression caused by the SI, can transfer enough energy to the trapped particles to cause them to escape the confinement via the loss-cone insta-bility. Ground traces of FLRs or, in general, of periodic field oscillations (Pc5) have been actually observed, closely re-lated to solar wind pressure perturbations (e.g. Prikryl et al., 1998; Francia et al., 1999; Motoba et al., 2003). As these ef-fects are thought to take place on closed field lines, one does not expect to observe relevant ground SI signatures at very high latitudes, where the footprints of the Cusps and of the Low Latitude Boundary Layer (LLBL) usually map. Nev-ertheless, Newell and Meng (1994) have found through the statistical observation of the precipitating particles, that the ionospheric Cusps and the LLBL are considerably larger dur-ing periods of high solar wind dynamic pressure than when the pressure is low, and Coco et al. (2005) also observed that the number of SuperDARN radar echoes increases both at latitudes in the oval and at higher latitudes in the Cusp dur-ing an SI.
Pressure pulses of shorter time scales, on the other hand, are not supposed to lead to a global reconfiguration of the
magnetosphere, but rather to induce local bulges or inden-tations in the magnetopause, which propagate along that boundary, dragged by the solar wind motion. Many mod-els exist to explain the coupling with the high-latitude iono-sphere (e.g. Glassmeier et al., 1989; Kivelson and South-wood, 1991; Sibeck et al., 2003). Without going too deeply in the details, there is a general agreement on the fact that FACs are generated inside the magnetosphere where the plasma density gradient suffers a steep change, e.g. at the boundary between the LLBL and the Central Plasma Sheet. FACs map in the ionosphere at latitudes close to the Open-Closed field line Boundary (OCB) leading one or more vortex-like structures, that move following the footprints of the FACs. Such vortices are also called Travelling Convec-tion Vortices (TCV), and a recent review on that topic can be found in Zesta et al. (2002).
In this paper we study an event during which a large dy-namic pressure increase (SI) occurred in the solar wind in co-incidence with a strong IMF By decrease and try to identify and describe the effects induced on the ionospheric convec-tion by the SI on one hand and by the IMF change on the other. The study is mainly based on SuperDARN Northern Hemisphere convection maps, but makes also use of ground magnetometer data and of space borne data. The paper is structured as follows: Sect. 2 offers an overview of the ob-servations made by spacecraft in the solar wind and in the magnetosphere (Sect. 2.1), by ground-based magnetometers (Sect. 2.2), and by SuperDARN in the Northern Hemisphere (Sect. 2.3); the observations are then discussed in detail in Sect. 3 and Sect. 4 contains a brief summary of our conclu-sions.
2 Observations overview
2.1 Observations in space
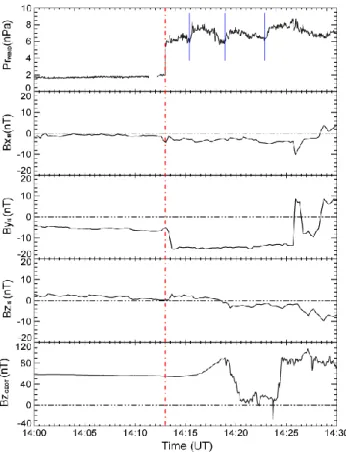
Figure 1 shows, from top to bottom: the solar wind dynamic pressure observed by WIND on 6 January 1998 between 13:15:38 and 13:45:38 UT (3 s resolution, GSM position: X=227 RE, Y =20 RE, Z=−5 RE); the GSM Bx, By, Bz components of the IMF as observed by IMP-8 on 6 January 1998 between 14:00 and 14:30 UT (16 s resolution, GSM po-sition: X=29 RE, Y =−1 RE, Z=14.5 RE); the GSM Bz component of the magnetic field as observed by GEOTAIL on 6 January 1998 between 14 and 14:30 UT (3 s resolution, GSM position: X=7 RE, Y =6 RE, Z=0.5 RE). In the fig-ure, the WIND data have been delayed by 4402200 in order to match the IMP-8 and GEOTAIL features. At 13:28:57 UT (14:12:09 UT in the top panel of Fig. 1), a sharp discontinu-ity of the plasma parameters is observed at WIND (red dash-dotted line): the pressure jumps from 2 to 6 nPa, due to in-creases of both the proton number density (1n'12 pp/cm3) and velocity (1V '80 km/s). As the increase of the solar wind velocity exceeds the Alfvén and sound speeds of the
Fig. 1. WIND, IMP-8 and GEOTAIL observations on 6 January 1998. From top to bottom: solar wind dynamic pressure (in nPa)
measured by WIND, IMF Bx, By, Bz GSM components (in nT)
measured by IMP-8, and the GSM Bzcomponent of the magnetic
field measured by GEOTAIL. The UT time refers to IMP-8 and GEOTAIL observations, while WIND observations are delayed by 4402200.
undisturbed solar wind (VA'31 km/s and Cs'38 km/s, re-spectively), the discontinuity is an interplanetary shock. Af-ter the shock, at least three minor pressure variations are seen, of the order of 1.5–2 nPa, each one lasting for about 4– 5 min (blue lines in the figure). At IMP-8 a clear discontinu-ity is observed in the IMF data at 14:13:20 UT, when a steep decrease of the By component occurs from −7 to −15 nT. Before the discontinuity Bzis positive (fourth panel from the top), or just close to zero; when the discontinuity occurs, Bz has a small increase and switches to negative values at about 14:18 UT. Bx is slightly negative or close to zero during the whole interval (second panel from the top). Unfortunately, no plasma data are available for IMP-8 at this time, but we can unambiguously identify this IMF feature as the shock observed at WIND at 13:28:57 UT, thanks to the fact that the main IMF features observed at IMP-8 are also observed at WIND and at ACE (which was at about 20 REfrom WIND). In order not to overload the figure, we displayed IMF data for IMP-8 only, which is located much closer to the Earth’s bow shock and magnetopause than WIND and ACE. At
GEO-Fig. 2. Locations of the spacecraft used in this study in the XY GSM plane (axis scales in Earth radii, RE).
TAIL all the field components experience a progressive in-crease starting around 14:16 UT (only Bz is shown, as an example, in Fig. 1, bottom panel), indicating that the inter-planetary shock has reached the magnetopause and the mag-netosphere is being compressed, until the field components switch over about 80 s, starting at 14:19 UT, to values typical of the magnetosheath, indicating that the magnetopause has been pushed past the GEOTAIL position.
The time delay between the WIND and the IMP-8 ob-servations of the bow shock is 1t =4402200, i.e. it is sub-stantially shorter than the ballistic travel time between the two spacecraft along the X axis: 1t'1X/V '5503000 (as 1X=198 RE and the solar wind speed behind the shock is 380 km/s). This suggests that the shock front is probably tilted so that its normal forms an angle greater than 180◦with the GSM X axis, as we will further discuss in Sect. 3.1. Fig-ure 2 shows the average locations of the bow shock and the magnetopause and the positions, projected onto the XY GSM plane, for all satellites whose data have been inspected for the present study. Figure 2 also displays the intersection with the GSM XY plane at IMP-8 of a tilted shock front compatible with the observed delays.
2.2 Ground-based magnetometer observations
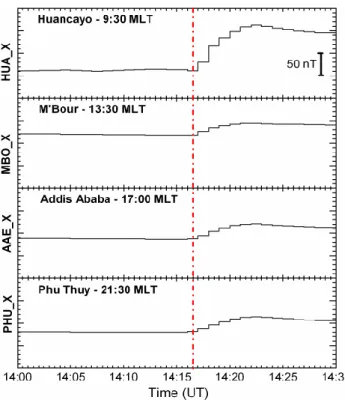
Figure 3 shows the horizontal component (X) of the geomag-netic field for a selection of four low latitude magnetometers with 1 min resolution, displayed in increasing order of Mag-netic Local Time (MLT) from top to bottom, on 6 January 1998 between 14:00 and 14:30 UT. All four magnetograms show an increase starting at 14:16:30 UT, i.e. 3 min after the passage of the shock at IMP-8, and lasting until 14:22 UT, with a signature very similar to that observed by GEOTAIL. The effect appears to be global and simultaneous, and has the characteristics of an SI. Nevertheless, the X component vari-ation is generally small, not exceeding 40–50 nT, with the only exception of Huancayo, located near the geomagnetic equator on the morning side, where the SI amplitude reaches 120 nT.
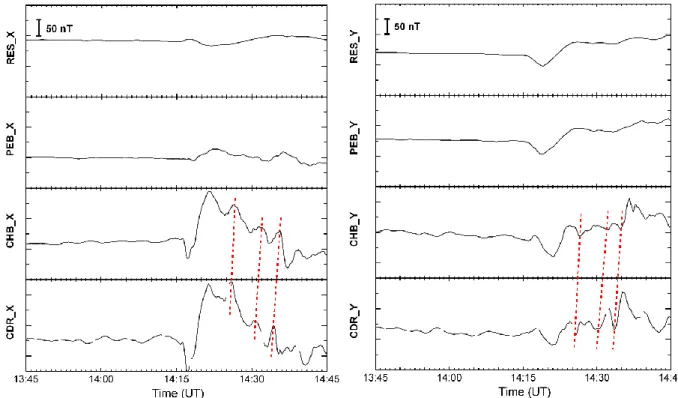
Figure 4 shows 5 s sampling magnetograms of the X (North-South) component of the geomagnetic field (left hand panels) and of the Y (East-West) component (right hand
Fig. 3. Horizontal component (X) of magnetograms from ground-based stations close to the geomagnetic equator, in increasing order of MLT from top to bottom, on 6 January 1998 between 14:00 and 14:30 UT.
panels) between 13:45 and 14:45 UT on 6 January 1998 for four stations belonging to the Magnetometer Array for Cusp and Cleft Studies (MACCS), while no data could be retrieved for this period from the Canopus magnetometer chain. The stations are all located between ∼07:00 and ∼10:00 MLT and are presented, from top to bottom, in de-creasing order of Magnetic Latitude (MLAT). The X compo-nent of the higher latitude stations (RES, ∼83◦MLAT, and PEB, ∼79◦MLAT) is not affected much by the interplane-tary shock: only a broad wave-like disturbance is noticed, starting at 14:15:40 UT at RES and at 14:16:30 UT at PEB and lasting several minutes, with peak-to-peak amplitude not exceeding 40 nT. On the other hand, at lower latitude stations (CHB and CDR∼75◦MLAT), the X component shows sig-natures which can be related to the shock: at 14:15:40 UT a double pulse starts, with a short and steep negative peak at 14:16 UT, which precedes a broader and smoother posi-tive peak at 14:18:20 UT. Looking at the Y component (right side of Fig. 4) of the magnetograms, both lower and higher latitude stations show a dip of the field starting between 14:15:30 and 14:17 UT and lasting for about ten minutes.
After the SI signature, both the X and the Y components at lower latitude stations show a series of magnetic transients (see the red dashed lines in Fig. 4) which have the following characteristics: 1) The X and the Y components show a phase difference of about 90◦, 2) the transients are first noticed at
CDR (∼09:40 MLT), then at CHB (∼09:00 MLT), i.e. they move westward, away from noon; the estimated speed is 7– 8 km/s.
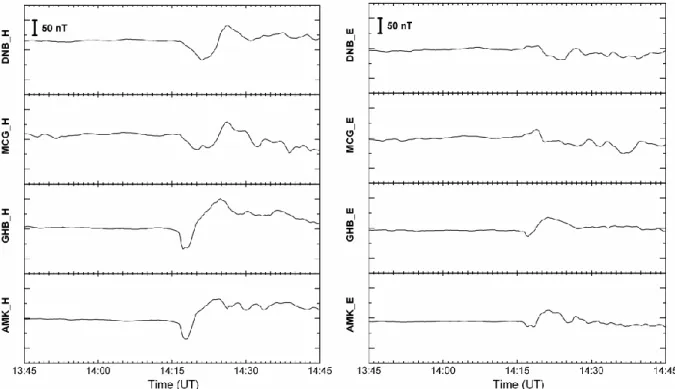
Figure 5 shows a selection of 20 s sampling magnetograms from four stations between 13:00 and 15:00 MLT, which belong to the Danish Meteorological Institute (DMI) array and to the Magnetometer Array on the Greenland Ice Cap (MAGIC), in decreasing order of MLAT, from top to bot-tom, on 6 January 1998 between 13:45 and 14:45 UT. The H (North-South) and the E (East-West) components of the geo-magnetic field are displayed in the left and right hand panels, respectively. In general, the H component starts to decrease at 14:15:40 UT, although the rate is different from station to station. As a matter of fact one can recognize a differ-ent behaviour between the higher and lower latitude stations. At the two higher latitude stations (MCG, ∼76.4◦MLAT, and DNB, ∼75.2◦MLAT) we observe a broader response of the H component, which slowly decreases until about 14:18 UT, while the E component does not display strong variations until 14:17 UT, when a rapid fall occurs at both sta-tions, not exceeding 40 nT. The lower latitude stations (GHB, ∼70.5◦MLAT, and AMK, ∼69.3◦MLAT) show a bipolar pulse of both the H and E components: a fast pulse with negative slope precedes a broader pulse with positive slope. That signature starts at about 14:15:40 UT and lasts for about 8 min.
In conclusion, we can say that the first effects of the shock passage at the high-latitude dayside ground magnetometers show up roughly 3 min after its detection by IMP-8.
2.3 SuperDARN convection maps
The Super Dual Auroral Radar Network (SuperDARN) is fully described by Greenwald et al. (1995) and by Chisham et al. (2007). The Doppler phase-shift of the radar echoes al-lows to determine the velocities of the sounded ionospheric irregularities along the line of sight. As in the F region such irregularities follow the drift of the ambient plasma, this yields a measure of the plasma convection velocity (e.g. Hanuise et al., 1985; Villain et al., 1986). In the common mode of operation, a complete scan of the whole field of view is performed in two minutes over 16 azimuthal beams and 75 range gates with a typical space resolution of 45 km. In addition to the line of sight velocity, from each beam and range the analysis of the radar echoes allows to calculate the signal-to-noise ratio (maximum reflected power) and the spectral width. This last quantity is related to the plasma tur-bulence processes in the sounded region, and is often used to discriminate the ionospheric footprints of different magneto-spheric regions (e.g. Hanuise et al., 1993; Baker et al., 1995; Chisham et al., 2008).
In order to have a global picture of the high-latitude iono-spheric convection, it is often useful to merge the line-of-sight velocities measured by the single SuperDARN radars through the map potential technique (Ruohoniemi and Baker,
Fig. 4. High latitude magnetograms from the MACCS chain, above Northern Canada (morning MLT), on 6 January 1998 between 13:45 and 14:45 UT. The left side of the figure shows the X (North-South) component, the right side displays the Y component (East-West). The
stations are displayed in decreasing order of magnetic latitude from the northernmost, on top (RES – Resolute Bay, ∼83◦MLAT), to the
southernmost, on bottom (CDR – Cape Dorset, ∼74.5◦MLAT). The red dashed lines evidence the evolution of magnetic transients moving
from CDR to CHB.
1998). The efficiency of the technique in recostructing the actual convection streamlines crucially depends on data cov-erage: the technique makes use of additional data points de-termined by an empirical model of convection (Ruohoniemi and Greenwald, 1996 and 2005); where the coverage is good, the reconstructed maps are univocally determined by the ac-tual measurements while, conversely, in cases of poor or ab-sent coverage, the influence of the model on the convection patterns is very strong. For the present event, we carefully inspected the original velocities measured along the fields of view for all the available radars, and verified that all the fea-tures described hereafter are consistent with the actual radar measurements.
The results of the map potential analysis can be seen in Figs. 6 which display two 2-min potential maps each, from 14:14 to 14:30 UT. In each panel positive (negative) potential contours are drawn by solid (dashed) curves and represent also flow streamlines. Velocity vectors obtained through the map potential technique are drawn as pointers at the locations where actual SuperDARN measurements are available. The strength of the vectors is colour coded according to the scale on the left of each panel. The IMF observations taken as ref-erence are those of IMP-8, delayed by 3 min, that we have evaluated in Sect. 2.2 to be the time necessary for the shock effects to start in the ionosphere. The inset in the top right of
each panel shows the orientation of such an IMF in the Y Z GSM plane. The positions of the high-latitude magnetome-ters mentioned in the previous section are also displayed in all panels.
– Fig. 6, panel (a): 14:14→14:16 UT. Before the shock
arrival the IMF Bz is close to zero and only slightly positive, while By<0, as shown by the top right inset. As one would expect in this situation, the high-latitude ionospheric convection as observed by SuperDARN is rather weak and consists of an asymmetric two-cell pat-tern (which we mark by α and β in this panel) confined above 70◦MLAT. The dawn cell extends slightly across the noon MLT meridian so that the convection velocity is directed from dawn to dusk around noon; on the other hand, the dusk cell exhibits a sort of tongue extending towards dawn at lower latitudes. This situation persisted for several 2 min scans before and is well represented by the scan displayed in this panel.
– Fig. 6, panel (b): 14:16→14:18 UT. This panel shows
the convection immediately after the passage of the shock front which was accompanied by a large increase of the absolute value of IMF By<0 (see again the top right inset). The two-cell pattern has clearly evolved to-wards a more complicated one. Actually, the convection
pattern has not changed noticeably on the dusk side (see the β0cell), while, on the contrary, on the morning side very clear sunward fluxes appear above 75◦MLAT between 06:00 and 10:30 MLT, which the map poten-tial software interprets as separating a counterclockwise cell extending along the noon MLT meridian (marked with a γ0) from a small clockwise cell with focus at 07:30 MLT and 74◦MLAT. The reconstruction of such sunward fluxes is based on data from three radars (Ka-puskasing, Goose Bay and Stokkseyri), whose fields of view overlap over the area of interest.
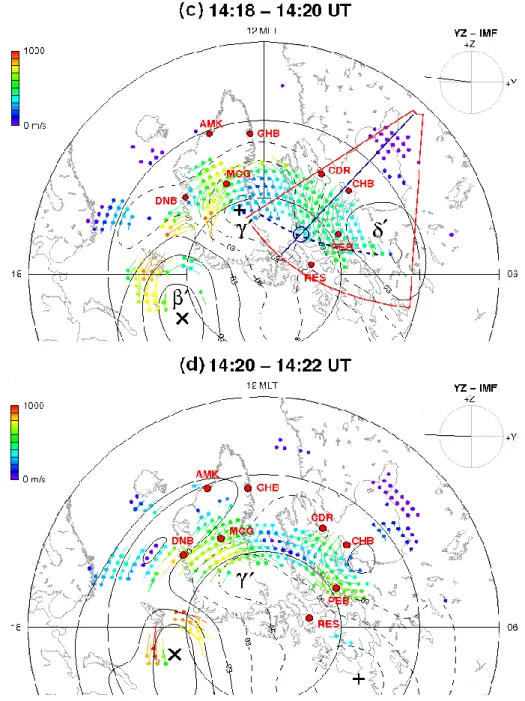
– Fig. 6, panel (c): 14:18→14:20 UT. The sunward fluxes
in the morning persist. A reverse (counterclockwise) convection cell around noon is now completely formed (γ0), and the map potential software again suggests the existence of another reverse cell in the morning (δ0).
– Fig. 6, panel (d): 14:20→14:22 UT. The γ0-cell can be still recognised, but it extends now more duskward, and an increase of convection fluxes from noon to dusk is reported above central Greenland. In the morning the convection has suffered strong variations with respect to the previous scan: between 10:00 MLT and noon and around 77◦–78◦MLAT westward and equatorward fluxes emerge, which resemble the northernmost part of a counterclockwise vortex, while between 08:00 and 10:00 MLT, eastward and equatorward fluxes survive, perhaps the remainings of the δ0-cell shown in panels (b) and (c).
– Fig. 6, panel (e): 14:22→14:24 UT. The reverse cell in
the polar cap has disappeared, and a clockwise con-vection cell is being restored in the afternoon. In the morning, westward fluxes are still present between 10:00 MLT and noon, while a reconfiguration seems to occur between 06:00 and 10:00 MLT, where a counter-clockwise convection cell is developing. These changes occur at a time when the time shifted IMP-8 IMF Bzhas just turned negative.
– Fig. 6, panel (f): 14:28→14:30 UT. After some
min-utes during which the high-latitude ionosphere adjusts to the modified IMF conditions (14:24→14:26 and 14:26→14:28 UT scans, not shown), the final config-uration of the convection is given by a two-cell pattern, with the dusk side cell protruding towards the morning, as expected for the given IMF orientation.
3 Discussion
3.1 Shock front orientation and time delays
First of all, we discuss the timing of the arrival at the iono-sphere of the first effects of the SI. As we have shown in
Sect. 2.2, the equatorial ground magnetograms (Fig. 3) dis-play an increase of the H -component starting at 14:15:20 UT, while in the magnetosphere a similar increase is observed in the Bz GSM component measured by GEOTAIL. These are the effects of the interplanetary shock hitting the magne-topause: the compression launches a fast magnetosonic wave which propagates in the equatorial magnetosphere and even-tually causes an increase of the North-South component of the ground geomagnetic field. The field rise time is about 4–5 min at all stations, which is very close to the values ob-served for shocks nearly perpendicular to the X GSM direc-tion (e.g. Wang et al., 2006). However, as we have noted in Sect. 2.2, the compression of H is not homogeneous, be-ing the field increase stronger in the mornbe-ing sector at Huan-cayo station at ∼09:30 MLT. This fact suggests that the shock first stroke the magnetopause at the morning side, in agree-ment with the considerations made in Sect. 2.1 regarding the shock propagation from WIND to IMP-8. On this line, a possible orientation of the shock front compatible with the observed delay of 3 min between the IMP-8 SI detection and the first effects at the equatorial and high-latitude ionosphere (see Sect. 2.2) was drawn as a red line through the IMP-8 po-sition in Fig. 2. Unfortunately a quantitative estimate of the shock front orientation and of the shock speed close to 1 AU is not possible because of the lack of IMP-8 plasma data at that time. However, we could make a qualitative estimate of that orientation by using IMF and plasma WIND data: by applying the Coplanarity Theorem (e.g. Schwartz, 1998) we obtained ˆn' (−0.88, 0.45, −0.2), which forms an angle ϕ'208◦with the X axis in the GSM XY plane. Such a tilt agrees with the shock hitting first the magnetopause morning side, although it does not fully match the shock orientation drawn in Fig. 2.
3.2 Araki-type and TCV-like effects
On the basis of a comprehensive study of high-latitude mag-netometer signatures, Araki (1994) inferred that, during a symmetric magnetospheric compression (i.e. a pressure dis-continuity whose normal is aligned with the Sun-Earth di-rection), two current systems are established at high lati-tudes: first, a pair of FACs comes with the magnetosonic front motion, one directed downward into the auroral zones in the afternoon, and the other directed upward out from the ionosphere in the morning; the closure currents in the high-latitude ionosphere form vortical structures, clockwise in the afternoon, counterclockwise in the morning; a magnetometer located northward of the centre of a clockwise (counterclock-wise) current vortex will experience an increase (decrease) of the North-South component, an eastward (westward) Hall current being established in the ionosphere. The opposite signature will be observed by a station located southward of the vortex centre. This current system is called Prelimi-nary Impulse (PI). When the shock front is passing along the magnetopause flanks, the compressed magnetosphere tends
Fig. 5. High latitude magnetograms from the DMI and MAGIC Greenland chains (afternoon MLT), on 6 January 1998 between 13:45 and 14:45 UT. On the left side the North-South component (H ) is shown, while on the right side one can see the East-West component (E). The
stations are displayed in decreasing order of magnetic latitude from the northernmost, on top (MCG – MAGIC-1 GISP , ∼76.4◦MLAT), to
the southernmost, on bottom (AMK – Ammassalik, ∼69.3◦MLAT).
towards a new equilibrium, with the increase of the dawn-dusk electric field; this causes an inversion of the FACs sys-tem, that now appears as a pair of filamentary currents enter-ing the auroral zones in the mornenter-ing and flowenter-ing out in the afternoon; in such way, all vortices and magnetometer signa-tures are reversed (Main Impulse, MI). In summary, the re-sulting magnetic signatures at high latitudes consist of bipo-lar PI/MI structures with the PI having a steeper slope and a shorter duration than the MI and with opposite sign in the dawn and dusk sectors.
For the event under study, the proposed orientation of the shock front could result in an asymmetry of the Araki vortex systems with respect to the 12:00 MLT meridian, possibly to such an extent that both systems develop in the morning side. To this regard, we have shown in Sect. 2.2 that the CDR, CHB, GHB and AMK magnetograms do show features of the PI/MI kind (see Figs. 4 and 5), which clearly appear to be related to the SI, but display the same polarities both in the morning sector (CDR and CHB) and in the afternoon sector (GHB and AMK), i.e. a decrease followed by an increase of the North-South component. The available data do not al-low to determine unambiguously the topology of the FAC system which is responsible for such observations. How-ever, they can be reconciled with the Araki model by assum-ing that CDR and CHB, which are located at '75◦MLAT, observe the northern part of a current vortex which starts
counterclockwise and turns into clockwise, while AMK and GHB, which are located slightly above 70◦MLAT, observe the southern part of a current system which starts clockwise and turns into counterclockwise. If that is so, the AMK – GHB vortices are located in the early afternoon, while the CDR – CHB vortices are located around 09:00 MLT. This asymmetry with respect with the 12:00 MLT meridian to some extent qualitatively agrees with the probable orienta-tion of the shock front.
As we do not have other magnetometer data to further sup-port this interpretation, we can try to make use of the Super-DARN observations, which provide convection velocities in the F region (while from the magnetometers we can recon-struct the orientation of E region currents). For this event, the SuperDARN coverage is satisfactory only above 75◦MLAT and, moreover, the time resolution of the network (2 min) is too low to identify the details of the evolution of the PI vor-tices. However, we notice from Fig. 6d and e that the north-ernmost part of a counterclockwise convection vortex can be seen in the morning, between 76◦and 78◦MLAT, and 09:00 and 11:00 MLT, slightly northward of CDR. A comparison with Fig. 4 can be made: between 14:20 and 14:24 UT, i.e. the interval encompassing the two scans of Fig. 6d and e, CDR and CHB are observing a peak of the X component; these are the final moments of life of the MI current system in the morning, when a clockwise current vortex reaches its
Fig. 6. Northern Hemisphere SuperDARN convection maps for 6 January 1998, between 14:14 and 14:20 UT. Each map corresponds to a 2 min complete SuperDARN scan. Convection velocities follow the color scale shown on the top left. On the top right of each panel, an inset displays the IMF orientation in the Y Z GSM plane, averaged over the scan time. The locations of magnetometers whose data have been described in Sect. 2.2 are also shown.
maximum intensity and then begins to fade. As SuperDARN measures the E×B plasma convection velocity, a counter-clockwise convection vortex corresponds to a counter-clockwise cur-rent vortex, so that magnetometers and radars observations seem to agree. In the afternoon, the high-latitude convec-tion measurements made by SuperDARN fall rather far in MLAT from the AMK and GHB stations by at least 5◦ to allow a comparison similar to the one we just made for the morning side. However, between 14:18 and 14:22 UT,
ve-locities pointing towards dusk along the local MLAT paral-lel around 75◦MLAT between 12:00 and 14:00 MLT are ob-served which do not contradict the existence of a clockwise Araki MI vortex at lower MLATs.
To complete the discussion of the effects induced by the solar wind dynamic pressure in the magnetogram records, we recall that in the solar wind, after the main pressure in-crease, at least three minor pressure variations occurred (see Fig. 1). As Fig. 4 shows and as we described in Sect. 2.2,
Fig. 6. Continued. Northern Hemisphere SuperDARN convection maps for 6 January 1998, between 14:18 and 14:22 UT. In panel (c), the field of view of Kapuskasing is also shown: the thick blue line evidence the direction of beam 11, the blue circle represents the region where the beam is supposed to cross the merging line footprint (see text), and the blue dotted curve represents a tentative merging line footprint. a series of magnetic transients is observed in the morning
around 75◦MLAT starting from 14:24 UT, up to 14:40 UT, whose features should make them fall into the class of TCVs (Zesta et al., 2002): a train of vortices is moving tailward with a speed of about 7–8 km/s. We suggest that the TCV-like features observed in the ionosphere correlate to the minor dynamic pressure variations which follow the SI. As regards the SuperDARN data, we do not observe any clear signature which can be related to such transients. This is probably due to two concurrent causes: the fact that their evolution occurs on a time scale comparable to the time resolution of a
Super-DARN scan, and the fact that their strongest effects probably develop at the southernmost edge of the radar coverage or even below.
3.3 Enhanced lobe reconnection at the SI
As we saw in Sect. 2.3 the SuperDARN convection maps show that the Northern Hemisphere convection patterns dis-played a clear evolution in relation with the interacion of the SI with the magnetosphere. The description which we made of this evolution suggests that a prominent role is played by
Fig. 6. Continued. Northern Hemisphere SuperDARN convection maps for 6 January 1998, between 14:22 and 14:30 UT.
the IMF orientation. Before we discuss more closely such an evolution and try to assess the possible complementary role of the solar wind dynamic pressure change, it is useful to briefly recall the expected configuration of the dayside con-vection when the IMF is By-dominated.
Figure 7 shows a scheme of the ionospheric patterns when By<0 (adapted from Sandholt et al., 1998). Figure 7a illus-trates the expected convection pattern for Bz∼0 and By<0: the two thick dashed lines show the projections of two recon-nection lines, tailward and sunward of the Cusp respectively, which result in two cells, marked with α and β. Figure 7b refers to a configuration where Bz>0: two stirring cells (γ0
and δ0) are formed due to an X-line tailward of the Cusp, resulting in a sunward flow from the polar cap, while two viscous cells (α0and β0, clockwise at dusk and counterclock-wise at dawn) convect field lines from the nightside at lower latitudes. When Bzbecomes negative, the expected convec-tion pattern is the one shown in Fig. 7c: the X-line at the magnetopause forms at lower latitude, displaced along the dawn flank because of the negative By, and two asymmet-ric convection cells are expected to form in the high-latitude ionosphere.
Turning now to the real convection maps which we de-scribed in Sect. 2.3, we recall that both at the beginning and
the dusk side and the paucity of data does not allow to un-ambiguously determine the lobe merging line. However, the patterns of Figs. 6a and f are clearly different: in the first case the convection is rather weak with a cross polar cap po-tential of 36 kV; in the second case the convection is much stronger and the two cells are neatly formed, with a domi-nating dusk cell and an estimated cross polar cap potential of 60 kV. Therefore, it is clear that the Fig. 6a pattern matches the Bz∼0, By<0 IMF orientation and that through the event the convection evolves to the Fig. 6f pattern which closely resembles the Fig. 7c scheme, as expected from the new IMF orientation.
This is not unexpected. Conversely, the way in which this evolution occurs is to some extent surprising. In fact, the evo-lution of the IMF orientation as shown in Fig. 1 suggests that the IMF By<0 component should dominate reconnection at the magnetopause throughout the event. For a steadily dom-inant By one would not expect the Fig. 6a pattern to vary much, exception made for a probable strengthening of con-vection induced by a more efficient reconnection process on the dawn side of the low latitude magnetopause. A different scenario emerges instead, as the convection maps in Fig. 6b– c, and d show: an intense sunward convection is activated in the morning, suggesting the emergence of a three-cell pattern (the new cells are labelled β0, γ0and δ0 in Fig. 6b–c). This pattern recalls the scheme sketched in Fig. 7b, which refers to a configuration where the contribution of Bz>0 is more important. This configuration shows up at its best in Fig. 6c, though for the α0cell no direct observation is available. This pattern is still present in Fig. 6d, when at 14:20 UT Bzturns negative and the convection pattern starts to evolve towards the Fig. 7c scheme, which is fully established several minutes later (Fig. 6f).
Also the MACCS magnetometers in the morning at very high latitudes (RES and PEB, Fig. 4), show evidence of the sunward convection seen in the SuperDARN maps: the Y (East-West) component observes a decrease starting around 14:16 UT, reaches a minimum around 14:18, then rises again attaining a level higher than before the SI arrival (Fig. 4, right side); this is the effect of the increase of the Hall current from South to North, which is associated with the activation of the sunward convection fluxes. Furthermore, as little activity oc-curs in the East-West direction, the X component does not register strong variations (Fig. 4, left side). On the other hand, in Northern Greenland, DNB and MCG stations ob-serve a bay of the H -component which can be interpreted as the activation of a westward Hall current, or an eastward
con-Fig. 7. High-latitude ionospheric convection pattern scheme ex-pected when IMF By<0. From top to bottom the cases Bz∼0 (a),
Bz>0 (b), Bz<0 (c) are displayed. Adapted from Sandholt et al. (1998).
vection flux, that is actually observed in that area (postnoon side of the γ0cell).
At this point it is worth recalling that the SuperDARN spectral width is a useful tool for distinguishing ionospheric regions where open or closed field lines map, especially in the cusp region and in the nightside. In fact, a number of studies has shown that, for southward IMF Bz, a sharp boundary can be traced between low and high spectral width values, which very often corresponds to the OCB and, there-fore, to the dayside merging line footprint in the ionosphere (e.g. Milan et al., 1999; Moen et al., 2001; Chisham et al., 2008, and references therein). On many occasions, the equa-torward edge of the high spectral width region also marks the equatorward edge of the observed backscatter. Moreover Chisham et al. (2004) have shown that, when Bz is north-ward, the poleward edge of the radar backscatter is often well correlated with the lobe merging line footprint in the
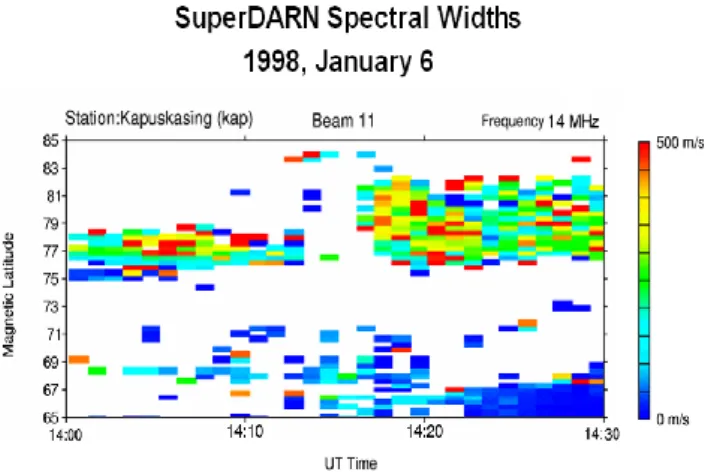
Fig. 8. SuperDARN spectral widths measured as a function of magnetic latitude between 14:00 and 14:30 UT for beam 11 of Ka-puskasing radar.
ionosphere, while the OCB cannot be univocally identified with the low latitude edge of the radar backscatter. Fig-ure 8 shows, as a function of magnetic latitude and UT, the spectral width measured by the Kapuskasing radar along its beam 11, which results to be quasi-meridionally oriented. The Kapuskasing field of view is delimited by red lines in Fig. 6c, and the direction of the selected beam is evidenced with a blue solid line. From Fig. 8 we can see that a latitudi-nal gap in the backscatter occurs between 71◦and 75◦MLAT, so delimiting an equatorward edge for the Cusp backscatter at about 75◦–76◦MLAT. However, such limit cannot be iden-tified as the OCB as Bzis northward until 14:22 UT. Actually, Figs. 6b–d show a sunward flow across such edge; if that edge were identified with the OCB, this would imply a con-current movement of the OCB itself, to be explained through dual lobe reconnection. However, this is very unlikely to oc-cur in this case, as |By| Bz>0. Thus, it is reasonable to as-sume that the OCB be located somewhat more equatorward, i.e. along the dashed equipotential contour drawn in Fig. 6c at 72◦–73◦MLAT between 10:00 and 12:00 MLT. As for the poleward edge of the backscatter, one can notice a steep lat-itudinal transition: up to 14:16 UT the poleward edge was at ∼79◦MLAT, while from 14:22 UT, after a gap in the echoes, that boundary moves to ∼83◦MLAT. From these observa-tions two main conclusions can be drawn: 1) the sunward fluxes described in Fig. 6b–c lie on open field lines; 2) re-connection tailward of the cusp is possibly ongoing, with the merging line footprint located between 82◦ and 83◦MLAT along the beam 11 direction. In Fig. 6c a blue circle has been overplotted along the beam 11 direction to indicate the re-gion where the merging line footprint is supposed to cross the beam; a tentative merging line footprint can be traced from the centre of the reverse cell γ0, through the circle, towards the reverse cell δ0, as indicated by the dashed blue curve in Fig. 6c.
To conclude this section, it is necessary to further com-ment on the possible cause of the enhanced lobe reconnec-tion observed by SuperDARN between 14:16 and 14:22 UT. Therefore, we look more closely at the IMP-8 IMF change at the SI. Overall, although all three IMF components change, the rotation across the SI results to be <3◦. In particular, we notice that a small positive excursion of Bz, to a max-imum value of 2 nT, is observed immediately after the SI; however, the small Bzincrease is accompanied by a large in-crease of the absolute value of By, so that, both before and after the IMF rotation, |<Bz>|/|<By>|'0.1, where the av-erages are calculated over 4 min. In the second place, we ex-amine the Bx component, because some authors (e.g. Cow-ley, 1983; Crooker and Rich, 1993; Lockwood and Moen, 1999) suggested in the past that a negative Bxcan favor re-connection tailward of the northern cusp for Bz'0. For the event under study, the change of Bx across the SI is of the same order as that of Bz: before the SI, Bx'−0.6 nT, while immediately after it Bx'−2 nT, yielding a roughly constant ratio |<Bx>|/|<By>|'0.1. From these considerations we would not expect the conditions for reconnection at the mag-netopause to change dramatically as a consequence of the IMF change associated with the SI.
To further evaluate this issue, we applied the Cooling et al. (2001) model of magnetopause reconnection using as inputs time shifted IMP-8 IMF data and WIND plasma data, re-spectively, before and after the SI. The Cooling et al. (2001) model allows to evaluate the probability of component merg-ing as a function of position on the magnetopause and al-lows the reconstruction of an X-line on the magnetopause starting from a location where reconnection is considered to be feasable. For that purpose Cooling et al. (2001) make use of a model magnetopause and propagate the IMF and plasma data through the magnetosheath by using the Spre-iter et al. (1966) gas-dynamic model. As such, the use of the Cooling model for this event somewhat compensates the lack of local magnetic and plasma measurements in the mag-netosheath close to the magnetopause. We made runs of the Cooling model for the pre- and post-SI conditions and pro-jected the obtained X-lines to the ionosphere by using the Tsyganenko 96 model (Tsyganenko, 1995). We found that, as a consequence of the increase of IMF intensity across the SI, the Cooling model predicts an increased probability of reconnection, which qualitatively agrees with the increased convection observed by SuperDARN after the SI; however, as regards the topology of reconnection, the model predicts that an X-line sunward and eastward of the northern cusp can form, due to the large Bynegative component, while we found no evidence for the formation of a merging line north-ward of the cusp like the one shown in Fig. 6c.
On the basis of the considerations we have just made, we suggest that the IMF change at the SI cannot explain by itself the sunward convection fluxes observed over the polar cap between 14:16 and 14:22 UT. As we are dealing with an SI, at this point it is natural to recall that several authors have
variations are often directly related to variations of the day-side reconnection rate. Finally, we recall that Laitinen et al. (2007) suggest that higher values of solar wind dynamic pres-sure yield increased reconnection rates at the magnetopause for Bz<0 and that the dominant parameter to account for such increased rates is solar wind velocity rather than den-sity.
We therefore propose that for the event under study the solar wind dynamic pressure associated with the SI plays a role in favouring reconnection at the magnetopause. To this regard, we notice that, in this case, the density pro-vides a large contribtion to the pressure increase as, at the SI, 1n'12 pp/cm3and 1V '80 km/s. Moreover, we remark a new result, consisting in the fact that the pressure increase triggers a clear lobe reconnection tailward of the northern Cusp and that a typical Bz>0 configuration is set up although By<0 dominates (Fig. 7b). We suggest that the setting up of lobe reconnection under the influence of increased solar wind dynamic pressure might be linked to the indentation of the magnetosheath flow in the cups region. To this regard, one could speculate that the orientation of the solar wind shock in this case (Sect. 3.1) might also play a role in producing an asymmetric deformation of the magnetopause surface. How-ever, such considerations cannot be supported by detailed ev-idence in this case and further work is needed in identifying similar events and developing adequate modelling.
4 Summary and conclusions
We have used SuperDARN convection maps, spacecraft data and ground magnetometer data to study the effect of a Sud-den Impulse (SI) of solar wind dynamic pressure on the magnetosphere-ionosphere system. We have found that the shock front associated with the SI was tilted towards the dawn flank of the magnetopause, and occurred during an IMF By-dominated period, with Bz>0. Regarding the general ef-fects of the SI, we have shown that current systems are es-tablished in the magnetosphere and in the high-latitude iono-sphere that can be clearly related to a “pure" SI effect. In fact, satellites in the equatorial plane of the magnetosphere and equatorial ground-based magnetometers report an increase of the geomagnetic field which is caused by an increase of the Chapman-Ferraro current from dawn to dusk: this is the effect of the magnetospheric compression and of the MHD wave started from the first impact point of the SI on the mag-netopause. On the other hand, ground–based
magnetome-2. these fluxes last for 5–6 min, until the rotation of IMF Bzto negative values leads to a global reconfiguration of the high-latitude convection to a typical two-cell By<0 pattern;
3. these fluxes have a signature typical for Bz>0 domi-nated lobe reconnection, while |By| Bz, and seem to be triggered by the solar wind dynamic pressure in-crease.
Acknowledgements. The authors would like to thank: R. Lepping
and K. Ogilvie for the use of WIND magnetic field and solar wind experiments data, respectively; N. Ness for the use of ACE Mag-netic Field Instrument data; A. Szabo and R. Lepping for the use of IMP-8 Magnetic Field Instrument data; S. Kokubun for the use of GEOTAIL Magnetic Field Instrument data; the CDAWeb team; the World Data Center for Geomagnetism, Kyoto, Japan, for providing low-latitude magnetograms; M. Engebretson and W. J. Hughes for the use of MACCS magnetometers data; J. Watermann for the use of DMI Greenland magnetometers data; R. Clauer for the use of MAGIC magnetometers data. We would also like to thank all of the Principal Investigators of the SuperDARN radars.
Special thanks go to Jean-Claude Cerisier at CETP, France, and to Jean-Pièrre St. Maurice, at the University of Saskatchewan, Canada, for the useful and stimulating discussions at the early stages of that work. This work is supported by the Italian National Program for Antarctic Research (PNRA), under projects 2004/7.1 and 2004/7.2. Topical Editor I. A. Daglis thanks two anonymous referees for their help in evaluating this paper.
References
Araki, T.: A physical model of the geomagnetic sudden commence-ment, in: Solar Wind Sources of Magnetospheric Ultra-Low-Frequency Waves, Geophys. Monogr. Ser., 81, 183–200, 1994. Baker, K. B., Dudeney, J. R., Greenwald, R. A., Pinnock, M.,
Newell, P. T., Rodger, A. S., Mattin, N., and Meng, C.-I.: HF radar signatures of the cusp and low-latitude boundary layer, J. Geophys. Res., 100, 7671–7695, 1995.
Bosqued, J. M., Escoubet, C. P., Frey, H. U., Dunlop, M., Berchem, J., Marchaudon, A., Cerisier, J. C., Fazakerley, A., Budnik, E., Lavraud, B., Rème, H., Laakso, H., and Balogh, A.: Multipoint observations of transient reconnection signatures in the cusp pre-cipitation: A Cluster-IMAGE detailed case study, J. Geophys. Res., 110, A03219, doi:10.1029/2004JA010621, 2005. Boudouridis, A., Zesta, E., Lyons, L. R., Anderson, P. C., and
Lum-merzheim, D.: Effect of solar wind pressure pulses on the size and strength of the auroral oval, J. Geophys. Res., 108(A4), 8012, doi:10.1029/2002JA009373, 2003.
Boudouridis, A., Lyons, L. R., Zesta, E., and Ruohoniemi, J. M.: Dayside reconnection enhancement resulting from a solar wind dynamic pressure increase, J. Geophys. Res., 112, A06201, doi:10.1029/2006JA012141, 2007.
Burke, W. J., Kelley, M. C., Sagalyn, R. C., Smiddy, M., and Lai, S. T.: Polar cap electric field structures with a northward interplan-etary magnetic field, Geophys. Res. Lett., 6, 21–24, 1979. Chisham, G., Freeman, M. P., Coleman, I. J., Pinnock, M., Hairston,
M. R., Lester, M., and Sofko, G.: Measuring the dayside recon-nection rate during an interval of due northward interplanetary magnetic field, Ann. Geophys., 22, 4243–4258, 2004,
http://www.ann-geophys.net/22/4243/2004/.
Chisham, G., Lester, M., Milan, S. E., Freeman, M. P., Bristow, W. A., Grocott, A., McWilliams, K. A., Ruohoniemi, J. M., Yeoman, T. K., Dyson, P. L., Greenwald, R. A., Kikuchi, T., Pinnock, M., Rash, J. P. S., Sato, N., Sofko, G. J., Villain, J.-P., and Walker, A. D. M.: A decade of the Super Dual Auroral Radar Network (Su-perDARN): scientific achievements, new techniques and future directions, Surv. Geophys., 28, 33–109, 2007.
Chisham, G., Freeman, M. P., Abel, G. A., Lam, M. M., Pinnock, M., Coleman, I. J., Milan, S. E., Lester, M., Bristow, W. A., Greenwald, R. A., Sofko, G. J., and Villain, J.-P.: Remote sens-ing of the spatial and temporal structure of magnetopause and magnetotail reconnection from the ionosphere, Rev. Geophys., 46, RG1004, doi:10.1029/2007RG000223, 2008.
Coco, I., Amata, E., Marcucci, M. F., De Laurentis, M., Villain, J.-P., Hanuise, C., and Candidi, M.: Effects on SuperDARN HF radar echoes of sudden impulses of solar wind dynamic pressure, Ann. Geophys., 23, 1771–1783, 2005,
http://www.ann-geophys.net/23/1771/2005/.
Cooling, B. M. A., Owen, C. J., and Schwartz, S. J.: Role of the magnetosheath flow in determining the motion of open flux tubes, J. Geophys. Res., 106, 18 763–18 776, 2001.
Cowley, S. W. H.: Interpretation of observed relations between solar-wind characteristics and effects at ionospheric altitudes, in: High Latitude Space Plasma Physics, edited by: Hultqvist, B. and Hagfors, T., 225–249, Plenum, New York, 1983.
Crooker, N. U.: Dayside Merging and Cusp Geometry, J. Geophys. Res., 84, 951–959, 1979.
Crooker, N. U. and Rich, F. J.: Lobe cell convection as a summer phenomenon, J. Geophys. Res., 98, 13 403–13 407, 1993. Dungey, J. W.: Interplanetary magnetic field and the auroral zones,
Phys. Rev. Lett., 6, 47–50, 1961.
Erlandson, R. E., Sibeck, D. G., Lopez, R. E., Zanetti, L. J., and Potemra, T. A.: Observations of solar wind pressure initiated fast mode waves at geostationary orbit and in the polar cap, J. Atmos. Terr. Phys., 53, 231–239, 1991.
Francia, P., Lepidi, S., Villante, U., Di Giuseppe, P., and Lazarus, A. J.: Geomagnetic response at low latitude to continuous solar wind pressure variations during northward interplanetary mag-netic field, J. Geophys. Res., 104, 19 923–19 930, 1999. Glassmeier, K.-H., Hönisch, M., and Untiedt, J.: Ground-Based and
Satellite Observations of Traveling Convection Twin Vortices, J. Geophys. Res., 94, 2520–2528, 1989.
Gosling, J. T., Thomsen, M. F., Bame, S. J., Elphic, R. C., and Rus-sell, C. T.: Plasma flow reversals at the dayside magnetopause and the origin of asymmetric polar cap convection, J. Geophys. Res., 95, 8073–8084, 1990.
Greenwald, R. A., Baker, K. B., Dudeney, J. R., Pinnock, M., Jones,
T. B., Thomas, E. C., Villain, J.-P., Cerisier, J.-C., Senior, C., Hanuise, C., Hunsucker, R. D., Sofko, G., Koehler, J., Nielsen, E., Pellinen, R., Walker, A. D. M., Sato, N., and Yamagishi, H.: DARN/SUPERDARN: A Global View of the Dynamics of High-Latitude Convection, Space Sci. Rev., 71, 761–796, 1995. Hanuise, C., Greenwald, R. A., and Baker, K. B.: Drift motions
of very high latitude F region irregularities: Azimuthal Doppler analysis, J. Geophys. Res., 90, 9717–9725, 1985.
Hanuise, C., Villain, J.-P., Gresillon, D., Cabrit, B., Greenwald, R. A., and Baker, K. B.: Interpretation of HF radar ionospheric Doppler spectra by collective wave scattering theory, Ann. Geo-phys., 11, 29–39, 1993,
http://www.ann-geophys.net/11/29/1993/.
Huang, C.-S., Andre, D. A., Sofko, G. J., and Koustov, A. V.: Super Dual Auroral Radar Network observations of ionospheric multi-cell convection during northward interplanetary magnetic field, J. Geophys. Res., 105, 7419–7428, 2000.
Kivelson, M. G. and Southwood, D. J.: Ionospheric Traveling Vor-tex Generation by Solar Wind Buffeting on the Magnetopause, J. Geophys. Res., 96, 1661–1667, 1991.
Kozlovsky, A., Safargaleev, V., Østgaard, N., Turunen, T., Koustov, A., Jussila, J., and Roldugin, A.: On the motion of dayside au-roras caused by a solar wind pressure pulse, Ann. Geophys., 23, 509–521, 2005, http://www.ann-geophys.net/23/509/2005/. Laitinen, T. V., Palmroth, M., Pulkkinen, T. I., Janhunen, P.,
and Koskinen, H. E. J.: Continuous reconnection line and
pressure-dependent energy conversion on the magnetopause in a global MHD model, J. Geophys. Res., 112, A11201, doi:10.1029/2007JA012352, 2007.
Lockwood, M. and Moen, J.: Reconfiguration and closure of lobe flux by reconnection during northward IMF: Evidence for signa-tures in cusp/cleft auroral emissions, Ann. Geophys., 17, 996– 1011, 1999, http://www.ann-geophys.net/17/996/1999/. Milan, S. E., Cowley, S. W. H., Moen, J., Sandholt, P. E., and Owen,
C. J.: Meridian scanning photometer, coherent HF radar, and magnetometer observations of the cusp: a case study, Ann. Geo-phys., 17, 159–172, 1999,
http://www.ann-geophys.net/17/159/1999/.
Moen, J., Carlson, H. C., Milan, S. E., Shumilov, N., Lybekk, B., Sandholt, P. E., and Lester, M.: On the collocation between dayside auroral activity and coherent HF backscatter, Ann. Geo-phys., 18, 1531–1549, 2001,
http://www.ann-geophys.net/18/1531/2001/.
Motoba, T., Kikuchi, T., Okuzawa, T., and Yumoto, K.: Dynami-cal response of the magnetosphere-ionosphere system to a solar wind dynamic pressure oscillation, J. Geophys. Res., 108(A5), 1206, doi:10.1029/2002JA009696, 2003.
Newell, P. T. and Meng, C.-I.: Ionospheric projection of magneto-spheric regions under low and high solar wind pressure condi-tions, J. Geophys. Res., 99, 273–286, 1994.
Prikryl, P., Greenwald, R. A., Sofko, G. J., Villain, J.-P., Ziesolleck, C. W. S., and Friis-Christensen, E.: Solar-wind-driven pulsed magnetic reconnection at the dayside magnetopause, Pc5 com-pressional oscillations, and field line resonances, J. Geophys. Res., 103, 17 307–17 322, 1998.
Provan, G., Lester, M., Cowley, S. W. H., Milan, S. E., Hubert, B., and Khan, H.: Modulation of dayside reconnection during northward interplanetary magnetic field, J. Geophys. Res., 110, A10211, doi:10.1029/2004JA010980, 2005.
servations, J. Geophys. Res., 101, 21 743–21 763, 1996.
Ruohoniemi, J. M. and Greenwald, R. A.: Dependencies
of high-latitude plasma convection: Consideration of
inter-planetary magnetic field, seasonal, and universal time fac-tors in statistical patterns, J. Geophys. Res., 110, A09204, doi:10.1029/2004JA010815, 2005.
Russell, C. T. and Ginskey, M.: Sudden impulses at subauroral lat-itudes: Response for northward interplanetary magnetic field, J. Geophys. Res., 100, 23 695–23 702, 1995.
Sandholt, P. E., Farrugia, C. J., Moen, J., and Cowley, S. W. H.: Dayside auroral configuration: Response to southward and northward rotations of the interplanetary magnetic field, J. Geo-phys. Res., 103, 20 279–20 295, 1998.
Schwartz, S. J.: Shock and discontinuity normals, Mach num-bers, and related parameters, in: Analysis Methods for Multi-Spacecraft Data, edited by: Paschmann, G. and Daly, P. W., ISSI editions, Chap. 10, 1998.
Sibeck, D. G.: A Model for the Transient Magnetospheric Response to Sudden Solar Wind Dynamic Pressure Variations, J. Geophys. Res., 95, 3755–3771, 1990.
Sibeck, D. G., Trivedi, N. B., Zesta, E., Decker, R. B., Singer, H. J., Szabo, A., Tachihara, H., and Watermann, J.: Pressure-pulse interaction with the magnetosphere and the ionosphere, J. Geo-phys. Res., 108(A2), 1095, doi:10.1029/2002JA009675, 2003.
Tsyganenko, N. A.: Modeling the Earth’s magnetospheric magnetic field confined within a realistic magnetopause, J. Geophys. Res., 100, 5599–5612, 1995.
Villain, J.-P., Beghin, C., and Hanuise, C.: ARCAD3-SAFARI co-ordinated study of auroral and polar F-region ionospheric irregu-larities, Ann. Geophys., 4, 61–68, 1986,
http://www.ann-geophys.net/4/61/1986/.
Vontrat-Reberac, A., Cerisier, J.-C., Sato, N., and Lester, M.: Noon ionospheric signatures of a sudden commencement following a solar wind pressure pulse, Ann. Geophys., 20, 639–645, 2002, http://www.ann-geophys.net/20/639/2002/.
Wang, C., Li, C. X., Huang, Z. H., and Richardson, J. D.: Effect of interplanetary shock strengths and orientations on storm sud-den commencement rise time, Geophys. Res. Lett., 33, L14104, doi:10.1029/2006GL025966, 2006.
Wilken, B., Goertz, C. K., Baker, D. N., Higbie, P. R., and Fritz, T. A.: The SSC on July 29, 1977 and its Propagation Within the Magnetosphere, J. Geophys. Res., 87, 5901–5910, 1982. Zesta, E., Hughes, W. J., and Engebretson, M. J.: A statistical
study of traveling convection vortices using the Magnetometer Array for Cusp and Cleft Studies, J. Geophys. Res., 107, 1317, doi:10.1029/1999JA000386, 2002.
Zhou, X. and Tsurutani, B. T.: Rapid intensification and propaga-tion of the dayside aurora: Large scale interplanetary pressure pulses (fast shocks), Geophys. Res. Lett., 26, 1097–1100, 1999.