HAL Id: hal-00328023
https://hal.archives-ouvertes.fr/hal-00328023
Submitted on 4 Dec 2006HAL is a multi-disciplinary open access
archive for the deposit and dissemination of sci-entific research documents, whether they are pub-lished or not. The documents may come from teaching and research institutions in France or abroad, or from public or private research centers.
L’archive ouverte pluridisciplinaire HAL, est destinée au dépôt et à la diffusion de documents scientifiques de niveau recherche, publiés ou non, émanant des établissements d’enseignement et de recherche français ou étrangers, des laboratoires publics ou privés.
Isentropic advection and convective lifting of water
vapor in the UT – LS as observed over Brazil (22° S) in
February 2004 by in situ high-resolution measurements
of H2O, CH4, O3 and temperature
Georges Durry, Nathalie Huret, Alain Hauchecorne, Virginie Marecal,
Jean-Pierre Pommereau, R. L. Jones, G. Held, N. Larsen, Jean-Baptiste
Renard
To cite this version:
Georges Durry, Nathalie Huret, Alain Hauchecorne, Virginie Marecal, Jean-Pierre Pommereau, et al.. Isentropic advection and convective lifting of water vapor in the UT – LS as observed over Brazil (22° S) in February 2004 by in situ high-resolution measurements of H2O, CH4, O3 and temperature. Atmospheric Chemistry and Physics Discussions, European Geosciences Union, 2006, 6 (6), pp.12469-12501. �hal-00328023�
ACPD
6, 12469–12501, 2006 In situ measurements of H2O in the TTL during HIBISCUS G. Durry et al. Title Page Abstract Introduction Conclusions References Tables Figures ◭ ◮ ◭ ◮ Back CloseFull Screen / Esc
Printer-friendly Version Interactive Discussion
Atmos. Chem. Phys. Discuss., 6, 12469–12501, 2006 www.atmos-chem-phys-discuss.net/6/12469/2006/ © Author(s) 2006. This work is licensed
under a Creative Commons License.
Atmospheric Chemistry and Physics Discussions
Isentropic advection and convective
lifting of water vapor in the UT – LS as
observed over Brazil (22
◦
S) in February
2004 by in situ high-resolution
measurements of H
2
O, CH
4
, O
3
and
temperature
G. Durry1,2, N. Huret3, A. Hauchecorne1, V. Marecal3, J.-P. Pommereau1, R. L. Jones4, G. Held5, N. Larsen6, and J.-B. Renard3
1
Service d’A ´eronomie, CNRS and Institut Pierre Simon Laplace, Route des Gatines, Verri `ere le Buisson cedex, 91371, France
2
Groupe de Spectroscopie Mol ´eculaire et Atmosph ´erique, CNRS and Universit ´e de Reims, Moulin de la Housse, B.P. 1039, 51687 Reims Cedex, France
3
Laboratoire de Physique et Chimie de l’Environnement, CNRS and Universit ´e d’Orl ´eans, 3A Avenue de la Recherche Scientifique, 45071 Orl ´eans cedex 2, France
4
Center for Atmospheric Science, University Chemical Laboratory, University of Cambridge, Lensfield Road, Cambridge, CB2 1EW, UK
ACPD
6, 12469–12501, 2006 In situ measurements of H2O in the TTL during HIBISCUS G. Durry et al. Title Page Abstract Introduction Conclusions References Tables Figures ◭ ◮ ◭ ◮ Back CloseFull Screen / Esc
Printer-friendly Version Interactive Discussion
EGU
5
Instituto de Pesquisas Meteorologicas, Universidade Estadual Paulista, CX Postal, 281 17015 – 970 BAURU, S.P., Brasil
6
Danish Meteorological Institute, Lyngbyvej 100, 2100Kbh, Denmark
Received: 9 November 2006 – Accepted: 28 November 2006 – Published: 4 December 2006 Correspondence to: G. Durry ([email protected])
ACPD
6, 12469–12501, 2006 In situ measurements of H2O in the TTL during HIBISCUS G. Durry et al. Title Page Abstract Introduction Conclusions References Tables Figures ◭ ◮ ◭ ◮ Back CloseFull Screen / Esc
Printer-friendly Version Interactive Discussion
Abstract
The micro-SDLA balloonborne diode laser spectrometer was flown twice from Bauru (22◦S, Brazil) in February 2004 during HIBISCUS to yield in situ H2O measurements
in the Upper Troposphere (UT) and Lower Stratosphere (LS) and in particular in the Tropical Tropopause Layer (TTL). The overall TTL was found warmer (with a
subsat-5
urated cold point near –79◦C) and the LS moister compared to former measurements obtained in tropical oceanic conditions. The use of specific balloons with a slow de-scent, combined with the high-resolution of the laser sensor, allowed us to observe in situ in the UT, the TTL and the LS several thin layers correlated on H2O, CH4, O3,
temperature and PV. A component of these layers is associated with the isentropic
10
transport into the UT- LS of extratropical stratospheric air masses. Moreover, the ex-amination of temperature and tracer (CH4, O3) profiles gives insights on the potential
contribution of convective transport of H2O in the TTL.
1 Introduction
It is widely accepted that there is a subtropical dynamical barrier, which prevents
trans-15
port into the tropical tropopause, identified by strong gradients of potential vorticity (PV) and chemical species (Polvani et al., 1995; Holton et al., 1995; Hall and Waugh, 1997; Haynes and Shuckburgh, 2000). Nevertheless, the subtropical Rossby wave-breaking processes can cause the transport of tongues of extratropical air through this dynamical barrier deep into the tropics (Plumb, 1996 ; Horinouchi, 2000). The
obser-20
vation in the tropical upper troposphere of such intrusion events has previously been discussed in the literature. For instance, Scott et al. (2001) have investigated, over the southern tropical Atlantic, subtropical intrusions in the tropical upper troposphere and their impact on H2O and O3, by examining ozone from the Measurements of Ozone
by Airbus In-Service Aircraft (MOZAIC) program in conjunction with PV-advection and
25
ACPD
6, 12469–12501, 2006 In situ measurements of H2O in the TTL during HIBISCUS G. Durry et al. Title Page Abstract Introduction Conclusions References Tables Figures ◭ ◮ ◭ ◮ Back CloseFull Screen / Esc
Printer-friendly Version Interactive Discussion
EGU
breakings may have an impact on the distribution of tracers in the tropical upper tro-posphere and a significant contribution to the exchange of air between tropical and extratropical regions. The investigation of the vertical extension of such subtropical in-trusions was made by Waugh and Funatsu (2003) by using ozone from TOMS and 20-years of NCEP-NCAR PV-data over the northern tropical Pacific. They have suggested
5
that intrusions events could potentially affect the tropical tropopause layer (TTL) and the lower stratosphere, as well as the upper troposphere. In particular, they indicated that the impact on H2O in the TTL and the tropical lower stratosphere (LS) needed to be further investigated. Note that in the present study, UT will refer to the part of the upper troposphere located below the TTL. An other open issue is the effect of such
sub-10
tropical intrusions on deep convection (Kiladis and Weickmannn, 1992; Kiladis, 1998; Matthews and Kiladis, 1999). Indeed, the anomalous PV in the intruding tongue of ex-tratropical air could produce a region of ascent and of reduced static stability, initiating thereby convection. Kiladis (1998) suggested that the diabatic heating associated with convection may play a role in the weakening of the PV-anomaly. Hence the intrusion
15
would generate convection which could conversely cause its erosion and the mixing of tropical and extra-tropical air. Therefore, Waugh and Funatsu (2003) recommended in their study that further investigations on transport and on convection associated with intrusion events be combined.
The micro-SDLA balloonborne diode laser spectrometer was flown twice during the
20
HIBISCUS field campaign (Pommereau et al., 20061) to provide in situ high-resolution H2O measurements in the UT-LS. The data were recorded near Bauru (22.4◦S, 49◦W)
in Brazil during the wet season, in February 2004. In contrast to most previous studies on tropical H2O in the UT and TTL (Jensen et al., 2005; Tuck et al., 2004; V ¨omel et
al., 2002; Weinstock et al., 1995; Richard et al., 2006), the HIBISCUS measurements
25
were performed over a continental region instead of a maritime one. Continental re-gions and in particular South America are favorable to the development of very deep
1
Pommereau, J.-P., Garnier, A., Held, G., and the Hibiscus team: An overview of the HIBIS-CUS campaign, Atmos. Chem. Phys. Discuss., in preparation, 2006.
ACPD
6, 12469–12501, 2006 In situ measurements of H2O in the TTL during HIBISCUS G. Durry et al. Title Page Abstract Introduction Conclusions References Tables Figures ◭ ◮ ◭ ◮ Back CloseFull Screen / Esc
Printer-friendly Version Interactive Discussion
convective events as shown by Liu and Zipser (2005) from TRMM (Tropical Rainfall Measuring Mission) observations. The micro-SDLA was flown over a continental con-vective region located within or in the vicinity of the South Atlantic Convergence Zone (SACZ) in the summer. In the present paper, we examine these high-resolution H2O
measurements using temperature profiles and tracer data (CH4and O3), as well as PV
5
from a high-resolution PV-advection model. This is done with the purpose of identifying the respective signatures of isentropic and convective processes affecting H2O in the
UT-LS. In Huret et al. (2006)2we use a meso-scale modeling approach with a sufficient vertical resolution and based on local meteorology to further investigate the impact of convection on H2O in the TTL.
10
In Sect. 2, we describe the micro-SDLA instrument. In Sect. 3, we define the TTL extension for both flights and report the H2O, CH4and O3 data in the UT, TTL and
LS. Finally, we will discuss in Sect. 4 the data in the UT-LS by examining the tracer measurements and the PV-maps from the PV-advection model.
2 Instrumental
15
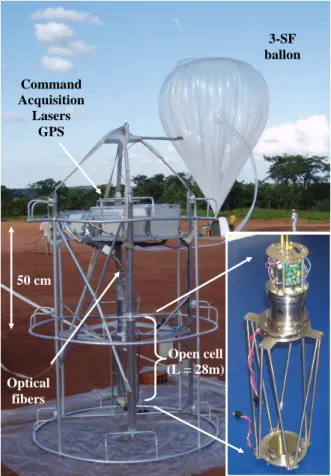
The micro-SDLA sensor is a balloon borne diode laser spectrometer devoted to the in situ monitoring of H2O, CH4 and CO2 in the UT-LS by infrared absorption spec-troscopy (Durry et al., 2004). Figure 1 is a picture of the sensor during the HIBIS-CUS campaign in Brazil in February 2004. With the micro-SDLA, three near-infrared telecommunication-type InGaAs laser diodes are connected by means of optical fibers
20
to a two-mirrors multipass optical cell operated open to the atmosphere that provides a 28 m absorption path length (Durry et al., 2002a). The laser beams are absorbed in situ by the ambient CH4, CO2and H2O molecules as it is reflected back and forth between
2
Huret, N., Durry G., Freitas S., et al.: In situ laser diode measurements of H2O during HIBISCUS: investigation of convective event impact on H2O distribution in the TTL by a meso-scale model, Atmos. Chem. Phys. Discuss., in preparation, 2006b.
ACPD
6, 12469–12501, 2006 In situ measurements of H2O in the TTL during HIBISCUS G. Durry et al. Title Page Abstract Introduction Conclusions References Tables Figures ◭ ◮ ◭ ◮ Back CloseFull Screen / Esc
Printer-friendly Version Interactive Discussion
EGU
the mirrors of the optical cell. In situ absorption spectra of CH4in the 1.65-micron re-gion, CO2 in the 1.60-micron and H2O in the 1.39-micron region are recorded at the
cell output using a differential detection technique (Durry et al., 2000). By combining the direct-differential detection with an adequate selection of the H2O rotation-vibration
transitions scanned over by the laser, the achieved dynamical range of the
measure-5
ments is of four orders of magnitude, which permits a continuous probing of H2O in both
the troposphere and the LS (Durry and Megie, 2000). The H2O used transitions and their associated spectroscopy are described in Durry et al. (2005). The Beer Lambert law is then applied to relate the absorption of laser energy to the molecular concen-tration. In practice, the molecular mixing ratio is retrieved from the absorption spectra
10
using a non-linear least-squares fit to the full molecular line shape in conjunction with onboard in situ atmospheric pressure and temperature measurements and by use of a molecular model (Durry and Megie, 1999). The achieved inaccuracy in the H2O and
CH4concentration measurements is of 5% in the UT-LS, altitude region, which is stud-ied in this paper, for an average measurement time of 160 ms (co-addition of twenty
15
8-ms laser scans). More details on the used balloon borne laser probing technique used for H2O and CH4, the concentration retrieval and the various sources of errors are given in Durry and Megie (1999) and Durry et al. (2002b).
The micro-SDLA sensor was flown twice from Bauru (22◦S, 49◦W). The objective was to probe in situ the UT-LS and in particular the TTL at high-resolution. Small open
20
stratospheric balloons inflated with 3000 m3of helium were used, which provided a float altitude near 21 km. The H2O data in the stratosphere and the tropopause were taken
during the descent of the instrument to prevent the contamination of the measurements by water vapor outgassing from the balloon envelope (Durry and Megie, 2000). As no valve was available with the small balloons, the slow descent in the TTL was achieved
25
using a transition from day to night (i.e., the balloon temperature decreases at sunset and the balloons starts a slow descent). The UT-LS was hence probed at a mean de-scent speed near 1.5 m s−1 during nighttime. The measurements in the troposphere were taken during the final descent after cut-down under parachutes. For the first flight,
ACPD
6, 12469–12501, 2006 In situ measurements of H2O in the TTL during HIBISCUS G. Durry et al. Title Page Abstract Introduction Conclusions References Tables Figures ◭ ◮ ◭ ◮ Back CloseFull Screen / Esc
Printer-friendly Version Interactive Discussion
additional H2O measurements were also taken during the ascent in the troposphere. The micro-SDLA was flown without telemetry the data being recorded on-board and processed after the recovery of the gondola. For this study focused on the TTL tran-sition layer and the UT, we will make use of the micro-SDLA data in the altitude range from 9 km to 18.5 km. A further discussion of the H2O data in the LS, near the flight
5
ceiling, is made in the paper by Nielsen et al. (2006).
3 Observations
The micro-SDLA was flown twice during the 2004 HIBISCUS field campaign. An overview of the overall HIBISCUS campaign can be found in the paper by Pommereau et al. (2006)1. The first flight, called “SF2”, which stands for “Short duration Flight 2”,
10
took place on 13 February 2004 with a launch at 20:18 UT. The second flight, called “SF4” took place on 24 February 2004, with a launch time at 20:03 UT. At the balloon launch site, a meteorological S-band Doppler radar, operated by the IPMet (Instituto de Pesquisas Meteorol ´ogicas), was providing real-time observations of precipitation within a 450 km range.
15
3.1 Brief overview of the meteorological situations
During the flight period, in February 2004, the rainfall anomaly was positive in most part of Brazil. The eastward propagation of intra-seasonal atmospheric oscillations, ema-nating from the Indian and Pacific Oceans, continued to induce convective activity over Brazil. The frontal systems rapidly advanced over southern Brazil and became
station-20
ary over the Southeast Brazil region, establishing two episodes of convection in the Bauru region associated to the South Atlantic Convergence Zone (SACZ). The SACZ produces an elongated band of high convective activity emanating from the Amazon basin and running southeastwards into the South Atlantic Ocean, typical in summer over the South American continent.
ACPD
6, 12469–12501, 2006 In situ measurements of H2O in the TTL during HIBISCUS G. Durry et al. Title Page Abstract Introduction Conclusions References Tables Figures ◭ ◮ ◭ ◮ Back CloseFull Screen / Esc
Printer-friendly Version Interactive Discussion
EGU
The two flights took place in different meteorological conditions. On the synoptic scale, the flight of SF2 took place under diminishing influence of a high pressure sys-tem at the surface and the 200 hPa divergence slowly advancing southwards from Northeast Brazil, resulting in unstable conditions over most of the State of S ˜ao Paulo. During the afternoon of 13 February 2004, the Bauru radar observed moderate
con-5
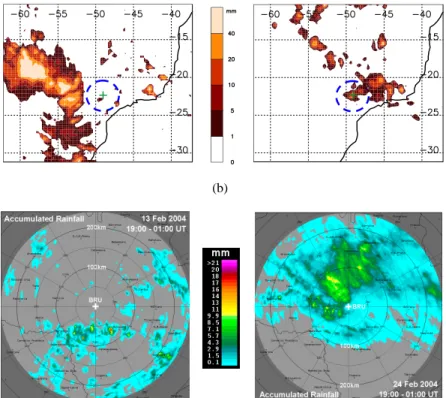
vective activity within the 240 km radar range. At the time of the launch of SF2, the nearest storm was about 60–70 km south-east of the Bauru radar, but remained more or less stationary and at no stage did it impact on the flight trajectory (Fig. 2b, left). However, at the same time, the radar in Presidente Prudente, 240 km west-north-west of Bauru, showed a large area of instability (echo tops up to 16 km–17 km) moving
10
in from north-west and west, but it never came closer than 300 km from the balloon track, as illustrated in Fig. 2a (left), showing the TRMM surface rainfall accumulated approximately during the duration of the flight for the region of interest.
From 20 to 24 February, the Bauru area was under the SACZ influence leading to convective conditions during the SF4 flight. This is illustrated by the TRMM
accumu-15
lated rainfall depicted in Fig. 2a (right). A large area of instability within the SAZC, with more or less randomly developing intense cells was first observed by IPMet’s radars in the far north-west of the State of S ˜ao Paulo, between 07:00 and 08:00 LT (10:00–11:00 UT), expanding eastwards while moving towards south-east as a whole. Significant intensification occurred from noon onwards, resulting in a extensive
multi-20
cellular complex, with echo tops of up to 13–15 km (Pommereau et al., 20061), heading towards Bauru during the late afternoon. At the time of the launch, the storm com-plex was about 120 km to the north-west, moving at 40 km h−1 south-eastwards and reaching Bauru shortly after 23:00 UT. The radar accumulated rainfall for a 6-h period, commencing one hour before the launch, is shown in Fig. 2b (right). The convective
25
activity during SF4 flight was significantly higher than for the SF2 case, but both flights were performed in the vicinity of cloudy areas (Huret et al., 20062). The wind intensity is similar on both days, with a maximum of 25–30 m s−1 between 11 km and 15 km al-titude, but from south-west for SF2 and from the north-west for SF4, and light winds
ACPD
6, 12469–12501, 2006 In situ measurements of H2O in the TTL during HIBISCUS G. Durry et al. Title Page Abstract Introduction Conclusions References Tables Figures ◭ ◮ ◭ ◮ Back CloseFull Screen / Esc
Printer-friendly Version Interactive Discussion
(5–10 m s−1) in the 15 km to 18 km altitude range, turning to the east-south-east in the stratosphere (Pommereau et al., 20061).
3.2 Location of the TTL for both flights
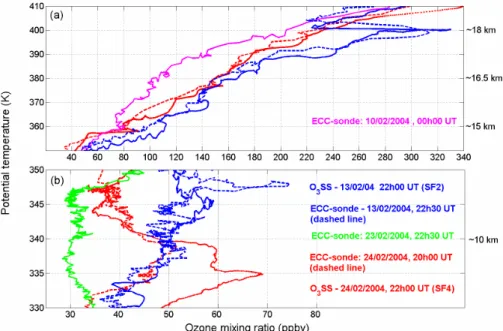
Measured ozone and temperature profiles were used to determine the extent of the TTL for both flights. The TTL is the transition layer between air with tropospheric
prop-5
erties and air with stratospheric properties (Highwood and Hoskins 1998, Folkins et al., 1999). In practice, there are several definitions relevant for the TTL, based either on thermodynamic properties, or on ozone mixing ratio. Following Sherwood and Dessler (2000), the TTL ranges from the zero net radiative heating level to the highest level that convection reaches. However this definition is difficult to use in the present study,
10
which is based on profile measurements of temperature, H2O, and chemical species.
Sherwood and Dessler (2000) report that the TTL lies in the altitude range from ap-proximately 13 km to 18 km, which corresponds to an isentropic surface range from roughly 345 K to 410 K. According to Folkins et al. (1999), the TTL is a mixing layer and its bottom is at the chemopause, i.e. the altitude from which there is an increase
15
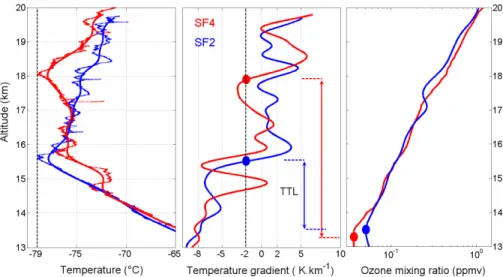
in the ozone mixing ratio. In the present study, we base our definition of the TTL on temperature profiles, lapse rates and ozone profiles (Fig. 3).
To locate the top of the TTL, we use the definition from the SPARC tropopause work-shop (Haynes and Shepherd, 2001), which suggested the use of either the lapse rate tropopause (LRT) or the cold point tropopause (CPT). In the tropics the LRT and the
20
CPT are usually less than 0.5 km apart. Here we locate the top of the TTL at the lapse rate point tropopause (using WMO definition: the base of a layer at least 2 km thick, in which the vertical temperature gradient, ∂T /∂z, exceeds the value –2 K km−1) which corresponds to the dynamic barrier level. This gives a top TTL level at 15.5 km for SF2 and at 17.8 km for SF4. Note that in both cases the LRT is close in altitude to the CPT:
25
the cold point tropopause is at an altitude of 15.6 km for SF2 and 18.0 km for SF4. The temperature minimum value is –79◦C for both flights. We can deduce the altitude of
ACPD
6, 12469–12501, 2006 In situ measurements of H2O in the TTL during HIBISCUS G. Durry et al. Title Page Abstract Introduction Conclusions References Tables Figures ◭ ◮ ◭ ◮ Back CloseFull Screen / Esc
Printer-friendly Version Interactive Discussion
EGU
the bottom of the TTL using the chemopause determined from the ozone soundings performed during HIBISCUS by the electrochemical concentration cell (ECC) ozone sensor from the Danish Meteorological Institute (DMI). The accuracy of the ozone sen-sor is 5% (Komhyr et al., 1995). The two sondes used were launched on 13 February at 22:35 UT and 24 February at 22:30 UT. Since they are very close in time respectively to
5
the SF2 and to the SF4 flights, it is possible to use them to determine the chemopause level. Figure 3 shows that for SF2 the chemopause is observed around 13.5 km altitude and for SF4, around 13.3 km, which is the altitude of the maximum lapse rate of about 8 K/km. Thus, the TTL extension is 13.5–15.5 km for SF2 and 13.3–17.8 km for SF4. In SF2, the TTL is significantly thinner than in SF4. In SF2, there is a sharp transition
10
between the TTL and the LS as illustrated by the lapse rate gradient in Fig. 3. This indi-cates that the dynamical barrier between the troposphere and the stratosphere is well established in SF2. For SF4, the transition is smoother with an alternate of positive and negative lapse rate values between 15.7 and 17.8 km. This and the large TTL extent (13.3–17.8 km) indicates, that there is likely to have been more mixing of tropospheric
15
air with stratospheric air in SF4 than in SF2.
For both flights the temperature range encountered in the TTL varies from –65◦C at the bottom to –79◦C at the cold point tropopause. The TTL appears rather warm compared to previous observations. For instance, Jensen et al. (2005), have reported a cold point at –86◦C, over the Pacific south of Costa-Rica (pre-Aura validation
experi-20
ment) during January 2004, close in time to the SF2 and SF4 dates. This temperature difference in the TTL may be attributed to the fact that HIBISCUS measurements were obtained above a continental surface, while previous studies were done essentially in oceanic conditions.
3.3 H2O and CH4in the UT-LS
25
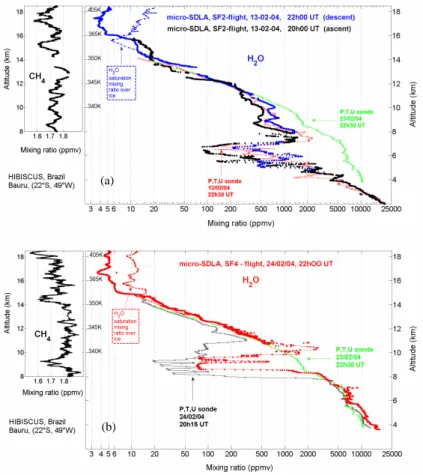
Figure 4 displays the retrieved H2O and CH4 data from micro-SDLA for the SF2 and
SF4 flights. The temporal resolution was of one H2O (and CH4) concentration sample per second for the first flight (SF2) and of four per second for the second flight (SF4).
ACPD
6, 12469–12501, 2006 In situ measurements of H2O in the TTL during HIBISCUS G. Durry et al. Title Page Abstract Introduction Conclusions References Tables Figures ◭ ◮ ◭ ◮ Back CloseFull Screen / Esc
Printer-friendly Version Interactive Discussion
The vertical concentration profiles are therefore composed of a few thousands of in-dividual measurements. Additional meteorological balloonborne soundings obtained close in time to the flights (13 February 2004 at 22:30 UT and 24 February 2004 at 20:15 UT) with Vaisala RS-90 and RS-80 sondes by IPMET/UNESP (Institute for Me-teorological Research of the S ˜ao Paulo State University) and by DMI (Danish
Meteoro-5
logical Institute) are added to the figure for comparison with the measurements made by the micro-SDLA in the troposphere. Another sounding performed on 23 February at 22:30 UT (green line in Figs. 4a and b) is also displayed. This sounding will be used later in the discussion as a reference for H2O and O3since this sounding took place in
tropical air masses far from any extratropical intrusions.
10
For the SF2 flight in the UT (Fig. 4a), a water vapor minimum of 100 ppmv is observed in the troposphere around 6.5 km altitude. At 8–10 km, the instrument measures ap-proximately 800 ppmv. The sounding close to SF2 gives the same water vapor profile shape, and the achieved water vapor contents are in between the micro-SDLA ascent and descent data. CH4 measurements in the UT for SF2 flight remain close to the
15
expected surface value (1.8 ppmv) with no special features. For the SF4 flight in the UT (Fig. 4), a very dry layer is observed around 9.5 km (340 K potential temperature surface) in a∼2 km thick layer with a water vapor mixing ratio lower than 100 ppmv. One can even see a very thin substructure (less than 100 m) at 9 km altitude with an increase of water vapor amount up to 900 ppmv. The corresponding CH4data provided
20
by micro-SDLA in this altitude range are also displayed in Fig. 4 and show a good cor-relation with H2O dry layer with CH4values 0.2 ppmv lower than the expected surface
value and than the CH4observed in the whole troposphere. The water vapour sound-ing launched two hours before the SF4-flight also shows this type of shape with an alternation of very dry thin layers. The vertical extent and the intensity of this dry layer
25
is larger but in the same altitude range. The sounding launched one day before the SF4 flight (in green) does not show this dry layer with a water vapor content more than ten times greater than SF4 at 9.5 km, i.e. 1500 ppmv. A specific process has happened between, 23 and 24 February in the UT leading to the drying of the layer around 9.5 km.
ACPD
6, 12469–12501, 2006 In situ measurements of H2O in the TTL during HIBISCUS G. Durry et al. Title Page Abstract Introduction Conclusions References Tables Figures ◭ ◮ ◭ ◮ Back CloseFull Screen / Esc
Printer-friendly Version Interactive Discussion
EGU
For both flights, a CH4decrease of roughly 0.2 ppmv is detected around 15 km for SF2 and 14.5 km for SF4. Nearly at the same altitude levels as these methane structures, a sharp decrease in the water vapor profiles can be observed: within roughly five hun-dred meters, the H2O mixing ratio changes from 20 ppmv down to 6 ppmv for SF4 and from 10 ppmv down to 6 ppmv for SF2 (descent data).
5
In the TTL and LS, the measured H2O mixing ratios for both flights range roughly
from 20 ppmv at 14 km down to 5 ppmv at 18 km with values between 3.5 and 6 ppmv in the 16–18 km range. Also displayed in Fig. 4 is the saturation mixing ratio over ice above 14 km altitude. For flight SF2, the air is largely supersaturated (over 150% in relative humidity with respect to ice saturation) up to 15.5 km and largely
undersatu-10
rated above (down to∼20% in relative humidity). Dehydration by ice nucleation and subsequent sedimentation is likely to take place in the upper troposphere and the TTL on this occasion. Additionally, for this flight, above the top of the TTL, the undersatu-rated conditions indicate that the vertical dynamical barrier is strong enough to prevent troposphere to stratosphere exchange at the lapse rate tropopause level. For SF4, the
15
air is also supersaturated (in the order of 120%) up to 15 km and undersaturated above (down to∼30%). In this case, the upper part of the TTL is dry, leading to no possible dehydration by ice condensation and sedimentation. In the LS, the air is significantly undersaturated for both flights. A detailed calculation of the saturation ratio for SF2 and SF4 can be found in Mar ´ecal et al. (2006). Nevertheless, compared to the
mea-20
surements presented by V ¨omel et al. (2002) and Jensen et al. (2005), both SF2 and SF4 H2O mixing ratios are significantly larger above 17–17.5 km with values generally
greater than 4 ppmv. They are also larger than those reported by Richard et al. (2006) during ER-2 flights near Costa-Rica above the 380 K isentropic level. Air in the LS over Brazil is thus moister than in tropical oceanic conditions. This is consistent with the
25
warmer conditions recorded in the LS over Brazil leading to less dehydration than in colder conditions recorded in the LS over the tropical ocean.
ACPD
6, 12469–12501, 2006 In situ measurements of H2O in the TTL during HIBISCUS G. Durry et al. Title Page Abstract Introduction Conclusions References Tables Figures ◭ ◮ ◭ ◮ Back CloseFull Screen / Esc
Printer-friendly Version Interactive Discussion
3.4 Ozone in the UT-LS
The examination of ozone measurements in the UT-LS provides complementary in-formation on the dynamical processes affecting the probed air masses. During HI-BISCUS, ozone soundings were performed by the DMI ECC ozone sensors but also by the O3-SSS sensor, a solid-state semiconductor sensor developed at UCAM
Cam-5
bridge (Hansford at al., 2005) that was operated as a piggy-back on the flight chain of the micro-SDLA flights. Figure 5 shows the ozone measurements achieved in the UT-LS at the time of the flights above the 330 K isentropic level. Two soundings per-formed on the 10 and 23 February have been added to the figure. The measurements on 23 February were used in Fig. 4 (green line) as a reference for water vapour. The
10
corresponding ozone data will be used here as a reference for ozone in the UT, since the sonde probed tropical air masses free from extratropical intrusions. The measure-ments on 10 February will be used as a reference profile for O3 in the TTL and LS.
Figure 5 shows that the ECC and O3-SSS measurements generally agree well. The differences found below 10 km on 24 February can be attributed to the difference in
15
time between the two soundings.
In the UT, near 340 K (∼9.5 km), the SF4 flight appears rather rich in ozone com-pared to the reference sonde on 23 February. This ozone-rich layer is at the same isentropic level where a very dry and CH4-poor layer was observed (335–340 K). An analysis of the O3 profiles shows that for both flights, there is a local ozone
maxi-20
mum just below the chemopause (∼350K). In their study over the equatorial Pacific and equatorial Eastern Brazil, V ¨omel et al. (2002) have classified O3 and H2O pro-files in the upper troposphere. Propro-files associated with deep convection have a strong decrease in ozone concentration in the UT from 10 ppbv at 10 km to 1 ppbv at the chemopause. In non-convective cases or when convection did not reach a sufficient
25
altitude in the UT, the O3mixing ratios are higher (40 ppb) and the profiles are constant
up to the chemopause as observed on 23 February 2004 (green line in Fig. 5b). Ozone and water vapor profiles from both micro-SDLA flights are similar to those reported by
ACPD
6, 12469–12501, 2006 In situ measurements of H2O in the TTL during HIBISCUS G. Durry et al. Title Page Abstract Introduction Conclusions References Tables Figures ◭ ◮ ◭ ◮ Back CloseFull Screen / Esc
Printer-friendly Version Interactive Discussion
EGU
these authors over South America on February 1997, with a local maximum of ozone below the chemopause (around 350 K). Therefore, if referring to V ¨omel et al. (2002), none of our ozone measurements seem to be associated with cases affected locally by convection in the UT.
In the TTL and LS, there is a clear increase in the ozone content for SF2 compared to
5
SF4 in the 17 km to 18 km range, with a maximum difference of up to 80 ppbv at 18 km. We also observe that the O3 content for both flights is significantly greater (by up to 100 ppbv) than the 10 February reference ECC sonde. A similar order of magnitude in the O3 excess was also reported by Waugh and Funatsu (2003) from the ozone
sounding over Hilo, Hawaii, in a case of extratropical intrusion in January 1987.
10
From the comparison with all the ozone soundings achieved during HIBISCUS (not shown), it appears that in both flights the micro-SDLA has probed air-masses enriched in ozone.
4 Discussion of H2O in the UT, TTL and LS
To summarize the observations, for both flights, the overall TTL was found warmer
15
(with a cold point near –79◦C) and the LS moister compared to former measurements obtained in tropical oceanic conditions. The vertical extent of the TTL transition layer for SF4 is nearly twice as much as for SF2, and the lapse rate features a sharp transition between TTL and LS for SF2 and smoother for SF4. The LS for SF2, and the upper part of the TTL and the LS for SF4, which are discussed in next section, are found
20
largely subsaturated. The ozone measurements give insights of potential occurrence of extratroptical intrusions, particularly in the UT for SF4 and in the LS for SF2.
4.1 Intrusions of extratropical air into the UT-LS
In the UT, there is, for SF4, a very dry layer with low CH4and high O3. To identify the
occurrence of an extratropical intrusion in the UT, we have run the MIMOSA contour
ACPD
6, 12469–12501, 2006 In situ measurements of H2O in the TTL during HIBISCUS G. Durry et al. Title Page Abstract Introduction Conclusions References Tables Figures ◭ ◮ ◭ ◮ Back CloseFull Screen / Esc
Printer-friendly Version Interactive Discussion
vection model (Hauchecorne et al., 2002) of the potential vorticity (PV). The MIMOSA model was used previously in several studies, for instance, to follow the evolution of polar and tropical intrusions at mid-latitudes (Heese et al., 2001; Durry et al., 2002b; Durry and Hauchecorne, 2005; Huret et al., 2006). During HIBISCUS, PV maps have been calculated with MIMOSA every six hours on isentropic surfaces in the TTL with
5
a 5 K resolution using the ECMWF fields. MIMOSA has to be used with caution in the UT and the TTL because it is based on isentropic advection and does not take into account a possible vertical transport of air masses. The MIMOSA predictions are nonetheless for each case reinforced by the exmaination of the corresponding tracer measurements. Figures 6 and 7 show the PV-maps in the 340 K to 415 K range with
10
a 5 K-resolution for SF2 and SF4, respectively. The micro-SDLA instrument is located on the PV-maps using its onboard GPS.
In the upper troposphere, MIMOSA confirms for SF4 the presence of a filament of extratropical stratospheric air at 340 K (see Fig. 7, PV map at 340 K). This filament explains the presence of the very dry layer observed in SF4 at 9.5 km with low CH4
15
and high O3, typical of stratospheric air. The process is similar to that observed in the
UT by Scott et al. (2001) over the southern tropical Atlantic when the aircraft in the UT crossed a potential vorticity filament coming from mid-latitude showing a strong discon-tinuity in potential temperature, a low relative humidity and an ozone mixing ratio peak greater than 70 ppbv at 10 660 m. It is remarkable that MIMOSA is able to simulate
20
the filament, since in the tropical UT diabatic processes, and in particular convection, possibly degrade the prediction of PV advection. Nevertheless, according to the ex-amination of the ozone profile described in Sect. 3, the situation is non-convective in the UT at the time and place of the flight. Within one day, the filament is formed and advected in a convection-free atmosphere until it reaches the convection zone located
25
near Bauru as illustrated by Fig. 2a (left) showing TRMM surface rain-rates during the flight period. The BRAMS meso-scale model, which is used in the companion paper associated to this study (Huret et al., 20062), also predicts the presence of this filament in the UT.
ACPD
6, 12469–12501, 2006 In situ measurements of H2O in the TTL during HIBISCUS G. Durry et al. Title Page Abstract Introduction Conclusions References Tables Figures ◭ ◮ ◭ ◮ Back CloseFull Screen / Esc
Printer-friendly Version Interactive Discussion
EGU
We see in Figs. 6 and 7 that extratropical intrusions were also present in the TTL and LS for both flights. One remarkable feature provided by the PV maps is the tongue of high PV (|PV|>2) stratospheric mid-latitude air in the 385 K to 405 K range for SF2 in the LS (Fig. 6). To better examine the impact of isentropic transport in this altitude range, vertical PV profiles were extracted from the MIMOSA simulations for both flights and
5
plotted in Fig. 8, in conjunction with the H2O, CH4, O3 and temperature. For SF2 (in
blue in Fig. 8), the signature of the intruding tongue can be clearly seen in the 385 K to 405 K range. In this layer, there is a correlation between PV, CH4, O3and temperature. Low CH4and high O3are observed in air masses of high-PV suggesting an extratropical
stratospheric origin. Furthermore, from 370 K to 390 K the temperature is nearly
con-10
stant but above 390 K, a positive gradient of temperature, typical of the stratosphere, is observed in the region of interest. The hydrogen budget [H2O]+2[CH4] yields values
within 7.2 to 7.5 ppmv, which is a further indication of mid-latitude stratospheric origin (Durry et al., 2002b, Z ¨oger et al., 1999). Hence, there are several lines of evidence (low CH4, high O3, high PV, hydrogen budget, temperature measurements) showing
15
that the micro-SDLA has probed air masses originating from the southern mid-latitude stratosphere during SF2. This also explains the∼4 ppmv H2O content recorded by the
micro-SDLA, which is typical of mid-latitude H2O values. Also in SF2, a thin layer of
low H2O (3.3 ppmv), anticorrelated with CH4can be seen at 400 K. When taking into
account the systematic 300 m shift upwards of ozone resulting from the 50 s time
con-20
stant of the ECC sensor, it would also correspond to an ozone dip. Indeed, the PV profile and the maps of Fig. 6 show, that at this altitude, the balloon is located within a low|PV| tropical air parcel. For the isentropic levels lower than 385 K, it is difficult to conclude about potential impact of isentropic transport, as the instrument is found at the edge of the intrusion (Fig. 6).
25
4.2 Vertical transport by convection into the TTL for SF4
For the SF4 data (in red in Fig. 8), the isentropic transport is a less convincing expla-nation for the large amount of 5.5 ppmv of H2O observed between 390 K and 405 K.
ACPD
6, 12469–12501, 2006 In situ measurements of H2O in the TTL during HIBISCUS G. Durry et al. Title Page Abstract Introduction Conclusions References Tables Figures ◭ ◮ ◭ ◮ Back CloseFull Screen / Esc
Printer-friendly Version Interactive Discussion
The MIMOSA predictions, as well as the CH4or O3profiles, do not show any particular structures. At 385 K (∼16.5 km), the micro-SDLA measures 3.5 ppmv of H2O while at
395K (∼17.5 km), it gives 5.5 ppmv. The examination of the corresponding PV-maps in Fig. 7 shows that the micro-SDLA was probing tropical air masses with the same low PV at both isentropic levels. From MIMOSA results, the isentropic transport can not
5
explain for the difference of 2 ppmv observed between both isentropic levels. The cal-culation of the hydrogen budget [H2O]+2[CH4] between 390 K and 405 K gives a value
near 8.5–9 ppmv, which is too high to be of mid-latitude stratospheric origin. For SF4, the O3profile is unstructured in the whole TTL. While an increase in H2O with altitude
is observed in SF4, the methane mixing ratio remains fairly close to the surface value
10
at 1.75 ppmv. This could be due to a convective transport of tropospheric moist air in this region which is far from the saturation with respect to ice over 370 K. For instance, at 395 K, the water vapor saturation mixing ratio over ice is 11 ppmv. The vertical trans-port by convection could also explain why, for SF4, methane concentration remains close to the surface values in the TTL. A more precise examination of the CH4
pro-15
file (see dashed black line in Fig. 8 which gives average values for CH4in SF4), shows
that methane decreases between 370 K–380 K. Above 380 K, it increases again to con-verge towards surface values near 1.75 ppmv in the region of interest. Above 400 K, the methane starts to decrease again to 1.6 ppmv as the instrument enters the lower tropical stratosphere. From 370 K to 390 K, the temperature is nearly constant like for
20
SF2; nevertheless, above 390 K, we observe a cooling up to the cold point tropopause. This cooling could be associated with the nearly adiabatic vertical transport by convec-tion. But with the assumption of a convective transport close in time and location of the SF4 flight, the ozone mixing ratio would be expected to decrease because the air masses originating from the lower troposphere have lower ozone mixing ratios. The
25
absence of a clear feature in ozone could suggest that the transport by convection of moist tropospheric air had occurred significantly before the flight, leading to a partial mixing of this air with its environment. Another potential explanation for this insignificant signature is a local photochemical production of ozone related to the transport of ozone
ACPD
6, 12469–12501, 2006 In situ measurements of H2O in the TTL during HIBISCUS G. Durry et al. Title Page Abstract Introduction Conclusions References Tables Figures ◭ ◮ ◭ ◮ Back CloseFull Screen / Esc
Printer-friendly Version Interactive Discussion
EGU
precursors by convection and the production of NOxby lightning (Rivi `ere et al., 2006).
Whatever the explanation is, mixing or photochemical production, it is likely that there was some delay between the time of the in situ measurements and the occurrence of the convective event causing the vertical elevation of the moist tropospheric air mass. This delay must be long enough for these processes, mixing or ozone photochemical
5
production, to be effective. Hence, to support this hypothesis, it is required to calculate backwards trajectories in the TTL over a few days corresponding to the period when the SACZ was over the Bauru region. For this purpose, a meso-scale model with sufficient vertical resolution and based on local meteorology is used in Huret et al. (2006)2. 4.3 Comparison with mid-latitude H2O data
10
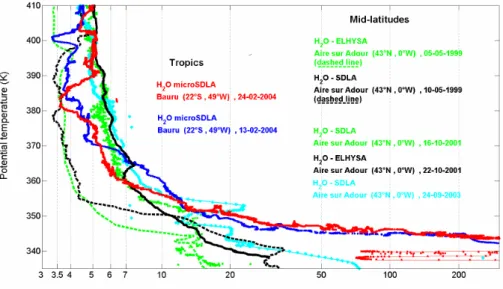
A further insight for the occurrence of a convective transport of H2O into the TTL for
SF4 can be found in the comparison between HIBISCUS data and previous observa-tions at mid-latitudes H2O measurements. Indeed, the H2O mixing ratios reported by micro SDLA in the TTL in this flight are comparable to that observed at mid-latitudes at identical potential temperature levels. To illustrate this point, Fig. 9 displays the
mea-15
sured H2O data in the UT-LS, superimposed to previous northern mid-latitudes H2O measurements from the balloonborne SDLA laser hygrometer (Durry et Megie, 1999) and from the ELHYSA frost-point hygrometer (Ovarlez, 1991) at Aire sur l’Adour (44◦N, France). Above the tropopause, at about 360 K, the mid-latitude observations display the seasonal cycle of water vapor (Randel et al., 2001), the lower stratosphere being
20
more moist in autumn compared to spring. Although the HIBISCUS measurements were performed in the Southern Hemisphere, the small difference between both hemi-spheres makes the comparison valid. Up to 380 K, the two tropical profiles, recorded in summer, are close to the mid-latitude autumn data. Above this level, they shift be-tween spring and autumn mid-latitude concentrations. The SF2 layers and the driest
25
layer in SF4 (3.5–4 ppmv) are close to spring mid-latitude values while the humidity of the moist layers in SF4 (∼5 ppmv, between 390 K to 400 K) is close to that of the autumn mid-latitude profiles. If the moist layers in SF4, between 390 K and 400 K,
ACPD
6, 12469–12501, 2006 In situ measurements of H2O in the TTL during HIBISCUS G. Durry et al. Title Page Abstract Introduction Conclusions References Tables Figures ◭ ◮ ◭ ◮ Back CloseFull Screen / Esc
Printer-friendly Version Interactive Discussion
were due to convection as discussed above, this comparison would suggest that the increased humidity in the autumn could be the result of re-hydration of the lower strato-sphere in the tropics during the convective summer, followed by isentropic exchange with the mid-latitudes.
5 Conclusions
5
High resolution H2O measurements have been performed by the microSDLA
balloon-borne laser hygrometer in the UT, the TTL and the LS over Brazil (22◦S) during the HI-BISCUS field campaign in February 2004. The combination of balloon flights descend-ing slowly in the TTL and the high resolution of microSDLA has allowed observdescend-ing thin layering in the H2O profiles in the UT, TTL and LS. Simultaneous or quasi-simultaneous
10
CH4, O3and temperature measurements and PV-profiles provides insight on the origin of the strong layering.
In the UT for SF4, the unambiguous signature of a filament of extratropical strato-spheric air, crossed by the sensor was identified near 10 km (340 K), corresponding to a very dry layer, with low CH4and high O3. In the LS, for SF2, in the 17 km to 18 km range
15
(385 K to 405 K) the instrument crossed a tongue of high-PV stratospheric mid-latitude air intruding the tropical LS. A very good agreement was found between the predictions of the MIMOSA PV-advection model in the TTL and LS and the in situ tracer measure-ments: the MIMOSA model predicts a strong increase in the PV when low CH4and high
O3are detected. The corresponding H2O data are typical of mid-latitude stratospheric
20
values and range from 3.5 ppmv to 5 ppmv. No significant dehydration by ice nucleation and subsequent sedimentation was detected in the TTL and LS, likely because signifi-cant undersaturated conditions occur. For the second flight (SF4), in the same altitude range, a high H2O mixing ratio of 5.5 ppmv is observed, as well as a cooling and an
enrichment of methane. It could be related to a convective transport of tropospheric
25
air moistening the subsaturated TTL in the 385 K–405 K range. Compared to previous measurements of water vapour in the UTLS in oceanic conditions (V ¨omel et al, 2002;
ACPD
6, 12469–12501, 2006 In situ measurements of H2O in the TTL during HIBISCUS G. Durry et al. Title Page Abstract Introduction Conclusions References Tables Figures ◭ ◮ ◭ ◮ Back CloseFull Screen / Esc
Printer-friendly Version Interactive Discussion
EGU
Jensen et al., 2005; Richard et al., 2006), the micro-SDLA observations exhibit larger H2O mixing ratios in the LS. This is consistent with the warmer temperatures measured
at and around the cold point tropopause by micro-SDLA, leading to less dehydration. This seems to indicate that the tropical LS is moister over continent than over ocean. This suggests further that the land convective systems could be a source of
strato-5
spheric moisture in the summer season. Nevertheless, more measurements in the LS in continental conditions are needed to confirm this result.
The examination of the TTL based on the two flights of the HIBISCUS campaign underlines the complexity of the processes controlling H2O in the UT-LS. Within the 10
days separating both flights of the micro-SDLA, at the same isentropic levels, between
10
385 K and 405 K, tongues of stratospheric mid-latitude air, followed by convective trans-port, have largely modified the H2O profiles. The relatively warm TTL, over the land
convective region of the South Atlantic Convergence Zone, appears as a highly struc-tured layer of mixing between air parcels advected isentropically from the mid-latitudes lower stratosphere, the overworld of Holton et al. (1995), and convectively lifted
tropo-15
spheric air.
Acknowledgements. This study is supported by funds from the 5th PCRD (HIBISCUS project) and the French Centre National de la Recherche Scientifique (Programme National de Chimie Atmosph ´erique). The Technical Department of the Institut National des Sciences de l’Univers (N. Amarouche, F. Blouzon, J. Deleglise) is thanked for its assistance in the balloon operations 20
of the micro-SDLA sensor. The authors would like further to thank the CNES (Centre National d’Etude Spatiale) launching balloon team. We also thank the coordinators of the TroCCiBras Project and IPMet staff for providing the infrastructure support during the campaign. Finally, we acknowledge S. Freitas and K. Longo for providing us with the TRMM rainfall files used in the paper.
25
References
Durry, G. and Megie, G.: Atmospheric CH4and H2O monitoring with near-infrared InGaAs laser diodes by the SDLA, a balloonborne spectrometer for tropospheric and stratospheric in situ
ACPD
6, 12469–12501, 2006 In situ measurements of H2O in the TTL during HIBISCUS G. Durry et al. Title Page Abstract Introduction Conclusions References Tables Figures ◭ ◮ ◭ ◮ Back CloseFull Screen / Esc
Printer-friendly Version Interactive Discussion
measurements, Appl. Opt., 38, 7342–7354, 1999.
Durry, G., Pouchet, I., Amarouche, N., Danguy, T., and Megie, G.: Shot-noise-limited dual-beam detector for atmospheric trace-gas monitoring with near-infrared diode lasers, Appl. Opt., 39, 5609–5619, 2000a.
Durry, G. and Megie, G.: In situ measurements of H2O from a stratospheric balloon by diode 5
laser direct-differential absorption spectroscopy at 1.39 µm, Appl. Opt., 39, 5601–5608, 2000b.
Durry, G., Danguy, T., and Pouchet, I.: Open two-mirror multipass absorption cell for in situ monitoring of stratospheric trace-gas with telecommunication laser diodes, Appl. Opt., 41, 424–433, 2002a.
10
Durry, G., Hauchecorne, A., Ovarlez, J., Ovarlez, H., Pouchet, I., Zeninari, V., and Parvitte, B.: In situ measurement of H2O and CH4with telecommunication laser diodes in the lower stratosphere: dehydration and indication of a tropical air intrusion at mid-latitudes, J. Atmos. Chem., 43, 175–194, 2002b.
Durry, G., Amarouche, N., Z ´eninari, V., Parvitte, B., Lebarbu, T., and Ovarlez, J.: In situ sensing 15
of the middle atmosphere with balloonborne near-infrared laser diodes, Spectrochim. Acta A, 60(14), 3371–3379, 2004.
Durry, G., Zeninari, V., Parvitte, B., Le barbu, T., Lefevre, F., Ovarlez, J., and Gamache, R. R.: Pressure-broadening coefficients and line strengths of H2O near 1.39 µm: application
to the in situ sensing of the middle atmosphere with balloonborne diode lasers, J. Quant. 20
Spectrosc. Radiat. Transfer, 94(3–4), 387–403, 2005.
Durry, G. and Hauchecorne, A.: Evidence for long-lived polar vortex air in the mid-latitude summer stratosphere from in situ laser diode CH4 and H2O measurements, Atm. Chem. Phys. , 5, 1467–1472, 2005.
Folkins, I., Loewenstein, M., Podolske, J., Oltmans, S. J., and Proffitt, M.: A barrier to vertical 25
mixing at 14 km in the tropics: Evidence from ozonesondes and aircraft measurements, J. Geophys. Res., 104(D18), 22 095–22 102, 1999.
Hall, T. M. and Waugh, D. W.: Tracer transport in the tropical stratosphere due to vertical diffusion and horizontal mixing, Geophys. Res. Lett., 24, 1383–1387, 1997.
Hansford, G. M., Freshwater, R. A., Bosch, R. A., Cox, R. A., Jones, R. L., Pratt, K. F. E., and 30
Williams, D. E.: A Low Cost Instrument based on a Solid State Sensor for Balloon-borne Atmospheric O3 Profile Sounding, J. Environ. Monit.,7, 158–162, doi:10.1039/b412184h, 2005.
ACPD
6, 12469–12501, 2006 In situ measurements of H2O in the TTL during HIBISCUS G. Durry et al. Title Page Abstract Introduction Conclusions References Tables Figures ◭ ◮ ◭ ◮ Back CloseFull Screen / Esc
Printer-friendly Version Interactive Discussion
EGU
Hauchecorne, A., Godin, S., Marchand, M., Heese, B., and Souprayen, C.: Quantification of the transport of chemical constituents from the polar vortex to midlatitudes in the lower stratosphere using the high-resolution advection model MIMOSA and effective diffusivity, J. Geophys. Res., 107(D20), 8289, doi:10.1029/2001JD000491,2002.
Haynes, P. H. and Shuckburgh, E. F.: Effective diffusivity as a diagnostic of atmospheric trans-5
port, II, Troposphere and lower stratosphere, J. Geophys. Res., 105, 22 795–22 810, 2000. Haynes, P. H. and Shepherd T.: Report on the SPARC Tropopause workshop, SPARC
Newslet-ter n◦17, 3-10, 2001.
Heese, B., Godin, S., and Hauchecorne, A.: Forecast and simulation of stratospheric ozone filaments: A validation of a high-resolution potential vorticity advection model by airborne 10
ozone lidar measurements in winter 1998/1999, J. Geophys. Res., 106(D17), 20 011–20 024, 2001.
Highwood, E. J. and Hoskins, B. J.: The tropical tropopause, Q. J. R. Meteorol. Soc., 124, 1579–1604, 1998.
Holton, J. R., Haynes, P. H., McIntyre, M. E., Douglass, A. R., Rood, R. B., and Pfister, L.: 15
Stratosphere-troposphere exchange, Rev. Geophys., 33, 403–439, 1995.
Horinouchi, T. F., Sassi, F., and Boville, B.: Synoptic-scale Rossby waves and geographic dis-tribution of lateral transport routre between the tropics and extratropics in the mower strato-sphere, J. Geophys. Res., 105, 26 579–26 592, 2000.
Huret, N., Pirre, M., Hauchecorne, A., Robert, C., and Catoire, V.: On the vertical structure 20
of the stratosphere at mid-latitude during the first stage of the polar vortex formation and in polar region in presence of a large mesospheric descent, J. Geophys. Res., 111, D06111, doi:10.1029/2005JD006102,2006a.
Jensen, E., Smith, J. B., Pfister, L., Pitman, J. V., Weinstock, E. M. , Sayres, D. S. , Herman, R. L., Troy, R. F. , Rosenlof, K., Thompson, T. L., Fridlind, A., Hudson, P., Cziczo, D. J., 25
Heymsfield, A. J., Schmitt, C., and Wilson, J. C.: Ice supersaturations exceeding 100% at the cold tropical tropopause : implications for cirrus formation and dehydration, Atmos. Chem. Phys., 5, 851–862, 2005,
http://www.atmos-chem-phys.net/5/851/2005/.
Kiladis G. N. and Weickmann, K. M.: Extratropical forcing of tropical Pacific convection during 30
northern winter, Mon. Wea. Rev., 120, 1924–1938, 1992.
Kiladis, G. N.: Observations of Rossby waves linked to convection over the eastern tropical Pacific, J. Atmos., Sci., 55, 321–339, 1998.
ACPD
6, 12469–12501, 2006 In situ measurements of H2O in the TTL during HIBISCUS G. Durry et al. Title Page Abstract Introduction Conclusions References Tables Figures ◭ ◮ ◭ ◮ Back CloseFull Screen / Esc
Printer-friendly Version Interactive Discussion
Komhyr, W. D., Connor, B. J., McDermid, I. S., McGee, T. J., Parrish, A. D., and Magitan, J. J.: Comparison of STOIC 1999 ground-based lidar, microwave spectrometer, and Dobson spec-trophotometer Umkehr ozone profile with ozone from balloon-borne electrochemical concen-trations cell ozone sondes, J. Geophys. Res., 100(D5), 9273–9282, 1995.
Liu, C. and Zipser, E. J.: Global distribution of convection penetrating the tropical tropopause, 5
J. Geophys. Res., 110, D23104, doi:10.1029/2005JD006063, 2005.
Matthews, A. J. and Kiladis, G. N.: Interactions between ENSO , transient circulation, and tropical convection over the Pacific, J. Climate , 12, 3062–3085, 1999.
Mar ´ecal, V., Durry, G., Longo, K., Freitas, S., Rivi `ere, E., and Pirre, M.: Mesoscale modelling of water vapour in the tropical UTLS: two case studies from the HIBISCUS campaign, Atmos. 10
Chem. Phys. Discuss., 6, 8241–8284, 2006,
http://www.atmos-chem-phys-discuss.net/6/8241/2006/.
Nielsen, J.K., Larsen, N., Cairo, F., Di Donfrancesco, G., Rosen, J. M., Durry, G., Held, G., and Pommereau, J. P.: Solid particles in the tropical lowest stratosphere, Atmos. Chem. Phys. Discuss., 6, 9003–9032, 2006,
15
http://www.atmos-chem-phys-discuss.net/6/9003/2006/.
Ovarlez, J.: Stratospheric water vapor measurement in the tropical zone by means of a frost point hygrometer on board long-duration balloons , J. Geophys. Res., 96, 15 541–15 545, 1991.
Plumb, R. A.: A tropical pipe model of stratospheric transport, J. Geophys. Res., 101, 3957– 20
3972, 1996.
Polvani, L. M., Waugh D. W., and Plumb, R. A.: On the subtropical edge of the stratospheric surf zone, J. Atmos., Sci., 52, 1288–1309, 1995.
Randel, W. J., Wu, F., Gettelman, A., Russell III, J. M., Zawodny, J. M., and Oltmans, S. J.: Sea-sonal variation of water vapour in the lower stratosphere observed in Halogen Occultation 25
Experiment data, J. Geophys. Res., 106, 14 313–14 325, 2001.
Richard, E. C., Tuck, A. F., Aikin, C., Kelly, K. K., Herman, R. L., Troy, R. F., Hovde, S. J., Rosenlof, K. H., Thompson, T. L., and Ray, A.: High-resolution airborne profiles of CH4, O3, and water vapour near tropical Central America in late January to early February 2004, J. Geophys. Res., 111, D13304, doi:10:1029/2005JD006513, 2006.
30
Rivi `ere, E. D., Mar ´ecal, V., Larsen, N., and Cautenet, S.: Modelling study of the impact of deep convection on the UTLS air composition. Part 2: budget of ozone in the TTL, Atmos. Chem. Phys., 6, 1585–1598, 2006,
ACPD
6, 12469–12501, 2006 In situ measurements of H2O in the TTL during HIBISCUS G. Durry et al. Title Page Abstract Introduction Conclusions References Tables Figures ◭ ◮ ◭ ◮ Back CloseFull Screen / Esc
Printer-friendly Version Interactive Discussion
EGU
http://www.atmos-chem-phys.net/6/1585/2006/.
Scott, R. K., Cammas, J. P., Mascart, P., and Stolle, C.: Stratospheric filamentation into the upper tropical troposphere, J. Geophys. Res., 106, 11 835–11 848, 2001.
Sherwood, S. C. and Dessler, A. E.: On the control of stratospheric humidity, Geophys. Res. Lett., 27, 2513–2516, 2000.
5
Tuck, A., Hovde, S. J., Kelly, K. K., Reid, S. J., Richard, E. C., Atlas, E. L., Donnelly, S. G., Stroud, V. R., Cziczo, D. J., Murphy, D. M., Thomson, D. S., Elkins, J. W., Moore, F. L., Ray, E. A., Mahoney, M. J., and Friedl, R. R.: Horizontal variability 1–2 km below the tropical tropopause, J. Geophys. Res, 109, D05310, doi:10.1029/2003JD003942, 2004.
V ¨omel, H., Oltmans, S. J., Johnson, B. J., Hasebe, F., Shiotani, M., Fujiwara, M., Nishi, N., 10
Agama, M., Cornejo, J., Paredes, F., and Enriquez, H.: Balloon-borne observations of water vapour and ozone in the tropical upper troposphere and lower stratosphere, J. Geophys. Res, 107(D14), 4210–4222, 2002.
Waugh, D. W. and Funatsu, B. M.: Intrusions into the tropical upper troposphere: three-dimensional structure and Accompanying ozone and OLR distributions, J. Atmos., Sci., 60, 15
637–653, 2003.
Weinstock, E. M., Hintsa, E. J., Dessler, A. E., and Anderson, J. G.: Measurements of water vapour in the tropical lower stratosphere during CEPEX campaign: Results and interpreta-tion, Geophys. Res. Lett., 22(23), 3231–3234, 1995.
Z ¨oger, M., Engel, A., McKenna, D. S., Schiller, C., Schmidt, U., and Woyke, T.: Balloon-borne 20
in situ measurements of stratospheric H2O, CH4 and H2at midlatitudes, J. Geophys. Res., 104, 1817–1826, 1999.
ACPD
6, 12469–12501, 2006 In situ measurements of H2O in the TTL during HIBISCUS G. Durry et al. Title Page Abstract Introduction Conclusions References Tables Figures ◭ ◮ ◭ ◮ Back CloseFull Screen / Esc
Printer-friendly Version Interactive Discussion 50 cm Command Acquisition Lasers GPS Open cell (L = 28m) Optical fibers 3-SF ballon
Fig. 1. The micro-SDLA diode laser spectrometer during HIBISCUS in Bauru, Brazil in
Febru-ary 2004. With an overall weight of less than 40 kg, the micro-SDLA sensor is flown from small-size 3000 m3balloons to reach a float altitude near 22 km.
ACPD
6, 12469–12501, 2006 In situ measurements of H2O in the TTL during HIBISCUS G. Durry et al. Title Page Abstract Introduction Conclusions References Tables Figures ◭ ◮ ◭ ◮ Back CloseFull Screen / Esc
Printer-friendly Version Interactive Discussion
EGU
(a)
(b)
Fig. 2. (a) TRMM surface rainfall in mm accumulated from 19:30 UT on 13 February 2004 to
01:30 UT on 14 February 2004 (left panel, SF2 flight) and from 22:30 UT on 24 February 2004 to 01:30 UT on 25 February 2004 (right panel, SF4 flight). The green cross corresponds to the location of the Bauru launch site. The blue circle indicates approximately the 200 km range of the Bauru Radar (BRU). (b) 6-h accumulated radar rainfall within a 240 km range from Bauru from 19:00 UT (about one hour before launch) until the end of the balloon flights at 01:00 UT on the following day. Left: SF2 on 13 February 2004. Right: SF4 on 24 February 2004.
ACPD
6, 12469–12501, 2006 In situ measurements of H2O in the TTL during HIBISCUS G. Durry et al. Title Page Abstract Introduction Conclusions References Tables Figures ◭ ◮ ◭ ◮ Back CloseFull Screen / Esc
Printer-friendly Version Interactive Discussion
Fig. 3. Temperature (micro-SDLA raw and smoothed data), temperature gradients and ozone
ACPD
6, 12469–12501, 2006 In situ measurements of H2O in the TTL during HIBISCUS G. Durry et al. Title Page Abstract Introduction Conclusions References Tables Figures ◭ ◮ ◭ ◮ Back CloseFull Screen / Esc
Printer-friendly Version Interactive Discussion
EGU
(b) (a)
Fig. 4. In situ vertical concentration profiles of H2O and CH4 yielded by the micro-SDLA in-strument during HIBISCUS, on 13 February (SF2, (a)) and on 24 February (SF4, (b)) 2004. Additional tropospheric soundings with RS-90 and RS-80 sondes are also displayed.
ACPD
6, 12469–12501, 2006 In situ measurements of H2O in the TTL during HIBISCUS G. Durry et al. Title Page Abstract Introduction Conclusions References Tables Figures ◭ ◮ ◭ ◮ Back CloseFull Screen / Esc
Printer-friendly Version Interactive Discussion
Fig. 5. Ozone measurements in the TTL and LS (a) and the UT (b) obtained with ECC
bal-loonborne sondes and with the OSSS-sensor (piggy-back in the micro-SDLA flight chain) at the time and place of the micro-SF2 and SF4 flights. Two soundings, on 10 and 23 February 2004 are displayed and used as references for O3in the LS, the TTL and the UT.
ACPD
6, 12469–12501, 2006 In situ measurements of H2O in the TTL during HIBISCUS G. Durry et al. Title Page Abstract Introduction Conclusions References Tables Figures ◭ ◮ ◭ ◮ Back CloseFull Screen / Esc
Printer-friendly Version Interactive Discussion EGU 400 K 390 K 385 K 395 K 405 K 415 K 410 K 380 K (a) 370 K 360 K 340 K 350 K 345 K 355 K 375 K 365 K (b)
Fig. 6. Distribution of the Potential Vorticity predicted by the MIMOSA with a 5 K resolution in
the UT, the TTL and the LS for the SF2 flight on 13 February 2004. The micro-SDLA location in each isentropic level is indicated with the mark SF2. Contours are of potential vorticity (10−8K m2s−1kg−1).
ACPD
6, 12469–12501, 2006 In situ measurements of H2O in the TTL during HIBISCUS G. Durry et al. Title Page Abstract Introduction Conclusions References Tables Figures ◭ ◮ ◭ ◮ Back CloseFull Screen / Esc
Printer-friendly Version Interactive Discussion 400 K 390 K 385 K 395 K 405 K 415 K 410 K 380 K (a) 370 K 360 K 340 K 350 K 345 K 355 K 375 K 365 K (b)
ACPD
6, 12469–12501, 2006 In situ measurements of H2O in the TTL during HIBISCUS G. Durry et al. Title Page Abstract Introduction Conclusions References Tables Figures ◭ ◮ ◭ ◮ Back CloseFull Screen / Esc
Printer-friendly Version Interactive Discussion
EGU
Fig. 8. A zoom on the CH4, H2O, O3and temperature measurements achieved in the TTL for the SF4 (in red) and SF2 (in blue) flights. The PV predicted by MIMOSA is also added on the figure. Both the potential temperature and altitude vertical scales are indicated.
ACPD
6, 12469–12501, 2006 In situ measurements of H2O in the TTL during HIBISCUS G. Durry et al. Title Page Abstract Introduction Conclusions References Tables Figures ◭ ◮ ◭ ◮ Back CloseFull Screen / Esc
Printer-friendly Version Interactive Discussion
50 cm
Open cell
Fig. 9. The H2O profiles obtained during HIBISCUS (in red and blue) superimposed to previous mid-latitudes H2O determinations from the SDLA and the ELHYSA hygrometers. See text for more details.