HAL Id: tel-00593573
https://tel.archives-ouvertes.fr/tel-00593573
Submitted on 16 May 2011HAL is a multi-disciplinary open access archive for the deposit and dissemination of sci-entific research documents, whether they are pub-lished or not. The documents may come from teaching and research institutions in France or abroad, or from public or private research centers.
L’archive ouverte pluridisciplinaire HAL, est destinée au dépôt et à la diffusion de documents scientifiques de niveau recherche, publiés ou non, émanant des établissements d’enseignement et de recherche français ou étrangers, des laboratoires publics ou privés.
Programming Sustainable Development in a Developing
Country: A Social Optimization of the Vietnamese
Power Sector A
Nhan Thanh Nguyen
To cite this version:
Nhan Thanh Nguyen. Programming Sustainable Development in a Developing Country: A Social Optimization of the Vietnamese Power Sector A. Economics and Finance. Ecole des Hautes Etudes en Sciences Sociales (EHESS), 2011. English. �tel-00593573�
L’Ecole Des Hautes Etudes En Sciences Sociales (EHESS)
Centre International de Recherche sur l’Environnement et le Développement (CIRED)
Programming Sustainable Development in a Developing Country:
A Social Optimization of the Vietnamese Power Sector
A Dissertation submitted to the School of EHESS in fulfilment of the requirements for the degree of Doctor of Philosophy in Energy and Environmental Economics
by
Nhan Thanh NGUYEN
The PhD thesis defense was implemented in CIRED on 30 March 2011. The PhD thesis committee members include:
Khanh Toan PHAM, Director of Institute of Energy, Ha Noi, Vietnam (Reporter) Michael MEHLING, President of Ecologic Institute, Washington DC, USA (Reporter)
Jean-Charles HOURCADE, Directeur du CIRED, Directeur de Recherche CNRS, Directeur d’Etudes EHESS, France (examiner)
Patrick CRIQUI, Directeur du LEPII Grenoble, Directeur de Recherche CNRS, France (examiner)
Minh HA-DUONG, Directeur de Recherche CNRS, France (Advisor of the research thesis)
i
To my son: Hieu An Nguyen (Bi)
I wish to dedicate my beloved son, Hieu An, all the words within this dissertation. A number of words I wrote down are as much as the love, the nostalgia, and the torment that I have felt about him during the past 3 years.
ii
Acknowledgements
My thesis advisor, Minh Ha-Duong, deserves my first words of sincere gratitude. I have benefited enormously not only from the depth of his knowledge but also his critical eye that all has steadily but surely made me into a better researcher. I also owe an enormous debt of thanks to my advisor. I had strong wishes entering the International de Recherche sur l’Environnement et le Developpement (CIRED), and Minh has exceeded them.
I would like to thank my committee members: Khanh Toan Pham (Institute of Energy, Vietnam), Michael Mehling (Ecologic Institute, Washington DC), Jean-Charles Hourcade (EHESS/CIRED), Patrick Criqui (LEPII Grenoble) for their thoughtful input and consistent encouragement.
Grateful acknowledgement is also due to Dominique Finon (CIRED/LARSEN) for his valuable discussion, criticism and correction to improve the dissertation. I am similarly grateful to Daniel Thery (CIRED) for his dedicated review and correction to enhance the quality of writing work. Thanks are due to all members and friends in CIRED. Specially, I express sincere thanks to Daniel Thery, Naceur Chaabane, and Eléonore Tyma for their administrative help and valuable encouragement over the past three years. Thanks are also addressed to Hoang Anh (Flensburg University, Germany) for his research assistance during his internship period in CIRED. I am also in debt to close friends in Vietnam: Mr. Minh Khoa Tran (Institute of Energy), Mrs. Huong Giang Pham (MOIT), Ngoc Tuyen Phan (Institute of Energy), and Minh Quoc Binh Phan (PetroVietnam) for their helpful support and data related to the issues in my research study. This research was made possible from a three-year Ph.D research grant offered by the Centre National de la Recherche Scientifique (CNRS) of France. I also wish to thank the CTSC Chair of l’Ecole des Mines, France for providing me additional grant to perform a special study on the issue of Carbon Capture and Storage as a major part of this research thesis. Many thanks are due to the International de Recherche sur l’Environnement et le Developpement (CIRED), France for providing necessary facilities and administrative supports during the past 3 years.
I would also thank the family of Mr. Tuan Ha-Duong and Madame Françoise Pair for their kindly hosting me in Antony (France) since the first day of my arrival in France.
Most of all, I am deeply indebted to my parents, wife and son for their spiritual encouragement and moral support in the pursuit of my PhD study in CIRED. All their tender love and understanding are invaluable. Exceptionally, I express my sincere thanks to my borther in law, Mr. Chi Vy Tran (Royal Haskoning Company), and my older sister, Mrs. Kim Nhung Nguyen (PetroVietnam), for their inexhaustible help and support on data collection and computer science. Finally, I wish to dedicate this work to my beloved son, Hieu An Nguyen (Bi), who has starved for daily care from his father since the past three years.
iii
Table of Content
General introduction ... 1
Chapter 1. Socio-economic development and energy system situation in Vietnam ... 5
1.1 Socio-economic development and energy system situation ... 5
1.1.1 Socio-economic development situation ... 5
1.1.2 The energy system and its development prospects ... 8
1.2 Overview of the power sector development and its challenges ... 12
1.2.1 The current unsustainable situation of power sector ... 12
1.2.2 Power sector in the next 30 years: the baseline scenario ... 17
Part A: Programming sustainable development options for Vietnam’s power sector ... 26
Chapter 2. Energy efficiency: the best energy option to reduce any potential vulnerability .. 27
2.1 Introduction of Chapter 2 ... 27
2.2 The importance of energy efficiency: a comparative and vulnerability analysis ... 27
2.2.1 The increasing power intensity: a comparative analysis ... 27
2.2.2 Why promote energy efficiency: a vulnerability approach ... 30
2.3 Economic potential for demand-side management in the household sector ... 44
2.3.1 Integrating the DSM into the IRP simulation model ... 44
2.3.2 The DSM in the household sector: the free lunch option ... 45
2.4 Concluding remarks ... 48
Chapter 3. Renewables can provide diverse energy supplies and environment preservation . 50 3.1 Introduction of Chapter 3 ... 50
3.2 National renewables resources: large but untapped technical potential ... 50
3.3 Economic potential of diverse renewables sources in power sector ... 59
3.3.1 Integrating renewables into the IRP simulation model ... 59
3.3.2 Improving energy security while protecting environment... 63
3.3.3 Cost and financing issues for deployment of renewables ... 67
3.4 Opportunities for renewables deployment with possible new climate regimes ... 71
3.4.1 Integrating renewables into the IRP with carbon prices and caps ... 71
3.4.2 Results of renewables deployment with carbon prices and caps ... 72
3.5 The important role of renewables for sustainable development in rural areas ... 77
3.5.1 The increasing use of electricity for rural development ... 77
3.5.2 Renewable energy: the key option for rural electricity use ... 78
3.6 Concluding remarks ... 79
Chapter 4. CO2 capture and storage: a promising climate instrument for CO2 mitigation ... 80
4.1 Introduction of Chapter 4 ... 80
4.2 CCS in Vietnam’s power sector: the economic potential ... 81
4.2.1 Explore the promising storage capacity ... 81
4.2.2 Integrating CCS options into the IRP model ... 84
4.2.3 Results: CCS enters after 2030 at CO2 values over $25 ... 91
4.3 The relevance of CCS as a climate policy instrument ... 96
iv
4.3.2 Renewables cheaper than CCS without EOR/ECBM ... 97
4.3.3 Domestic requirements for CCS initiatives ... 98
4.4 Concluding remarks ... 100
Chapter 5. Systhesis outline of the potential for CO2 mitigation with climate policies ... 101
5.1 Introduction of Chapter 5 ... 101
5.2 The technical potential for mitigation of CO2 emissions in the power sector ... 102
5.2.1 Renewable energy option: a potential 25% of CO2 emission abatement ... 102
5.2.2 Energy efficiency and renewables: most significant 34% CO2 abatement ... 102
5.2.3 Opportunities for CO2 mitigation projects with competitive abatement cost ... 103
5.3 How efficient climate policies affect the power sector’s carbon emission reduction? . 104 5.4 Concluding remarks ... 105
Part B: How to practically promote sustainable development for Vietnam’s power sector? ... 107
Chapter 6. Strategies for promoting the wider deployment of sustainable energy options .. 108
6.1 Introduction of Chapter 6 ... 108
6.2 Barriers and policies to the adoption of sustainable development options ... 108
6.2.1 The study approach ... 108
6.2.2 Barriers to geothermal and small hydroelectric power generation ... 111
6.2.3 Barriers to cleaner energy-efficient coal-fired power generation ... 116
6.3 Regulatory mechanisms for promoting sustainable development options ... 117
6.3.1 Price-based mechanism ... 118
6.3.2 Quantity-based mechanism ... 120
6.3.3 The choice of suitable central supportive instrument for Vietnam ... 121
6.4 Structural, regulatory and market reforms for the sustainable power sector ... 125
6.4.1 The needs for restructuring and competition of power sector ... 125
6.4.2 Lessons learned from international power sector reform ... 126
6.5 Concluding remarks ... 129
Chapter 7. Access to feasible finance sources and the Clean Development Mechanism ... 131
7.1 Introduction of Chapter 7 ... 131
7.2 Fiscal measures and funding facilities ... 131
7.2.1 Fiscal instruments and surcharges ... 131
7.2.2 Vietnam environmental protection fund ... 132
7.2.3 The global environment facility ... 132
7.3 The Clean Development Mechanism (CDM)... 133
7.3.1 Vietnam and the CDM, a late start ... 135
7.3.2 Why has CDM in Vietnam not been more intense? A barrier analysis ... 140
7.3.3 Improving the CDM post-2012: a developing country perspective ... 152
7.4 Concluding remarks ... 161
Chapter 8. General Conclusions ... 163
Annex... 169
Bibliography ... 180
Lists of Figures and Tables ... 198
0
1
General introduction
Vietnam is confronted to the challenges of sustainable development in its three dimensions: balanced economic development, equity in its social development and environmental protection. In fuelling the economic and demographic growth in Vietnam, energy has a critical role to guarantee this sustainable development. Over the last decades, a number of reforms in the central planning economy have led Vietnam to faster economic growth with annual rates of 7-8%. The demand for electricity has increased twice as fast as the Gross Domestic Product (GDP) during the same period, and annual growth rates of about 17% has been predicted for the electricity demand for the period from 2010 to 2030 (Institute of Energy, 2009). However, the development of energy for fulfilling material needs to the economy growth has also been accompanied by a number of challenges.
Economically, there arises changes in primary energy resource base thereby the increasing reliance on energy supplies from aboard is foreseen for the years to come (Institute of Energy, 2009; World Bank, 2010a). Although the availability of indigenous primary energy resources is not going to be an immediate threat to the security of energy supply, a question arisen is that can Vietnam afford to allow the current patterns of energy production and consumption to continue in the context of uncertain fossil fuels prices at global level? According to World Bank (2010a), the expected development of electricity production using large-scale coal and electricity imports, and increase in international oil prices will only make energy costs rising to Vietnam’s consumers and could lead the power sector to potential vulnerability of international energy price fluctuations. Such volatile energy costs in the power sector could further contribute to increased poverty, political pressures, and instability. Changing these unsustainable patterns is, thus, the major challenge for the Vietnamese power sector.
Financially, the energy infrastructure development in Vietnam in particular in electricity distribution and commercial fuel supply lags the demand growth due to a major barrier of insufficient access to financing sources (MOIT-JICA, 2008; World Bank, 2010b). In practice, the electricity price is administered in Vietnam and policy makers lean toward controlling the price at a level moderate enough to enable the domestic products to be competitive in the global market. Besides, the fuel and electricity prices tend to be widely subsidized, creating large deficit in the public companies. This low and inadequate electricity pricing scheme makes it less attractive to investors to lay down their funds for electricity supply projects. Moreover, global economic downturn also slows down new investment in energy as it is the largest capital-intensive sector. Thus, the country is extremely facing the pressure on obtaining the necessary finance for the request of expanding the electricity generation industry while government resources should be also requested for investment in other socioeconomic areas. Technologically, increasing supply efficiency and passing efficiency gains to consumers has been always a real technical challenge in Vietnam. The energy supply loss, within the power sector, was about 10.8% in 2010 (NLDC, 2010a). Very high energy intensity suggests also that inefficient energy use, in terms of energy technology and behaviour, should exist within the
2
given absence of price incentive. This contributes to the rapid but uncertain increase in electricity demand and affects the stability of the supply system. As a consequence, the chronic problems of power shortages and poor security of electric power supply often occur hampering the economy and daily life of Vietnamese people, especially the medium- and low-income people and people in rural areas.
Socially, there exist three basic features related to sustainable electricity supply goals: accessibility, affordability, and acceptability. Particularly for rural areas, the electrification aims to bring people to modern health and education services, poverty alleviation and gender equality. In fact, though Vietnam has achieved significant electrification rates in recent years, the access to electricity and modern services is still limited in many rural places, even impossible for people living in mountainous and very-remote areas. Besides, some rural areas have grid-connected systems, but people still suffer many handicaps and hardly affordable to access because: the local electricity grids are very poor and very unreliable, expensive costs of connecting grids, electricity tariff somewhere is higher than that in urban areas due to very poor system management locally and high power loss. Given a high economic growth, the power sector is likely to expand based on large-scale coal fuel in the years to come. Yet increasing the use of fossil fuels to meet growing worldwide demand for electricity, especially in developing countries, goes against the need to prevent dangerous climate change globally, by which Viet Nam is estimated as one of the most vulnerable countries to global warming. Moreover, Vietnam's geography makes it one of the most disaster-prone countries in the world, suffering from typhoons and tropical storms, floods, drought, and landslides. An inappropriate exploitation of hydropower resource for expanding the electricity supply industry may also become environmentally and socially unsustainable such as: deteriorating the watershed forests, causing effects on biodiversity and ecosystems, increasing floods, etc. Environmentally, rapid economic growth based on heavy use of fossil fuels along with the expansion of power sector over the last decade is responsible for an alarming increase of air pollution and deterioration of local air quality in Ha Noi and Ho Chi Minh cities. For example, air pollution brought about 22% of chronic pneumonia cases and one-third of respiratory inflammations in Vietnam from 2001 to 2003 (Cofala et al., 2004; USAID, 2007; IEA, 2010a). In terms of increasing CO2 emission inventory, we estimate a large amount of
7.2 Gt of CO2 cumulative emissions would be emitted by the power sector from 2010 to 2040
because of the dependence on burning coal fuel. This figure is about 70 times larger than the total 103 Mt of CO2 emissions emitted from fossil fuels combustion in Vietnam in 2008 (IEA,
2010b). Moreover, the sector could become a large emitter of local pollutants, with cumulative emissions of up to 15 Mt of SO2 and 8 Mt of NOX over the same period. These
figures are 80 folds larger than the 128.2 Kt of SO2 and 102 Kt of NOX emitted by the sector
in 2006 (Nguyen and Ha-Duong, 2009).
Structurally, like most parts of the developing world, the Vietnamese power sector still be of the structure of vertically integrated (quasi-) monopolist and state entities keep a central role
3
in the sector. Given the increasing pressure on the current unstable situation of the power sector and its poor performance, the need of sector reform is recognized by Vietnamese Government and becomes an imperative action in order to attract a broader cluster of participants to invest in the sector, improve its performance in terms of quantity and quality to support economic growth, while ensuring reasonable and fair costs to consumers, and efficiency. However, how to implement the reform effectively so that it could achieve the desired outcomes and be adequate to the specific circumstances of the country still exists as a practical challenge.
Today, a strategy for sustainable energy development is set up with the four lines of business: direct poverty alleviation, macroeconomic equilibrium governance and private sector development, and environmental sustainability (World Bank, 2009a). In fact, these goals are not new, but circumstances change: we have to consider urgently the climate change-related challenges and look for opportunities of increased sustainable development in conjunction with international carbon emission mitigation.
But the right moment has come for Vietnamese Government to review the past progress of the development road and have stronger and proper policies towards future sustainability. Specially, the issues of energy development related to sustainable future should be taken a larger part in the development agenda of Vietnamese policy decision-makers.
The objectives of the dissertation: The kernel of this dissertation aims to exploit by optimisation methods and empirical studies the issues of sustainable development in the Vietnamese power sector for the next thirty years. It then examines the ways to implement sustainable energy options for the power sector in practice. To accomplish these two objectives, the study focuses on different, but related, issues with these two methodologies: (i) In the first part, we develop the bottom-up Integrated Resource Planning (IRP) model
to provide a more exhaustive assessment of the current state and future prospects for the Vietnamese power sector in next three decades. Then, using a comparative analysis and a vulnerability analysis that is based on the IRP simulation, we analyze energy-development-related vulnerabilities that the sector could face, in terms of economic and socio-environmental dimensions. We further develop the IRP model, in such a way representing realistically the marginal abatement costs of carbon emission reduction by considering non-zero carbon values and carbon emission constraints, in order to simulate sustainable energy supply options for the power sector.
(ii) In the second part, we study the major barriers against the wider adoption of sustainable energy development options in practice by using analytical hierarchy process-based formal surveys among national experts. Then, we use an empirical analysis approach to examine different appropriate policy means including incentive instruments/schemes and sector reform for such sustainability of the power sector. To the end, we analyze the access to feasible financing sources for sustainable development in the Vietnamese power sector.
4
In electricity industry, utility planners often use simulation and optimization tools to address the dynamic process of electricity energy planning according to changing conditions. To response to increasing concerns about energy supply costs, the environment degradation, and related risks, the traditional electricity energy planning has been redesigned thereby planners have moved towards the so-called integrated resource planning (IRP). Today, in spite of the increasing irrelevance of the IRP in many developed countries, where one exploits the efficiency of private sector, and other viable and potentially valuable resources that may further reduce the costs, and relieves the debt-ridden public utility sector of financial burden for new investments, this is not the case in most parts of the developing world, especially in Asia where power sectors still remain the structure of vertically integrated (quasi-) monopolists with or without Independent Power Producers (IPPs) and state electric power utilities keep a central role in the sector. The principles of the IRP still remain a valuable tool for power sectors to address their existing problems and ongoing reforms. The present study develops the bottom-up IRP model using the principles of the integrated resource planning. This model uses mixed-integer linear programming (MILP) to compute a lowest-cost electricity generation capacity expansion plan. Specifically, the IRP model is used to simulate programming sustainable development options for the Vietnamese power sector and analyze potential vulnerability that the sector could face under the current energy development policy. These sustainable energy options include energy efficiency improvements, renewable energy (renewables), and carbon capture and storage (CCS).
The organisation of the dissertation: This dissertation is organized with the two major parts: namely A and B. The introductive chapter 1 explains the main issues of sustainable development related to the energy system situation in Vietnam. In follows, the Part A examines successively three technological options possibly contributing to a more sustainable development. Chapter 2 discusses about energy efficiency improvements including demand-side management (DSM). Chapter 3 is about renewable energy (renewables), and chapter 4 about carbon capture and storage (CCS). Chapter 5 provides the overall technical potential for CO2 mitigation in Vietnam’s power sector with carbon caps and carbon prices using the IRP
simulation. The Part B takes a more holistic stance to address three pragmatic issues. Chapter 6 analyses the social barriers to the adoption of renewables and higher efficient coal-based generation technologies, based on a domestic expert survey. Then, it analyses different appropriate policy means including incentive instruments/schemes and sector reform for solving the major barriers towards a sustainable development for the sector. Chapter 7 discusses financing for sustainable energy development in the Vietnamese power sector. To the end of the dissertation, the Chapter 8 summarizes and concludes. The electronic supplements are also annexed to the dissertation. They include a details presentation of the IRP model and its parameters, and copies of the published articles/chapters.
5
Chapter 1. Socio-economic development and energy system situation in Vietnam 1.1 Socio-economic development and energy system situation
1.1.1 Socio-economic development situation Geographical and social features
Figure 1-1: Vietnam lies in the center of South East Asia.
Located in the region of South East Asia, Vietnam owns a long coastline of over 3,200 km, and approximately 331,212 km2 area. The country borders with China in the North, Laos PDR in the West, and Cambodia in the South (Figure 1-1).
Vietnam experiences typical tropical monsoon climate in the Southern part with two seasons: rain season (from May to September), and dry season (October to April) while the Northern has monsoon climate with four distinct seasons: spring, summer, fall, and winter.
Source: Khanh Toan, P., (2010).
Vietnam is ranked as the thirteenth most populous country in the world. By 2010, Vietnam’s population is over 88 million, growing about 1.3% annually over 2000-2009. The population density grew at 1.7% per annum (199 capita/km2 in 1990 and 263 capita/km2 in 2009). The fraction of the urban population was 19.5% in 1990. This rose faster to 24% and 29% for the following years 2000 and 2009, respectively (VGSO, 2010). The growth rate in urban population implies a fast urbanization an on-going industrialization process in Vietnam.
Historical economic growth
Vietnam has experienced remarkable economic development since 1986 through the performance of the reform policy "Doi Moi", implementing several plans of socio-economic development. Over the period 1990-2009, Vietnam’s economy achieved a rapid Gross Domestic Product (GDP) growth with an average increasing rate of 8% (Figure 1-2). However, in term of nominal GDP and nominal GDP/capita, Vietnam still lies at low-income level by 2009. In 2009 Vietnam achieved US$ 1,060/capita, being positioned in the late developing group of ASEAN and behind other neighbours such as Indonesia, Thailand, Malaysia, Singapore, Philippine, etc (IMF, 2010).
6
Figure 1-2: The historical fast growth of GDP in Vietnam over the period 1990-2009.
Source: IMF (2010) and VGSO (2010).
As an exporting country of agricultural products, Vietnam is currently the second biggest rice-exporter in the world. The revenue from exporting other principal agricultural products (coffee, cashews, maize, pepper/spice, sweet potato, pork, peanut, cotton, fresh vegetables & fruit, rubber, etc.), plus extensive aquaculture of both fish and shellfish species also gives significant contribution to the national GDP. The agricultural sector has contributed over 20% of the country’s GDP during the last two decades. In apparel with economic growth and global integration, Vietnam’s economy structure has gradually moved forward industrialization and urbanization (Figure 1-3). Since 2000, the fraction of the country’s GDP accounted by agricultural sector has continuously reduced from 24.5% in 2000 to 20.3% in 2007 whilst GDP share of industrial sector has increased from 36.7% to 41.6% over the same period.
Figure 1-3: Sectoral shares of the national Gross Domestic Product over 1990-2009.
Source: VGSO (2010). 0 500 1000 1500 2000 0 20 40 60 80 100 1990 1995 2000 2001 2002 2003 2004 2005 2006 2007 2008 2009 B il li o n U S $
GDP (billion US$, current prices) GDP (thousand billion VND, current prices) GDP using PPP (billion US$, current US$) GDP per capita (US$/capita, current prices)
0% 10% 20% 30% 40% 50% 60% 70% 80% 90% 100% 1990 1992 1994 1996 1998 2000 2002 2004 2006 2008 Agriculture Industry Service
7 Expected future economic growth
There are 3 scenarios of economic growth predicted for the next 30 years. The forecast is built-up built-upon the following key parameters: (i) economic-development scenarios and modes of other countries locating in the area of active-economic-development nations including South Korea, Taiwan, and China; (ii) factors that mainly affect economic growth including attract-ability of foreign investment inflows such as Foreign Direct Investment (FDI), Oversea Development Assistance (ODA) source, impacts of technology innovation, deflation of GDP, basic hypotheses of economic growth, etc. (Institute of Energy, 2009).
As a result of the forecast, Vietnam would become an industrialized country, in a low economic development scenario, by 2020, in which the country’s GDP growth rate of 6.2% reached over 2006-2010 yet, expected to increase up 7.0% over 2010-2020, remaining 7.0% over 2020-2030, and gradually decreasing to 6.5% over 2030-2040. However, even this scenario of low economic growth seems optimistic and challenging to achieve in the current context of global economic crisis. Table 1-1 presents the prospects of economic development in Vietnam for the next 30 years under different conditions predicted by Vietnamese agencies. Table 1-1: Scenarios of future economic growth predicted by Vietnamese agencies
Economy growth (%) predicted in a high growth scenario
No. Sector 2006-2010 2011-2020 2021-2030 2031-2040
1 Industry&Construction 11 10 8.5 7.0
2 Agriculture 3.5 3.0 2.5 2.0
3 Service 8.0 8.4 8.3 7.5
4 Total GDP growth (%) 8.5 8.5 8.0 7.0
Sectoral shares of GDP predicted in a high growth scenario
No. Sector 2010 2020 2030 2040
1 Industry&Construction 45.0 50.1 51.1 49.7
2 Agriculture 17.1 10.8 6.9 4.6
3 Service 37.9 39.0 42.0 45.8
Economy growth (%) predicted in an average growth scenario
No. Sector 2006-2010 2011-2020 2021-2030 2031-2040 1 Industry&Construction 10.0 8.2 7.5 6.5
2 Agriculture 3.0 3.0 2.5 2.0
3 Service 7.2 7.3 7.3 7.1
4 Total GDP growth (%) 7.6 7.2 7.0 6.5
Sectoral shares of GDP predicted in an average growth scenario
No. Sector 2010 2020 2030 2040
1 Industry&Construction 44.7 47.8 48.7 47.3
2 Agriculture 17.3 12.5 8.7 6.0
3 Service 38.0 39.7 42.6 46.7
Economy growth (%) predicted in a low growth scenario
No. Sector 2006-2010 2011-2020 2021-2030 2031-2040
8
2 Agriculture 3.5 3.0 2.5 2.0
3 Service 5.5 6.5 6.0 6.5
4 Total GDP growth (%) 6.2 7.0 7.0 6.5
Sectoral shares of GDP predicted in a low growth scenario
No. Sector 2010 2020 2030 2040
1 Industry&Construction 43.6 48.9 55.0 56.5
2 Agriculture 19.0 13.9 9.8 6.8
3 Service 37.4 37.1 35.2 36.7
Source: Institute of Energy (2009)
1.1.2 The energy system and its development prospects Energy demand grew very fast over the last two decades
Energy has contributed largely to the Vietnamese recent industrialization and export earnings. To sustain the country’s economic development over the last two decades, the demand for energy has been extremely growing, even grew faster than the growth of GDP.
The total final energy consumption was about 16.76 Mtoe in 1990, and increased by 143% to 40.75 Mtoe in year 2007. The share of coal fuel doubled over the same period, from 7.9% in 1990 to 14.9% in 2007, while the share of electricity consumption soared from 3.2% in 1990 to 12.9% in 2007 (Figure 1-4 ).
Figure 1-4: Final energy consumption mix by fuel types in Vietnam over 1990-2007.
Source: Institute of Energy (2009); VGSO (2010).
In the energy consumption mix by sectors over 1990-2007 as showed in the Figure 1-5, the energy consumption share of transport and industry sectors increased quicker than that of the residential sector while those of agriculture and trade-service sectors have not much changed.
0 500000 1000000 1500000 0 10 20 30 40 50 1990 1995 2000 2001 2002 2003 2004 2005 2006 2007 M to e
Non-commercial Gasoline and Oil
Coal Electricity
9
Figure 1-5: Final energy consumption by sectors in Vietnam over 1990-2007.
Source: Institute of Energy (2009).
As a still-low income developing country, Vietnam is ranked among the regional countries with low-level of energy production and energy consumption per capita (Figure 1-6). By the end of 2007, the final energy consumption per-capita reached at 0.66 (ktoe/capita). Table 1-2 further provides some typical energy-economy indicators in Vietnam from 1990 to 2007. Figure 1-6: List of selected Asian countries by final energy consumption per capita, 2007.
Source: the author’s own combination from World Bank Database (2010).
Table 1-2: Energy-economy indicators in Vietnam during the period from 1990 to 2007.
Indicators 1990 2000 2007
GDP (US$2008) per capita 283 504 835
Commercial energy consumption (KgOE/capita) 66 156 304 Energy intensity (TOE/mill. US$2008) 330 402 600 1990-2000 2000-2007
Energy elasticity factor 1.43 1.48
Source: the author’s own combination from Institute of Energy (2009); IMF (2010). 0 10 20 30 40 50 1990 1995 2000 2001 2002 2003 2004 2005 2006 2007 M to e
Households Industry Transport Commerce-service Agriculture
1.5 0.85 0.16 2.7 0.46 1.6 0.66 0 0.5 1 1.5 2 2.5 3 0 5000 10000 15000 to e p e r ca p it a
US$ per capita
Cambodia China India Indonesia Bangladesh Malaysia Philippines Sri Lanka Thailand Vietnam
10
Energy supply resources were also increasingly explored
Vietnam has speeded-up the exploitation of national primary energy resources for economic growth. As we can observe in the Figure 1-7, the non-commercial energy1 is kept stable all along the period 1990-2007 but its share in the total primary energy supply in the system abruptly decreased from 63.5 % in 1990 to 29.6 % in 2007. Coal fuel has increased its share from 11.3 % in 1990 to 19.4 % in 2007 whereas the share of gas increased continuously from 0.04 % in 1990 to 11.9 % in 2007. This highlights the development progress of gas industry in Vietnam since early 1990s, becoming a large-scale industry now. With 76% of population living in rural areas by 2007, the non-commercial energy has taken a large share in total energy demand in Vietnam, in which biomass energy accounts for 99% of the total non-commercial energy whilst only a very small contribution from other renewables. However, the share of non-commercial energy consumption trends to fall plainly from 74.1% in 1990 to 36.4% in 2007 indicating the urbanization and industrialization progress since early 1990s.
Figure 1-7: Primary energy supply by fuel types in Vietnam over the period 1990-2007.
Source: Institute of Energy (2009).
Future outlook and challenges of Vietnamese energy system
To support future the economic development, Vietnamese energy system is likely to be facing the challenge of energy security. There are many national/international reports estimating that Vietnam is foreseen to be dependent on energy/fuel imports for economic growth. Institute of Energy (2009) showed that to sustain an expected average economic growth as indicated in the Table 1-1, Vietnam could soon become a country of energy-scarcity. The need for total final energy consumption in Vietnam could achieve about 48 Mtoe in 2010, increasing to 141 Mtoe
1
Non-commercial energy, in this study, includes from wood, wood charcoal, agricultural residues (biomass), new and renewable energy such as solar, wind, geothermal, hydro power, etc. The meaning of “non-commercial” is that these types of energy were exploited, processed then consumed locally without any trading activities involved. These did not contribute to the gross domestic products of the economy.
0 10 20 30 40 50 60 1990 1995 2000 2001 2002 2003 2004 2005 2006 2007 M to e
by 2030. By this expectation of economy g
consumption is expected to increase extremely over 2010
Figure 1-8: Projection of future final energy demand in Vietnam over
Source: Institute of Energy (2009).
To meet the projected demand for energy in the next 20 year supply is drawn out as the Figure 1
energy resources (oil, coal and gas) been turning from green to yellow. fuelling the future economy growth (MOIT
proper policies need to be employed by Vietnamese
development could be sufficiently fuelled for the forthcoming period of energy Figure 1-9: Situation of energy
Source: Institute of Energy (2009). 0 50 100 150 2010 2015 M to e Coal (Mtoe) Gas (Mtoe)
Non-Commercial energy (Mtoe)
11
by 2030. By this expectation of economy growth, the average growth rate of final energy consumption is expected to increase extremely over 2010-2015 by 7.85% (Figure 1
: Projection of future final energy demand in Vietnam over 2010-2030.
Source: Institute of Energy (2009).
the projected demand for energy in the next 20 years, the outlook of primary energy as the Figure 1-9. Though, Vietnam is endowed with diverse fossil
coal and gas) the signal on increased uses of indigenous turning from green to yellow. Thus, fuels and energy imports would be
economy growth (MOIT-JICA, 2008; Institute of Energy, 2009) er policies need to be employed by Vietnamese Government so that the country’s development could be sufficiently fuelled for the forthcoming period of
energy-energy supply system and demand balance in next 20 years
Source: Institute of Energy (2009).
2015 2020 2025 2030
Coal (Mtoe) Gasoline and oil (Mtoe) Electricity (Mtoe) Commercial energy (Mtoe) Growth rate (%)
rowth, the average growth rate of final energy 2015 by 7.85% (Figure 1-8).
2030.
, the outlook of primary energy Though, Vietnam is endowed with diverse fossil-fuel of indigenous fossil-fuels has would be needed for JICA, 2008; Institute of Energy, 2009). Therefore, so that the country’s economic
-scarcity. in next 20 years 0 2 4 6 8 10 %
12
1.2 Overview of the power sector development and its challenges 1.2.1 The current unsustainable situation of power sector The Electricity of Vietnam
The electric power sector is a growing market and represents one of the most promising areas for domestic and foreign service prospects in Vietnam. Currently Electricity of Vietnam (EVN), a state-owned utility established in 1995 with more than 50 subsidiaries under the Ministry of Trade and Industry (MOIT), is the established leader in electricity generation and still holds a monopoly in transmission and distribution for electricity.
Power demand and supply system
Electricity consumption in Vietnam grew at 14.9% annually over 1996-2000 and at 15% over 2000-2009, that is 2.14 faster than the GDP which grew at 7.2% over 1996-2009 (Figure 1-10). This results in a very high power intensity of the GDP at 2.14. The share of households in total electricity consumption has decreased from 49% in 2000 to 40.9% in 2007, while that of the industry sector increased from 40.6% to 49.9% (Table 1-3). The electricity consumption per capita also increased from 289 kWh/capita/yr in 2000 to 718 kWh/capita/yr in 2007 (Institute of Energy, 2009; World Bank, 2010c).
Figure 1-10: Electricity demand grew double faster than GDP growth, 1996-2000.
Source: ADB (2007); World Bank (2010c); Institute of Energy (2009); IMF (2010). Table 1-3: Structure of electricity consumption in Vietnam, 1990-2007, (TWh).
No. Sector 1990 2000 2001 2002 2003 2004 2005 2006 2007 1 Industry 2.85 9.1 10.4 12.7 15.2 17.9 21.3 24.3 29.2 Share (%) 46 40.6 40.4 42.0 42.0 45.0 47.0 47.4 49.9 2 Agriculture 0.6 0.43 0.48 0.51 0.56 0.55 0.57 0.56 0.57 Share (%) 9.5 1.9 1.9 1.7 1.7 1.4 1.3 1.1 0.9 3 Residential 2.04 11 12.7 14.3 16 17.7 19.8 22.1 23.9 Share (%) 32.9 49.0 49.1 47.4 47.4 44.6 43.4 42.9 40.9 0% 5% 10% 15% 20% 25% 1996 1998 2000 2002 2004 2006 2008
13
No. Sector 1990 2000 2001 2002 2003 2004 2005 2006 2007
4 Non-industry 0.72 1.9 2.23 2.71 3.1 3.5 3.9 4.43 4.77 Share (%) 11.6 8.5 8.6 9.0 9.0 8.8 8.5 8.6 8.0 5 Electricity sales 6.2 22.4 25.9 30.2 34.8 39.6 45.6 51.3 58.4 6 Electricity per capital
(kWh/capita/yr) 93 289 338 382 435 478 567 640 718 7 Self-consumption and
T&D losses (%) 25.4 15.3 15.1 15.0 14.1 14.3 13.2 12.9 12.5
1990-2000 2000-2007
8 Electricity elasticity factor 1.8 2.0
Source: Institute of Energy (2009).
Looking at the power intensity of Vietnam’s economy, it grew very fast during the period 1990-2009, starting from 330 MWh/million US$ of GDP in 1990, increased to 574 MWh/million US$ in 2000, and reaching 941 MWh/million US$ of GDP in 2009 (all GDP based on 2008 price). Compared to other economies in the region, Vietnam has become high intensive power economy, especially since 2005 (Figure 1-11). This indicates that the usage of electricity energy in Vietnam’s economy recently is less effective than that of other countries in the region and large wasteful energy in uses should exist within the country.
Figure 1-11: Comparative analysis of power intensity in selected Asian countries, 1990-2010.
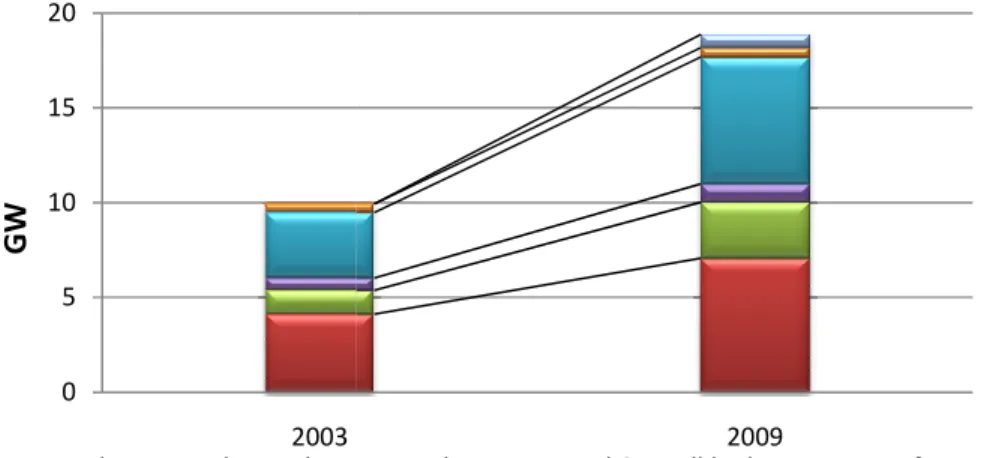
Source: author’s own combination from Institute of Energy (2010); IEEJ (2010); ERIA (2010). Now, let’s have a glance at the electricity supply system in Vietnam. At the end of 2009, the total energy capacity installed was 18.9 GW, in which EVN facilities accounted for about 71.9%. Compared to the system in 2003, this is double larger resulting from an average annual growth in energy capacity by 14.2% between 2003 and 2009 (Figure 1-12). More particularly, the present system consists of 37.5% of hydro, 35.4% of gas-fired, 15.7% of coal-fired, 5.1% of oil-fired, 3.7% of electricity imported, and 2.6% from small hydro and
0 200 400 600 800 1000 1200 1400 1990 1995 2000 2005 2010 M W h /M il l. U S D -2 0 0 8
diesel plants (NLDC, 2010a, 2010b contribution but it is foreseen
In energy production, the generation of electricity approximate 85 TWh in 2009, representing
period. In 2009, 34.4% of the sector’s total production was provided from hydro generation sources (including a small fraction of small hydro energy), 43.2% from gas
14.4% from coal-fired, 4.7% from electricity imported, and only 3.2% from oil
Electricity generation from diesel plants was thus negligible. Overall, the current electricity generation contributed from renewables (mainly from small hydro) is still very small, only around 1.5% of the sector’s total electricity production.
of electricity supplied from thermal generation grew very fast from 1996 to 2009 with an average growth rate of 27.7%, nearly twice the average annual growth rate of the total electricity generation during the same
Figure 1-12: The generation capacity in Vietnam is doubled growth of 14.2% per annum.
Source: NLDC (2010a).
Electricity system losses and the
The Vietnamese electricity transmission network comprises of three high including 500kV, 220kV and 110kV. By the end of 2005, the 500kV double infrastructure has been extended to more than 3,000 km con
loads in the North and South of Vietnam. The 220kV transmission system includes 5,257 km of lines and the 110kV network has 10,290 km of lines. The current distribution network consists of five medium voltage levels 6
level is mainly used for the urban areas and 35kV level used for the rural areas (Electricity of Vietnam, 2007a; Khanh Toan, P., et al
0 5 10 15 20 2003 G W
Hydro Coal Oil
14
, 2010b). At this time, coal-fired capacity has a relative modest contribution but it is foreseen to take an increasing important role in the system after 2015
generation of electricity increased from about 17 TWh in approximate 85 TWh in 2009, representing an annual average growth rate of 14%
In 2009, 34.4% of the sector’s total production was provided from hydro generation sources (including a small fraction of small hydro energy), 43.2% from
gas-fired, 4.7% from electricity imported, and only 3.2% from oil
Electricity generation from diesel plants was thus negligible. Overall, the current electricity generation contributed from renewables (mainly from small hydro) is still very small, only around 1.5% of the sector’s total electricity production. It must be stressed that the production of electricity supplied from thermal generation grew very fast from 1996 to 2009 with an average growth rate of 27.7%, nearly twice the average annual growth rate of the total electricity generation during the same period (NLDC, 2010a).
: The generation capacity in Vietnam is doubled over 2003-2009 with an average
losses and thermal generation efficiency
The Vietnamese electricity transmission network comprises of three high
including 500kV, 220kV and 110kV. By the end of 2005, the 500kV double-line transmission infrastructure has been extended to more than 3,000 km connecting between the two central loads in the North and South of Vietnam. The 220kV transmission system includes 5,257 km of lines and the 110kV network has 10,290 km of lines. The current distribution network consists of five medium voltage levels 6-10-15-22-35 kV existing together, in which the 22kV level is mainly used for the urban areas and 35kV level used for the rural areas (Electricity of
; Khanh Toan, P., et al., 2010).
2009
Gas turbine Diesel & small hydro Import from China
has a relative modest to take an increasing important role in the system after 2015.
7 TWh in 1996 to of 14% during the In 2009, 34.4% of the sector’s total production was provided from hydro generation -fired generation, fired, 4.7% from electricity imported, and only 3.2% from oil-fired source. Electricity generation from diesel plants was thus negligible. Overall, the current electricity generation contributed from renewables (mainly from small hydro) is still very small, only It must be stressed that the production of electricity supplied from thermal generation grew very fast from 1996 to 2009 with an average growth rate of 27.7%, nearly twice the average annual growth rate of the total
2009 with an average
The Vietnamese electricity transmission network comprises of three high-voltage levels line transmission necting between the two central loads in the North and South of Vietnam. The 220kV transmission system includes 5,257 km of lines and the 110kV network has 10,290 km of lines. The current distribution network 35 kV existing together, in which the 22kV level is mainly used for the urban areas and 35kV level used for the rural areas (Electricity of
15
The loss of electric power has been always a real challenge to the Vietnamese power sector. The loss including transmission and distribution was 25% of the total electricity production in the late 1980s and 21% in the early 1990s. However, the loss has been also remarkably reduced by 12% in 2005 and expected to decrease to 10.8% by 2010. Compared to the power loss in developed countries, this figure is still very high. Thus, Vietnamese Government is now planning to take technical and manageable measures to reduce the loss down to 7.5% by 2025 (Electricity of Vietnam, 2007a; Institute of Energy, 2009; NLDC, 2010b).
The average efficiency of coal-fired generation plants stands between 37 and 38%2. For oil and gas-fired plants, the average efficiencies are 30% and 48%, respectively. In fact, there exist some coal and oil-fired generation units having efficiency below 27% due to backward energy conversion technologies. These efficiencies are quite low, compared to the average efficiency performance (around 42%) of coal-fired generation system in the region of Asia such as Malaysia, Japan (World Bank, 2010d).
Power supply security
Power shortage and quality have been two very critical challenging problems to the sector. Since 2008 load shedding has been occurring frequent in Vietnam with deep power cut. In early 2010, the total installed capacity of generation power plants is 19 GW but the usable capacity should be smaller. Therefore, the system could not reliably satisfy the peak demand (about 18.5 GW). Over the first six months in 2010, the power shortage accounts for 5-7% of the total power demand (NLDC, 2010a) causing serious impacts on the economy and society. Customers, especially in rural areas, were the most vulnerable to the power cuts causing negative effects to their daily life and agricultural activities. The investment in energy development is always lower than required, progress of many projects is delayed, less diverse generation sources and high dependence on hydro power, poor maintenance schedules, and low energy efficiency of the sector are identified as the major reasons.
Electricity tariff and financial issues
According to a new circular No. 08/2010/TT-BCT issued by MOIT, the electricity tariff in 2010 has a weighted average price of 1,058 VND per kWh, it equals to 5.4 US cents per kWh3 (MOIT, 2010b). Though this price has been increased by 6.8% from 971 VND/kWh in 2009 but it is still far below than the price in neighbouring countries such as: Malaysia (7.6 US cents/kWh), Thailand (8.5 US cents/kWh), Singapore (13.5 US cents/kWh) (VietNamNet, 2010). It also notes here that the electricity tariff in Vietnam has even decreased during the period 1994-2010, in term of constant 1994 price (Figure 1-13 and Figure 1-14). In practice, the electricity price is administered in Vietnam and policy makers lean toward controlling the price at levels moderate enough to enable the domestic products to be
2
This is based on the author’s own calculation from the performances of the existing generation plants. 3
16
competitive in the global market. Besides, the energy prices including electricity still contain loss compensation and cross subsidies in the economy. This low and inadequate electricity pricing scheme leads to energy wasting usage and makes it less attractive to investors to lay down their funds for electricity supply projects.
Figure 1-13: Electricity prices in Vietnam over the period 1994-2010.
Source: Nguyen Duc Thanh et al., (2008); MOIT (2010a).
Figure 1-14: Electricity price in Vietnam is the lowest among regional countries
Source: Nguyen D. Thanh et al., (2008); MOIT (2010a). Rural electrification
Though Vietnam achieves a significant success in electrification, the country still faces challenges to improve access and affordability to electricity services for the poor in remote areas. In 2008, Vietnamese rural electrification rate was 94.5%, compared to a mere 14% in 1993 but mountainous and very-remote areas have still no access to electricity network (GTZ,
0 200 400 600 800 1000 1200 1994 1996 1998 2000 2002 2004 2006 2008 2010 V N D p e r k W h
Current price Contant prices (1994)
0 5 10 15 20 25 2000 2001 2002 2003 2004 2005 2006 2007 2008 U S c e n ts /k W h
Vietnam Malaysia Hongkong Indonesia Philippines Thailand Taiwan Japan
17
2009). In addition, rural electricity grids are very poor, very unreliable, and high losses (ITVN, 2010; World Bank, 2010d). Recent years, the Government has been implementing a number of policy measures for poverty reduction and hunger eradication, providing subsidy to rural electricity consumption. Nevertheless, the access to electricity services is still limited. This is partly due to high poverty rate and low income in the areas. In spite that rural electricity tariff is regulated by the Government, rural people still cannot afford to pay the real high price imposed, even 1.5 times higher than the regulated one in many places (San and Thanh, 2010), due to a very poor management system at local level (Figure 1-15).
Figure 1-15: The electricity distribution systems exist in rural areas.
Source: San and Thanh (2010).
1.2.2 Power sector in the next 30 years: the baseline scenario
The Vietnamese Government manages the development of the power sector using a Power Development Master Plan, which anticipates the need for electricity services and schedules the sector's overall development in a ten-year period, taking into account the following ten years period. According to the current sixth Power Development Master Plan (MP-VI), the electricity demand is projected to increase by 16.8% and 6.9% per annum in a low demand scenario over the period of 2010-2030 and 2030-2040 respectively, and by 21.4% and 8.2% per annum in a high demand scenario over the period of 2010-2030 and 2030-2040 respectively. Table 1-4 presents the projections of electricity demand for the next 30 years in Vietnam, by Vietnamese agencies. However, many Vietnamese energy experts argue against the agencies’ projections that they consider over-estimated even in the low scenario case (Pham D. Hien, 2009a; Nguyen Khac Nhan, 2009). All these implied a political will for the large-scale nuclear energy capacity development plan supported by the expected soaring demand of electricity for the next decades.
18
Table 1-4: Projected electricity demand in Vietnam, 2010-2040, by Vietnamese agencies.
Year
Low scenario Moderate scenario High scenario
Electricity (TWh) Peak demand (GW) Electricity (TWh) Peak demand (GW) Electricity (TWh) Peak demand (GW) 2010 91.95 18.51 97.11 18.51 101.15 20.37 2020 216.43 40.92 257.26 48.64 267.56 50.59 2030 417.02 76.91 537.83 100.97 556.50 104.48 2040 703.07 126.29 981.26 186.91 1015.31 193.40
Source: Electricity of Vietnam, 2007a and NLDC, 2010b.
With regards to the indigenous energy supply resources, they will become scarce after 2015. Recently, the Vietnamese Government has approved an optimistic plan to develop nuclear energy for meeting the increase of energy demand between 2020 and 2030. This plan consists of 15-16 GW in generation capacity. The first nuclear generator is planned to produce electricity in 2020 (GOV, 2010). However, there are many concerns and doubts from energy experts about such a large development plan considering the country’s current limitations in human resources, essential technical and regulatory infrastructures, financing resources, public acceptance, etc.
In follows, the study presents a more realistic overview and a more reliable assessment of the prospective evolution of Vietnamese power sector with attendant challenges, using the IRP simulation model.
1.2.2.1 Large capacity expansion changing the electricity generation mix
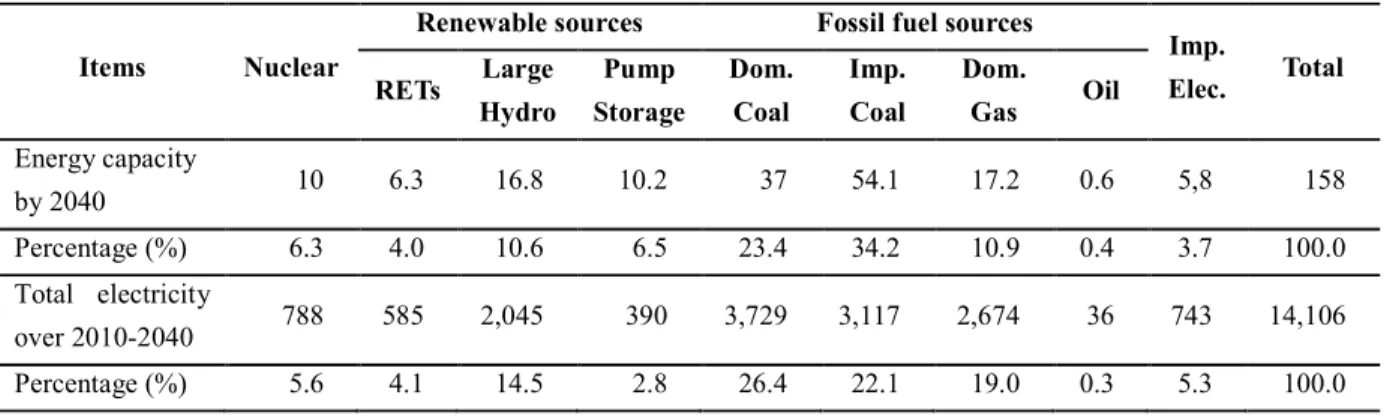
The IRP simulation meets the projected demand for energy services during the next three decades by a hugely expanded coal-fired generation capacity. In the baseline development or Business-As-Usual (BAU) scenario, the expansion of energy capacity requires a great average growth rate of 10% per annum over the period from 2010 to 2040, reaching about 158 GW by 2040. This includes 109 GW of fossil fuels, 16.8 GW of large-hydro, 10.2 GW of hydro pump-storage, 10 GW of nuclear, 6.3 GW of renewables, and 5.8 GW of electricity imports.
With such a large expansion of energy capacity, the energy generation mix would be significantly changed by periods of time. The proportion of electricity generation from large hydro grows fast from 28% (37 TWh) in 2010 to 33 % (66.4 TWh) by 2015, but then declines to 8% (69.1 TWh) by 2040 due to a restriction of resources. Whereas the share produced, using coal fuels would hold a drastic growth during this period. In this case, the share of coal-fired generation increases from 32% (66.8 TWh) in 2015 to 68.3% (634.3 TWh) by 2040.
Moreover, the proportion of electricity production from domestic gas-fired sources would decrease from 26% (53.4 TWh) by 2015 to 8% (77.1 TWh) by 2040 because of depletion in indigenous resources. As a political will, nuclear power will engage an important part of the electricity energy supply since 2020 onwards. The share of electricity produced by nuclear plants would enlarge from 2.5% (7.1 TWh) by 2020 to 8% (71 TWh) by 2040. In contrast, the
19
share produced from renewables would decrease remarkably from 8% (21.8 TWh) by 2019 to 2.8% (26.1 TWh) by 2040.
In overall, over the period from 2010 to 2040, fossil fuels are expected to dominate the energy generation mix, and may account for 67.7% of the total cumulative electricity production of 14,106 TWh. Of this production from fossil fuels: coal, natural gas, and oil would account for 71.6%, 28%, and 0.4%, respectively. Whereas hydro and nuclear energy would account for 18.6% and 5.6%, respectively, and the remaining 5.3% comes from electricity imported. Focusing on renewables, the study suggests that with the current renewables development strategy, renewables would contribute remarkably to the electricity energy supply from 2010 to 2020, in which its share of energy capacity grows from 2.5% (575 MW) in 2010 to 10.2% (5,566 MW) by 2020. However, as a broader cluster of investigated renewables sources is not yet strategically integrated in the baseline development, the share will decrease from 10.2% in 2020 to 4% by 2040. In energy production, renewables would contribute 4.1% of the total electricity generation during the period from 2010 to 2040. This finding provides that without further incentive policies, the target for renewables deployment could be hardly achievable at 11% of the total commercial primary energy supplied by 20504. Table 1-5 summaries the prospective outlook of Vietnamese power sector in the next 3 decades.
Table 1-5: The energy capacity (GW) and generation mix (TWh) of Vietnamese power sector over the period 2010-2040. The IRP simulation.
Items Nuclear
Renewable sources Fossil fuel sources
Imp. Elec. Total RETs Large Hydro Pump Storage Dom. Coal Imp. Coal Dom. Gas Oil Energy capacity by 2040 10 6.3 16.8 10.2 37 54.1 17.2 0.6 5,8 158 Percentage (%) 6.3 4.0 10.6 6.5 23.4 34.2 10.9 0.4 3.7 100.0 Total electricity over 2010-2040 788 585 2,045 390 3,729 3,117 2,674 36 743 14,106 Percentage (%) 5.6 4.1 14.5 2.8 26.4 22.1 19.0 0.3 5.3 100.0
1.2.2.2 Greater dependence on large-scale coal and electricity imports for future expansion, even with newer technologies
As the demand for electricity exceeds the expected supply capability of domestic energy sources, the country would start to import coal fuel since 2012 and while electricity is already imported since 2004. Especially, the shift from hydro-to-coal-based generation capacity since 2015 causes a strong demand for coal fuels (domestic and imported), growing from 26.4
4
On 27 December 2007, the Prime Minister signed a Decision No. 1855/QD-TTg to approval the Vietnam's national energy development strategy up to 2020, with 2050 vision. Particularly for renewables development, it aims for a share of 3% in 2010, 5% by 2020 and 11% by 2050 over the total commercial primary energy.
20
million tons by 2015 to 98 million tons by 2030, reaching 217 million tons by 2040. Of this demand, the domestic coal could meet 17.2 million tons (equals to 299 PJ) by 2015, 70 million tons (1,599 PJ) by 2030, and accelerating to 99 million tons (2,289 PJ) by 2040 (Table 1-6). Table 1-6: The future fuel requirements for the expansion of electricity generation system over 2010-2040, the IRP simulation.
Fuel types Unit 2010 2015 2020 2025 2030 2035 2040
F o ss il f u el s Domestic Coal Million tons 14.3 17.2 16.6 41.4 69.8 84.8 99.2 PJ 299.4 360.5 347.0 929.1 1598.7 1949.8 2288.6 Imported Coal Million tons 0 9.2 11.3 15.3 27.8 63.4 117.4 PJ 0 249.2 308.9 416.5 757.0 1726.7 3195.2 Domestic Gas Cubic meters 10.1 9.6 14.1 18.7 19.8 18.0 13.4 PJ 392.4 384.7 562.7 749.3 795.7 725.6 540.0 Oil (FO/DO) Million tons 0.929 0.528 0.209 0.209 0.115 0.116 0.153
PJ 38.94 22.50 8.59 8.59 4.73 4.78 6.27 R en ew ab le s
Bagasse Million tons 0.51 3.40 4.07 4.07 4.07 4.07 4.07 PJ 3.94 26.29 31.55 31.55 31.55 31.55 31.55 Rice husk Million tons 0.08 0.53 0.87 0.87 0.87 0.87 0.87
PJ 0.90 6.05 9.88 9.88 9.88 9.88 9.88 Wood residues Million tons 0 0.18 0.90 0.90 0.90 0.90 0.90 PJ 0 2.68 13.42 13.42 13.42 13.42 13.42 Municipal solid wastes Million tons 0 1.31 2.09 2.37 2.37 2.37 2.37 PJ 0 8.29 13.26 15.03 15.03 15.03 15.03
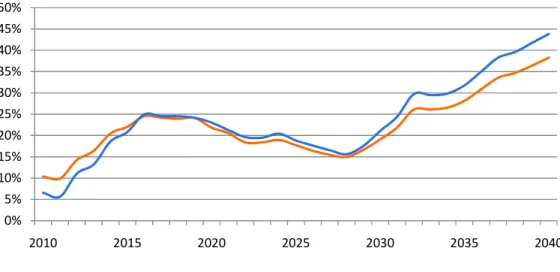
In the point of a macro-view, the expected increase on imports including steam coal, net oil, and electricity for the future development of electric power industry would be raising future issues of energy supply security and large increases in power sector costs for Vietnam. The study findings show that imported energy sources (coal, oil and electricity) would provide 43.8% of the total electricity production, of which 3% for power imports, by 2040 (Figure 1-16). More specifically, coal imports would account for 40% of the total coal material needed for producing electricity during the period from 2010 to 2040 (Figure 1-17). These figures clearly prove that the increasing reliance on large-scale imports for electricity production in the future could lead Vietnamese power sector to be dependent on international energy price fluctuations and potentially large increases in energy costs. Such vulnerability could further contribute to increased poverty, political pressures, and instability.
21
Figure 1-16: Greater dependence on imported fuels including electricity for electricity generation in Vietnam, 2010-2040. Simulation by IRP.
Figure 1-17: Coal consumption (million tons) for electricity generation in Vietnam, 2010-2040. Simulation by IRP.
Technologically, the simulation presents a large array of electricity generation technologies based on both conventional and non-conventional energy sources for the next 30 years. This technological application varies from hydro (large, medium, and pump storage) and fossil fuel options (coal-, gas-, and oil-fired) to renewables (small hydro, biomass including bagasse, rice husk, wood residues, and municipal solid waste, geothermal, wind, and solar). Among six coal-fired generation technologies considered in the IRP model, the IGCC technology would not be cost-effective for the future electricity generation in Vietnam due to its still-high production cost. The electric power industry would continue to rely on conventional pulverized coal (PC) or sub-critical coal-fired technology, at least for the next 15 years. However, it would be
0% 5% 10% 15% 20% 25% 30% 35% 40% 45% 50% 2010 2015 2020 2025 2030 2035 2040
Share of imports-based energy capacity Share of imports-based energy generation
1499 981 0 200 400 600 800 1000 1200 1400 1600
interesting to find that the super
competitive for providing electricity energy integrated with 16 GW in energy capacity GW in energy capacity-based
power plants using oil fuels (DO, FO, and diesel) will be deconstructed since 2020. Only a few oil-fired units (600 MW) will remain
1.2.2.3 Cost and financing issues
To expand the electricity generation indust
Vietnamese Government is facing a pressing need of billion $ would be necessarily on the need
generation plants, 58.2% is used for fixed O&M expenses. Figure 1 for the expansion plan from 2010 to 2040.
Specifically, the study showed that the Government
US$ per year for investment in new energy capacity during the short Vietnam is still among the countr
The EVN sales totalled 90,877 bi 8,000 billion VND (VINAFINS, 2011). such investments with its own
power sector keeps being a great challenge otherwise investment. Moreover, a financing architecture
address the funding of climate change mitigation and adaptation issues in industry.
Figure 1-18: Annual component costs of electricity generation
5
Exchange rate: 1 US$ = 19,500 VND.
22
the super-critical coal-fired technology (SPC) would be
for providing electricity energy since 2025. The generation system would in energy capacity-based SPC using domestic coal (anthracite
based SPC using imported coal (bitum) by 2040. In
(DO, FO, and diesel) will be deconstructed since 2020. Only a few units (600 MW) will remain dispatched to the grid up to 2040.
inancing issues
To expand the electricity generation industry during the period from 2010 Vietnamese Government is facing a pressing need of financial resources. A
necessarily on the need. Of this total cost, 26.8% needs for constructing new used for fuels and O&M expenses. The remaining 1
Figure 1-18 illustrates the annual expenditures that would be needed for the expansion plan from 2010 to 2040.
Specifically, the study showed that the Government would have to finance around 2 billion US$ per year for investment in new energy capacity during the short-term of 2010
the countries of lowest electricity price (5.4 US$/kWh) 90,877 billion VND in 2010 (equals to 4.66 billion US
8,000 billion VND (VINAFINS, 2011). Thus, it is insufficient a revenue for EVN to cover its own budgets. How to raise enough funds for new investment in the eing a great challenge otherwise financial constraint may slow down new
a financing architecture will, sooner or later, have to be designed climate change mitigation and adaptation issues in the electric powe
Annual component costs of electricity generation, 2010-2040. IRP simulation.
Exchange rate: 1 US$ = 19,500 VND.
fired technology (SPC) would become cost-system would be anthracite), and 9 Inversely, most of (DO, FO, and diesel) will be deconstructed since 2020. Only a few
2010 to 2040, the resources. A total of 107.5 constructing new expenses. The remaining 15% is required 18 illustrates the annual expenditures that would be needed
would have to finance around 2 billion term of 2010-2015. But (5.4 US$/kWh) in the region. billion US$),5and lost for EVN to cover raise enough funds for new investment in the may slow down new will, sooner or later, have to be designed to the electric power