Anomalous grain refinement trends
during mechanical milling of Bi2Te3
The MIT Faculty has made this article openly available.
Please share
how this access benefits you. Your story matters.
Citation
Humphry-Baker, S. A., and C. A. Schuh. "Anomalous grain
refinement trends during mechanical milling of Bi2Te3." Acta
Materialia 75 (15 August 2014), pp.167-179.
As Published
http://dx.doi.org/10.1016/j.actamat.2014.04.032
Publisher
Elsevier
Version
Author's final manuscript
Citable link
http://hdl.handle.net/1721.1/105399
Terms of Use
Creative Commons Attribution-NonCommercial-NoDerivs License
1
Anomalous grain refinement trends during mechanical milling of Bi2Te3
S. A. Humphry-Baker and C. A. Schuh
Department of Materials Science and Engineering, Massachusetts Institute of Technology, Cambridge, MA 02139, USA
Keywords: Thermoelectric, Ball milling, Minimum grain size, Bismuth Telluride,
Thermal recovery
Abstract:
The structural evolution of nanocrystalline Bismuth Telluride (Bi2Te3) during
mechanical milling is investigated under different milling energies and temperatures. After prolonged milling, the compound evolves toward a steady-state nanostructure that is found to be unusually strongly dependent on the processing conditions. In contrast to most literature on mechanical milling, in Bi2Te3 we find that the smallest
steady-state grain sizes are attained under the lowest energy milling conditions. An analysis based on the balance between refinement and recovery in the steady state shows that two regimes of behavior are expected based on the thermo-physical properties of the milled powder. Bi2Te3 lies in a relatively unusual regime where
greater impact energy promotes adiabatic heating and recovery more than it does defect accumulation; hence more intense milling leads to larger steady-state grain sizes. Implications for other materials are discussed with reference to a “milling intensity map” that delineates the set of material properties for which this behavior will be observed.
2
1) Introduction
Bismuth Telluride (Bi2Te3) and its solid solutions are currently front-running
materials for low temperature thermoelectric applications, due to their high figure of merit, ZT [1]. To improve the ZT of Bi2Te3 alloys, grain refinement is a promising
strategy [2], because grain boundaries scatter phonons and thus reduce thermal conductivity without degrading electronic transport [3]. Refining the grain size to nanocrystalline (nc) dimensions via mechanical alloying and milling has received considerable interest, due to impressive enhancements in ZT that can be realized [4,5]. A secondary advantage of grain refinement is the improved strength from Hall-Petch hardening [6], and resistance to cleavage fracture, which provides critical mechanical stability for demanding service applications.
The as-processed microstructure and resultant thermoelectric properties of nc-Bi2Te3 are critically dependent on the processing conditions [7]. Despite this, studies
of nanostructure formation during milling of tellurides are relatively rare, not usually quantitative, and often not readily comparable with one another [4][5]. The general understanding of deformation-induced defects in Bi2Te3 is advancing [8], and may
help to understand the conditions that prevail during mechanical milling. Some examples include studies of the atomistic structure of symmetric boundaries [9], the role of deformation-induced point defects in determining the carrier concentration [10], the effect of different levels of deformation on resulting thermoelectric properties [11], and the energetics of the possible vacancy and antisite defects [12]. What is missing, however, is a quantitative understanding of how these defects evolve during mechanical milling.
The structural evolution of metals and intermetallics in general during mechanical milling has been reviewed by many authors [13–17], and Bi2Te3 might be nominally
expected to follow literature trends. For example, grain size tends to decrease monotonically with milling time towards a steady-state grain size (dss) [18,19] after prolonged milling that is characteristic of the material [20,21]. This minimum is usually accompanied by saturation in stored enthalpy. Reduction in grain size is – in most but not all cases[19]– concomitant with a monotonic increase in lattice strain [22]. In addition, high point defect concentrations form through non-equilibrium vacancies [23] and antisites [24] in the case of ordered materials. Cumulatively, these defects contribute to a stored enthalpy that can approach 30-40% of the enthalpy of fusion [19]. The microstructural steady state is controlled by the processing
3
parameters, the most influential of which are vial temperature, media velocity, and media size. Lowering milling temperature is a known technique for lowering dss [25–
34] by favoring hardening over defect recovery [20] , as is increasing the milling intensity – either by increasing media velocity or media size [26,34–38].
However, none of the above studies are specific to thermoelectric compounds, or to tellurides in particular, so there remains a need for systematic study in order to understand and control interfaces and mechanically induced defects in nc-Bi2Te3
based materials. Indeed, the Bi-Te system occupies a unique position in the literature on mechanical alloying, being a negative heat-of-mixing (exothermic) system in which the 2Bi + 3Te → Bi2Te3 reaction occurs explosively, but only on the particle
scale [39]; it is the only system so far reported to have this characteristic. In a previous report, we studied the exothermic reaction in some detail[39], so here we limit our scope to the deformation induced structural evolution that occurs after the intermetallic is formed. In particular, the evolution of the intermetallic grain structure to a dynamical steady state is our focus, including the effect of processing parameters on this steady state. On the basis of these observations we argue that what governs the steady-state structure is largely the impact temperature at an individual collision site. Bi2Te3 is found to have uniquely sensitive processing-structure relations, which can be
explained by the combination of low melting point and low thermal effusivity of the compound, the latter of which – besides making for a good thermoelectric material – prevents dissipation of the heat of plastic deformation, thus enhancing thermal recovery of mechanically induced defects.
2) Experimental Methods
2.1 Mechanical milling
High energy ball milling experiments were performed beginning with Bi and Te powders of 99.5% purity and maximum particle diameters of 45 and 75 microns, respectively, weighed according to the stoichiometry Bi2Te3. In all experiments the
mass of the media was kept to about 50 g and the mass of powders to about 10 g. Mechanical milling was performed with chrome steel balls in a flat-ended hardened steel vial, which was loaded into a SPEX 8000 shaker mill operating inside a high-purity argon atmosphere in a glove box. In some experiments where the milling had to
4
be performed outside the glove box, the vial was initially sealed inside the box and subsequently transferred outside. Milling experiments were performed at a range of oscillation frequencies, by retrofitting the SPEX mill with a 3-phase motor and a variable frequency drive. The frequency was calibrated independently using a light stroboscope.
In order to monitor the milling temperature, a K-type thermocouple was attached to the exterior of the vial wall and the time-temperature profile was logged on a computer. The milling temperature was also actively varied to achieve three general temperature conditions:
i) “Tlow”, below room temperature and generally about -90 ° C. To cool below room temperature (Tlow) the exterior of the vial was intermittently flushed with liquid nitrogen between 10 minute milling intervals. ii) “Tmed”, between room temperature and normal operating temperature and
generally between 25 and 80 ° C. To vary Tmed, cooling was applied to the vial surface using a multi-speed fan.
iii) “Thigh”, a higher than normal operating temperature, up to 170 ° C. Thigh was achieved by insulating the vial in a jacket to allow heat to accumulate. Our previous work on this system showed that complete reaction between Bi and Te to form Bi2Te3 occurs very swiftly during milling [39], within about 15-30
minutes, and this remains true for all of the conditions studied in this work. Accordingly, our focus in what follows is for time scales greater than 30 minutes, during which no reaction is occurring, but structural evolution of the intermetallic is taking place. To compare milling experiments conducted at different times and frequencies, we employ the “specific milling dose”, which is a measure of the mechanical energy input to the powder [40,41]:
/ ⁄ [1]
where N, t, and mp are the milling frequency, the milling time, and the mass of powder respectively. The term Erepresents the impact energy of a collision, and in general is dependent on the milling vial geometry, dynamics of the milling balls, thermomechanical properties of the materials involved and hence is not known a priori[41]. However for a given experimental configuration the impact energy can be
5
empirically measured[42]. We performed such a measurement using the calorimetric method [40] under different milling frequencies, the details of which are given in Appendix A. The essential result of this analysis is that E is linearly related to N2 over the range of experimental conditions used. This allows a more functional form for the specific milling dose in terms of experimentally varied parameters, N and t:
/ [2]
where D0 is a constant, and was found to be 50 ± 2 μJ-s2-g-1 under the conditions of this study.
2.2 Powder characterization
Samples of powder were characterized by x-ray diffraction (XRD), using a PANalytical X’Pert powder with a Cu Kα radiation source operated at 45 kV and 40 mA. All patterns were collected at a scan rate of 2o min-1 over a scan range of 10-80
degrees 2θ. The patterns were analysed using the Rietveld method, employing a Pseudo Voigt profile function[43], under the assumption of isotropic size and strain. The Bi2Te3 crystal structure was modelled using literature values for atomic positions
[44]. The instrumental broadening was corrected for using a NIST LaB6 sample.
During the Rietveld procedure, the unit cell constants, order dependent broadening (U) and order independent broadening (W) terms were all refined, allowing the volume-averaged grain size, d, microstrain, ε, and hexagonal lattice parameters, c and
a to be determined.
Transmission electron microscopy (TEM) on as-milled powders was performed using a JEOL 2010 high resolution transmission electron microscope (HRTEM) operated at an accelerating voltage of 200 kV in bright field imaging mode. TEM specimens were prepared by mixing Bi2Te3 powders with a fine Cu powder (to
prevent deformation in the Bi2Te3), followed by cold pressing into a foil. Ion milling
was performed on a Fischione Model 1010 instrument with liquid N2 cooling to less
than 200 K to prevent sample damage [9]. For measurement of grain size, each identified grain was manually traced and measured.
6
3) Results
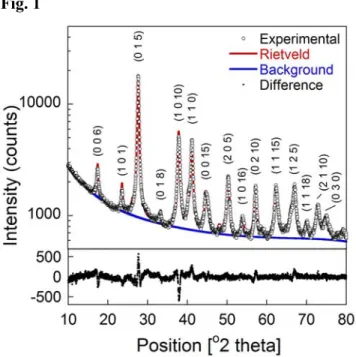
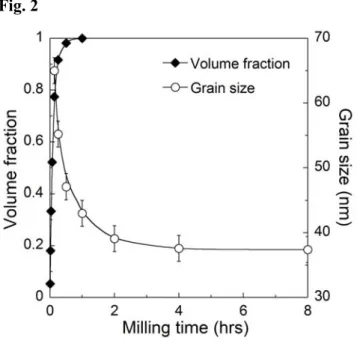
Fig. 1 shows a typical XRD scan of the as-milled powder, showing the difference between the experimental and Rietveld calculated intensities. The small deviation between the two intensities – as indicated by the difference plot in the lower panel – indicates a good quality of fit. Fig. 2 shows the evolution in grain size of the
intermetallic, along with the converted volume fraction of Bi2Te3 phase, during a
typical milling run. Again we note that the first 15 minutes or so of milling cause the rapid reaction of Bi and Te to form the intermetallic Bi2Te3. Subsequent deformation
results in a monotonic reduction in the grain size towards a steady state after prolonged milling.
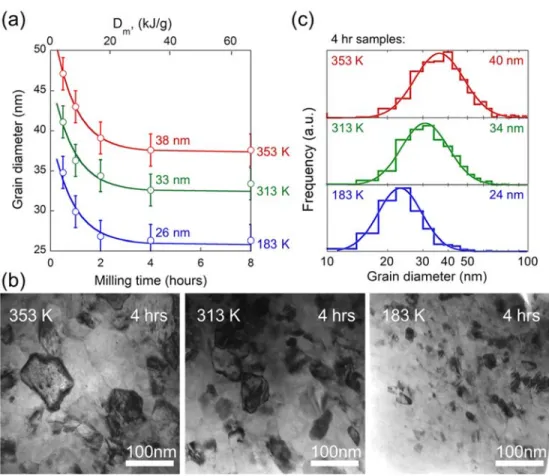
Fig. 3 reveals that the steady-state grain size, dss,increases measurably with milling temperature. Fig. 3(a) shows the evolution of grain size, d, as a function of milling time for three different milling temperatures, each with an average media radius of 3.5 mm and a milling frequency of 35.3 Hz. A secondary x-axis of specific milling dose is provided to allow comparison to other milling conditions. Fig. 3 also reveals that dss is reached at a milling time of about 4 hours, or a specific dose of 32 kJ/g, at each temperature. Fig. 3(b) shows bright field TEM images of the samples that have been milled to the steady state, confirming the increase in grain size with milling temperature. Fig. 3(c) shows the corresponding steady-state grain size
distributions measured from at least 300 grains, which is in each case well-fitted with a log-normal distribution as shown by the solid lines. The volume-averaged spherical-equivalent grain diameter agrees well with the XRD data to within about ±2 nm, which is hence used to assign error bars on all reported XRD grain size values.
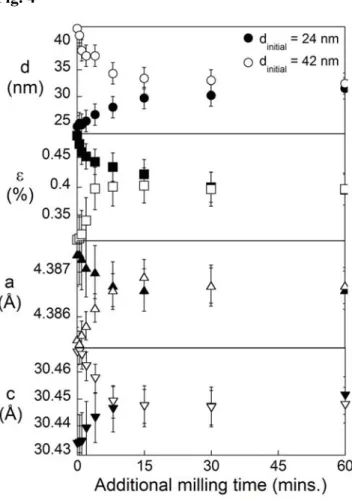
The final structures achieved after milling, and the corresponding values of dss, are characteristic of a dynamical steady state governed by the milling parameters. This is shown by comparing the structural evolution from two batches with different starting grain sizes in Fig. 4. The first sample was milled at a high vial temperature to achieve relatively large grain size (42 nm), and the second at a lower vial temperature to a finer grain size (24 nm). For each sample, a subsequent milling treatment was
conducted at an intermediate vial temperature between the two extremes. Fig. 4 shows the evolution in structural parameters d and ε, along with the lattice parameters c and
a for these two samples; under identical milling conditions, both samples converge on
the same microstructural state after approximately 1 hour. The initially larger grain size (42 nm) saw a further reduction in d, accompanied by an increase in ε, an
7
increase in a and a decrease in c. The initially smaller grain size (24 nm) experienced grain growth during milling to a new steady-state grain size characteristic of the intermediate conditions used; the lattice parameters and microstructure also showed the opposite evolution from the coarser (d = 42 nm) sample, and also converged to the same steady-state values upon subsequent milling. Error is introduced into the values for ε, a and c due partial relaxation of the structure during room temperature aging. An upper bound for this was determined by aging a series of samples for 24 months, from which the average relaxation in structural parameters observed (which are grain size dependent) is used to assign error bars to all subsequently reported values.
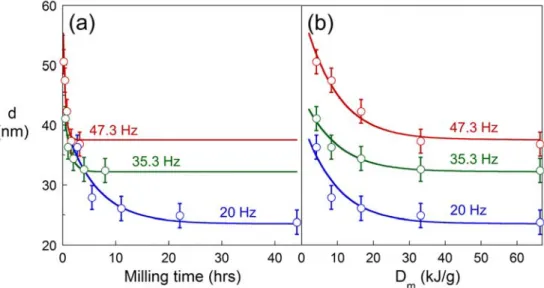
The effect of milling frequency on structural evolution is shown in Fig. 5, for three different frequencies: 20, 35.3 and 47.3 Hz. Fig. 5(a) shows that dss is reached after progressively longer milling times as the frequency decreases. In addition, the value of dss increases with increasing milling frequency. Fig. 5(b) shows the same data re-plotted against the specific energy dose, Dm, which is calculated using Eq. (2). The Dm scaling reveals that the steady state is reached at the same Dm irrespective of
N.
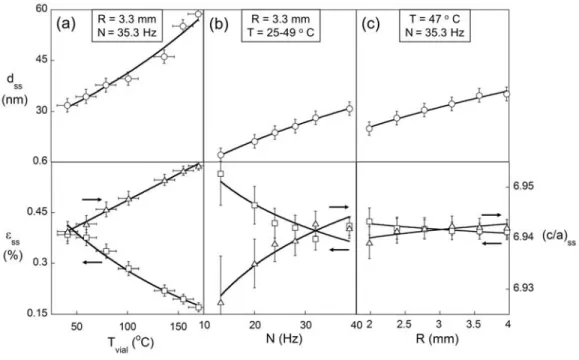
The effects of all milling parameters – vial temperature, Tvial, milling frequency,
N, and media radius, R – on the steady-state structure are shown more quantitatively
in Fig. 6. Each data point is taken after milling to a specific energy dose of 32 kJ/g, which is equivalent to 4 hours in the un-modified SPEX mill with a frequency of 35.3 Hz, and for simplicity we report just three main structural variables: dss, εss, and
(c/a)ss. Fig. 6(a) shows the effect of Tvial in the range 41 to 170 o C. Fig. 6(b) shows the effect of N in the range 13.3 to 38.7 Hz. Finally, Fig. 6(c) shows the effect of R in the range 2 and 4 mm. For each varied parameter, the other three are kept constant, except in the case of Fig. 6(b) where there was a small unavoidable variation in Tvial as a result of increased N. This variation was kept to a minimum by employing fan cooling, and the reported range of temperatures in Fig. 6(b) covers the full range experienced by the vial during the experiment. We note that three different values of charge ratios were investigated (1.25, 2.5 and 5), by varying the media mass, however no measurable change in the resulting steady-state structure was observed. The essential point of Fig. 6 is that increasing milling intensity – by either increasing N or
R – tends to mimic the effect of increasing Tvial, by increasing dss and (c/a)ss, while reducing εss.
8
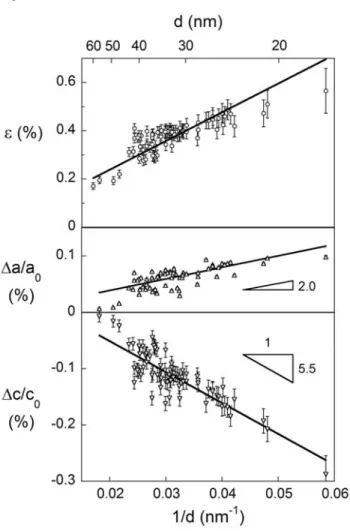
To illustrate how structural variables are linked, Fig. 7 shows ε and the deviation in lattice parameters from the literature values [44] - Δc/c0 and Δa/a0 - as a function
of d. Every sample analysed in this study is shown. Clearly ε, Δc and Δa all show an inverse relationship with d, however the sign of the change in c and a are opposite; the unit cell expands in the a-direction but contracts in the c-direction as the grain size decreases. Again, some scatter is introduced in the data due to samples being analysed at varying times after milling, and also minor changes in stoichiometry from batch-to-batch.
4) Discussion
4.1 Microstrain and lattice parameter change
The most significant results in this work pertain to the grain size of the milled compound, and the majority of our discussion in the sections that follow will focus upon that feature. However, microstrain from dislocations influences thermoelectric properties due to phonon and electron scattering, while point defects introduced by
milling act as charge carriers[10], so these quantities are of engineering relevance. We are not aware of prior reports on the evolution of point and line defects during mechanical milling, and so offer some observations on this issue here.
The monotonic increase in microstrain with decreasing grain size seen in Fig. 7 is characteristic of mechanical milling under dislocation-mediated deformation, and has been observed in other mechanically milled materials. For example, during milling of Fe under different conditions, an inverse relationship between grain size and
microstrain was observed, although the intercept depended on analysis conditions [34]. In other nc-metals and intermetallics synthesized by mechanical milling a horseshoe trend is sometimes observed [18,45], i.e., a peak in the microstrain is reached at a grain size of around 5-20 nm, with further grain size reduction resulting in decreasing lattice strain, as dislocation mechanisms cease operating and the lattice relaxes[46]. However, we did not observe such a decrease, perhaps because our processing conditions could not achieve finer grains.
The reduction in axial c/a ratio of the lattice parameters away from the literature value of a = 4.386 Å and c = 30.497 Å [44]with decreasing grain size can be
explained by increasing concentrations of point defects. As shown in Fig. 7, the relative lattice parameter change is larger in the c-axis than in the a-axis. The two
9
slopes are different by a factor of 2.5, which can be explained by the high degree of bonding anisotropy in the Bi2Te3 crystal. In particular, the bonding between Te1-Te1
planes is much weaker, resulting in a large anisotropy in the elastic moduli [47] and hence the dilatory stress field imposed by a point defect will mostly be accommodated by straining the weaker inter-planar bonds along the c-axis. Antisites change the c/a ratio by about 0.15 to 0.2% for every 1% change in stoichiometry [48,49].
Alternatively, vacancies can even more readily account for such a deviation,
especially since they accumulate preferentially on a specific lattice site. In particular, the fact that p-type stoichiometric Bi2Te3 samples will become n-type when subjected
to heavy plastic deformation has been explained via an excess formation of VTe
over VBi’’’ [10,50,51]. Vacancies distort the lattice more strongly than antisites, since
their coulombic repulsion is twice (for VTe) or three-times (for VBi’’’) that of an
antisite.
4.2 Effect of milling temperature on steady state
Perhaps the most significant result of this study is the unexpected response of the steady-state grain size, dss, to variations in the impact energy, E, as shown in Fig. 6(b) and (c). What is most abnormal here is that dss increases with increasing E – which is achieved either by increased ball size or milling frequency. This trend runs counter to experimental investigations of many metals [27,29,34,36–38] and intermetallics [26], where more aggressive milling leads to finer grains, i.e. dss is found to decrease with increasing E. As we shall see in the coming sections, we attribute the unique response of Bi2Te3 to enhanced thermally-induced recovery effects. Accordingly, it is useful to
begin by examining the temperature dependence of dss.
The steady-state milled structure of Bi2Te3 is unusually sensitive to the
processing temperature. Fig. 6(a) shows that with an increase in vial temperature of only 130 ° C, the compound experiences an approximate doubling in dss from ~30 to ~60 nm. Similar enlargement of the microstructure with increasing milling
temperature is observed in other metals [25,27,29,30] and intermetallic compounds [25,28], however the change is usually less extreme than we observe here. Literature studies of ordered intermetallic compounds, subjected to ball milling at various temperatures are summarized in Table 1. For example, in the compound Fe3Si, over a
10
nm. Other compounds see a similar small change of a few nanometers over a comparable temperature range [25,28]; all of these are very small compared to that seen in Bi2Te3, which is also shown in Table 1 for comparison.
We attribute the increased sensitivity of Bi2Te3 to its relatively low melting
point, which is Tm = 585 ° C, compared to Tm = 1246 ° C for Fe3Si and even higher
temperatures for the other compounds in Table 1. For high melting point materials, the steady-state grain size is thought [22] to be limited by the critical distance below which a dislocation pileup cannot exist [52]. Below this grain size other intergranular deformation mechanisms begin to operate, and the limiting grain size is controlled by deformation rates rather than milling temperature. But for low melting point
materials the steady-state grain size is governed by a dynamical balance between refinement and recovery trends [22]. At the typical operating temperature of the SPEX mill of 70 o C, Bi
2Te3 powders are already above a homologous temperature of
0.4, which is the point at which dislocation climb typically becomes important during deformation and recovery [23]. As such, in Bi2Te3 we expect recovery effects to be a
controlling factor over the steady state.
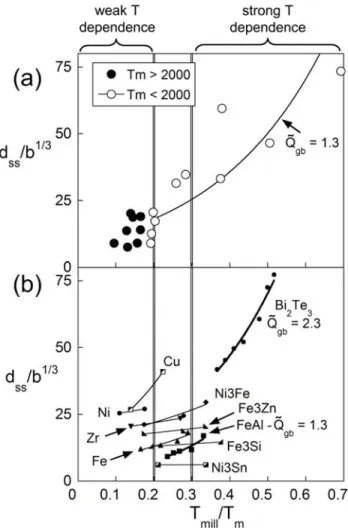
The transition between recovery dominated (low-melting point) and
deformation dominated (high-melting point) behavior can be seen in Fig. 8. The upper section [Fig. 8(a)] shows dss data taken from Koch et al. for a collection of pure metals[53] plotted against normalized milling temperature (Tmill/Tm), where the milling temperature is assumed to be a typical 350 K. Below a homologous milling temperature of about 0.2 there is no clear relationship between dss and melting temperature [53]. This may be interpreted as the “high melting point” regime where recovery is not significant in the steady-state development. However above about 0.2
Tmill/Tm, a clear relationship emerges. Similarly, Fig. 8(b) shows dss data taken from various studies [25,28,29,34] where Tmill was varied under identical conditions. A few metals and intermetallic compounds are shown along with Bi2Te3 for comparison.
Data is scarce, however the same broad trend is observed, with a transition between strong temperature dependence and weak temperature dependence at homologous temperature around 0.2 to perhaps 0.3.
Several authors have modelled the microstructural end-state during severe deformation based on a balance between recovery and deformation processes [54–58]. Following the approach of Bouaziz et al. [58], we envision a grain size below which strain hardening can no longer occur. Their model considers a relatively simple
11
picture of a grain deforming via dislocation shear, nucleating at one side of the grain and traversing across it, resulting in a pile-up at the boundary. Recovery is assumed to occur when the dislocation is absorbed by the boundary, and the resultant atomic displacement is accommodated by re-shuffling of the atoms at the grain boundary via boundary diffusion. By equating the timescales of the two process described, a relationship for the critical grain size is reached[58]:
/
[3]
where b is the burgers vector, is the shear strain rate, and Dgb is the grain boundary diffusivity. By expressing the diffusivity in its usual Arrhenius form and assigning a dimensionless grain boundary diffusion activation energy: / , where R is the molar gas constant and Qgb is the activation energy for grain boundary
diffusion, gives:
/ /
[4]
By assigning a dimensionless activation energy, , we have assumed some proportionality between Qgb and Tm [59]. Fitting Eq. (4) to the data from the high homologous temperature region of Fig. 8 should thus reveal an apparent activation energy for recovery-controlled milling. Only two materials in Fig. 8 present enough data to assess , and its value for Bi2Te3 (from the present study) and FeAl (from
Ref. [60]) [Fig. 8(b)] is determined as 2.3 and 1.3 respectively. Similarly, for the pure metals below Tm = 2000 K [Fig. 8(a)] is about 1.3.
Based on the trends in Fig. 8, it seems possible that the value of for Bi2Te3 is somewhat larger than for the other materials simply because this study is
probing much higher homologous temperatures not very well covered by prior mechanical alloying literature. In any event, all of the fitted values of are significantly below those that typically characterize grain boundary diffusion, which for BCC and FCC materials lie between 9 and 12 [59]. This discrepancy could be due to a thermally activated component to deformation [23] which would thus tend to reduce the observed activation energy. A smaller value for could also be explained on the basis of nanostructured materials containing a large excess
free-12
volume [61]. Although direct measurements of non-equilibrium grain boundary diffusion activation energies are unfeasible, abnormally low activation energies for grain boundary mediated processes such as grain growth [62–65], sintering [66], and grain boundary relaxation [67] have been reported in nc-materials. Nevertheless, the apparent activation energy for Bi2Te3 agrees to within reasonable accuracy with other
metals and compounds of similar melting point.
4.3 Effect of impact energy on steady state
We now turn to the most surprising result of this study – the anomalous positive correlation between dss and E. To better illustrate this result, Fig. 9 shows the change in grain size, Δdss as a function of E, as compared to data more typical of the literature, i.e., from Ni, Cu and Fe [37]. The literature trend for Fe has been observed by other authors [34,37,38] in other metals such as Ag, Co, Cu, Ti, Zr [37], Nb [68], the compound NiTi[26], and metalloid Si[37] and well as various ceramic materials [69]. A few other studies have claimed a similar energy trend [70,71] but are more ambiguous since the total energy dose was also varied. By comparison, we are only aware of a single prior report of a positive correlation between dss and E, for the compound FeAl; a study by Kuhrt et al. [60] showed this trend in a planetary ball mill (Fritsch Pulverisette 5), although a separate study by Pochet et al. [28] using a lower energy vibrating mill (Fritsch Pulverisette-0) indicated the reverse trend with milling intensity. The data from the present work on Bi2Te3 stand out in the landscape of Fig.
9, because the trend is extremely strong with a positive slope, where the
preponderance of literature data is negatively sloped. The trend is also reproduced with two independent series of experiments that vary the impact energy in distinct ways, via velocity and media radius (labelled as vr and R in Fig. 9 respectively).
We believe that the unusual trend of the Bi2Te3 data in Fig. 9 can be explained
by considering the relative importance of deformation vis-à-vis heat creation and retention at the collision site during milling. When a powder particle is impacted, deformation is localized in shear bands [72], within which there is a process of defect accumulation, as dislocations coalesce into sub-boundaries, and subgrains rotate to form high angle grain boundaries [72]. Higher deformation rates that accompany higher impact energies result in more deformation and thus more defect generation. However, the work of deformation in these regions is converted mostly into heat [73],
13
resulting in an attendant local temperature rise, which tends to anneal out some of the generated defects and opposes grain refinement. As a result, there is a tension
between the increased rates of both defect accumulation and adiabatic heating that more intense milling promotes. Thus, we envisage two regimes of impact energy dependence, depending on which effect dominates:
1) Defect accumulation regime (hereafter denoted defect-regime): the dominant effect of increasing impact energy is a higher rate of defect accumulation, so structural refinement is enhanced preferentially;
ddss/dE < 0
2) Impact temperature regime (hereafter denoted thermal-regime): the dominant effect is a higher effective time-at-temperature locally at each collision site, which preferentially enhances recovery processes;
ddss/dE > 0
The balance between these processes – defect generation and recovery – governs dss in all low melting temperature materials during milling [20,74]. However, we propose that what is crucially different in the case of Bi2Te3 is that greater impact
energy promotes more local recovery through adiabatic heating than it does defect accumulation. The local temperature rise at an impact site is controlled by the rate at which the heat of deformation can be dissipated to the surroundings, which can be parameterised by the thermal effusivity [75]. Bi2Te3 has a very low thermal effusivity
(about an order of magnitude lower than typical metals), and therefore sees far more local heat retention during an impact event; Bi2Te3 experiences the thermal-regime,
where most materials experience the defect-regime.
The two regimes can be more quantitatively understood by incorporating a dependence on impact energy into Eq. (4). To achieve this, we introduce the impact energy of a collision into both the temperature and the strain rate. Although the collision energy was varied parametrically in two ways in this study (by variations in relative velocity, vr, and media radius, R), as noted above they had a quantitatively similar impact on the grain size, and therefore we consider them interchangeable for the purposes of the present analysis. Considering the trend in terms of relative velocity, vr, an approximate shear strain rate during a collision is given by Maurice and Courtney [76]:
14
/ [5]
where M is the Taylor factor of a polycrystal and h is the thickness of the powder trapped at the collision site. To incorporate the effect of temperature, we replace the ambient milling temperature in Eq. (4) with an impact temperature
∆ , where ΔT is the temperature rise experienced during an impact. Many authors have modelled the impact temperature rise [76–78], and we adopt the form proposed by Schwarz and Koch [78] who assumed that the maximum temperature rise at an impacted particle can be represented by the problem of a semi-infinite volume with a constant energy flux at its surface:
4 / / [6]
where ρb and vs are material parameters of the ball – density and speed of sound respectively; and K, ρp and cp are the materials parameters of the milled powder – thermal conductivity, density and specific heat capacity respectively. We can rearrange Eq. (6) into a condensed form:
/ [7]
where we have defined two constants for the parameters of milling media and parameters of the milled powder respectively; 4 / / , and
/
, where e is the thermal effusivity, a measure of the rate at which a material can exchange heat with its surroundings. Combining Eqs. (4, 5 and 7) yields the following:
/
/
[8]
where A0 is a constant. Despite its simplicity, Eq. (8) now contains the necessary physics to describe the two competing effects of E on dss. Upon inspection we see that
15
increase or decrease upon rising impact velocity vr, depending on the rate of heat dissipation within the material favoring either the thermal-regime or defect-regime, respectively.
4.4 Milling intensity maps
To help understand the competition between defect accumulation and adiabatic defect annealing, Fig. 10 shows how dss varies as a function of E as
described by Eq. (8). A series of thermal effusivity contours are plotted in the range 2 to 50 kJ/m2 K s1/2, which are physical bounds for most materials (S and Cu have the
lowest and highest values of all the elements at room temperature, at 0.7 and 37 kJ/m2
K s1/2 respectively [79]). Low values of e correspond to higher temperature rise during
impact and vice versa. In each curve, the two regimes described are displayed; the defect-regime, characterised by ddss/dE < 0, and the thermal-regime, characterised by
ddss/dE > 0. There is a transition from the defect-regime behaviour at low E to
thermal-regime at high E. This transition is demarked by a grain size minimum, which shifts to higher E as e is increased. Thus at experimentally accessible impact energies, low e materials will likely experience the defect-regime, whereas high e materials will likely be in the thermal-regime. This distinction agrees qualitatively with the data shown in Fig. 9, where the defect-regime materials Cu, Ni and Fe have very high values of e = 37, 19, and 17 respectively [79], whereas thermal-regime materials Bi2Te3 and FeAl have much lower values of e of 1.5 [1] and 4.5 [80], respectively.
Combining impact energy with temperature dependence, Fig. 11 shows the grain size landscape for two materials belonging to each regime: Bi2Te3 and Fe,
plotted on axes of temperature and milling energy. The faces slope in opposite directions, reflecting the fundamental difference in E-dependence. In Bi2Te3 the
steady state is minimized at low E and low T, whereas in Fe the minimum is at high E and low T. These trends agree well with the available experimental data points[27], which are plotted alongside for comparison.
The point of crossover between the thermal and defect-regimes can be interpreted literally as the point where there is a slope inflection, i.e., ddss/dE = 0. Taking the derivative of Eq. (8) with respect to vr and setting it equal to zero yields:
16
If the quantity is larger than the quantity on the right, then ddss/dvr < 0 , i.e. the defect-regime is predicted, and vice versa for the thermal-regime.
Eq. (9) may be broadly useful in differentiating expected behaviors across a variety of materials, although the inputs to it are subject to large variations, dependent on microstructure, purity, etc. The analysis is also relatively simple, and neglects a variety of secondary but important material properties which could affect the steady-state milled grain size, such as stacking fault energy, phase strengths, elastic
properties, etc.[20,21]. And of course, in comparing Eq. (9) to available experimental data, all of the errors and uncertainties in the experiments themselves enter in, and are variable across the many different labs and protocols for processing and
characterization. With these caveats in mind, we nonetheless find it instructive to assemble a “milling intensity map” as displayed in Fig. 12. The map is presented on axes of Tm and e, where a given material is represented by a single point. Property data is collected from various sources for metals [79] and ordered compounds [80– 86].
Following our earlier discussion surrounding Fig. 8, we first separate out the high melting point materials, for which thermal recovery effects are not determinant of dss; these are in the right half of Fig. 12 labelled “no recovery” and not relevant to the present discussion. The left side of the plot is the range where dss is determined chiefly by the dynamic competition of thermal recovery and impact, and the concave-down arc drawn through this space is the dividing line between the defect-regime (above the curve) and thermal-regime (below the curve); the curve is a representation of the condition ddss/dE = 0, used to derive Eq. (9). The width of the shaded region arises from uncertainty in the measured values for the activation energy, and encompasses a range of values between that measured for Bi2Te3 (2.3) and
metals (1.3).
What is most quickly clear from examination of Fig. 12 is that most low-melting temperature materials lie in the defect-regime, which is the regime of standard behavior where more intense milling leads to finer grains; this aligns with intuition, as in most materials intense milling promotes deformation and refinement more than it does temperature rise and recovery. Only a few materials lie
17
unequivocally in the lower region where more intense impacts generate preferentially more heating and recovery than they do refinement.
This mapping tends to agree with available experimental evidence. Firstly, Bi2Te3 is one of the rare materials that occupy the thermal-regime, and should exhibit
increasing grain sizes with milling intensity, which is exactly what we have observed in the present study (cf. Fig. 6). Some other V-VI compounds such as Sb2Te3, and
Bi2Se3 also lie within the thermal-regime, and would be worthy of detailed study
during mechanical milling. Secondly, the metallic materials which have been observed in the literature to display defect-regime behavior, such as Ag, Cu, Ni, Fe, etc. [69] all lie as expected, well with the defect-regime in Fig. 12. Finally, the intermetallic FeAl, which to our knowledge is the only other material previously reported to show thermal-regime behaviour, lies within the shaded region between the two regimes. This placement, on the borderline between the two regimes, even helps provide clarity on why the two studies on FeAl discussed in section 4.2 exhibit different behaviour, with that of Kuhrt et al. [60] showing a positive ddss/dE and that of Pochet et al. [28] showing a weakly negative ddss/dE. It is quite possible that the difference between the two studies is due to the different milling devices employed. Kuhrt et al. used a planetary mill – with much higher impact velocity on the order 3-6 m/s, whereas Pochet et al. used a vibrating frame mill – with much lower impact velocities on the order 0.1-0.2 m/s. Therefore it is possible that Kuhrt et al. were probing the high-energy thermal-regime behaviour (as shown in Fig. 10), whereas Pochet et al. probing the low-energy defect-regime. This example, along with the predictions of Eq. (9), suggests that other materials may also display thermal-regime behavior, given that sufficiently high impact energies could be accessed.
5) Conclusions
Our systematic mechanical milling studies of Bi2Te3 powders show that the
steady-state microstructure is strongly affected by the process parameters. Both higher temperatures and higher milling energies tend to produce larger grain sizes. While such a temperature dependence is ubiquitous across all mechanically milled materials,
18
to our knowledge this is the first experimental report where the steady-state grain size is positively correlated with impact energy with a large and unambiguous slope.
By considering the balance between recovery and refinement during milling, the anomalous impact energy dependence is explained on the basis of the adiabatic heat produced during a collision remaining localized in the region of deformation, promoting localized defect loss through annealing. In Bi2Te3, the thermal properties
of the powder are such that it retains adiabatic heat more effectively within the deformation zone, causing much higher temperature rises than in most materials. This, when combined with its low melting temperature, leads to enhanced annealing when the impact energy is higher. While the analysis is relatively simplistic, it reflects the interplay between milling energy and temperature across different materials. The resulting milling intensity map delineates regimes of different energy/grain size responses under mechanical milling, explaining which materials may be expected to exhibit the unusual rate response seen here in Bi2Te3.
The developments here may also speak more broadly to the role of defect recovery in mechanical milling of nanocrystalline materials in general. In particular, the relationship between deformation rates and recovery is not an area that well understood; current steady-state grain size models assume that the overall strain rate is limited by, e.g., diffusion of impurity atoms [20], however the variability of strain rate through processing conditions that is highlighted in this study ultimately questions this assumption. Inclusion of such variability, which will come from a mechanistic understanding of the rate limiting processes, may lead to improved models for the nanostructure that evolves upon milling. Such models will also rely on high-quality data; systematic mechanical-milling studies of some more common low-melting point materials are needed.
From an engineering perspective, this work provides guidelines for the processing of thermoelectric materials based on Bi2Te3 and its solid solutions. Not only are the
finest grain sizes – which are attractive from the device-efficiency point of view – reached, counterintuitively, under lower energy milling conditions, but a greater degree of other structural disorder in the form of point and line defects is introduced along with the grain refinement. These excess defects are retained to some extent after consolidation, and therefore the need to control milling conditions is critical in
19
Acknowledgements
This material is based upon work supported as part of the Solid State Solar Thermal Energy Conversion (S3TEC) Center, an Energy Frontier Research Center funded by the U.S. Department of Energy, Office of Science, Office of Basic Energy Sciences under Award Number DE-SC0001299.
References
[1] Scherrer H, Scherrer S. Bismuth Telluride alloys for Waste Energy Harvesting and Cooling Applications, in: Rowe DM, editor. Thermoelectrics and Its Energy Harvesting. Boca Raton, FL: CRC Press; 2012.
[2] Medlin DL, Snyder GJ. Curr Opin Colloid Interface Sci 2009;14:226. [3] Sharp JW, Poon SJ, Goldsmid HJ. Phys Status Solidi A 2001;187:507.
[4] Ma Y, Hao Q, Poudel B, Lan Y, Yu B, Wang D, Chen G, Ren Z. Nano Lett 2008;8:2580. [5] Poudel B, Hao Q, Ma Y, Lan Y, Minnich A, Yu B, Yan X, Wang D, Muto A, Vashaee D,
Chen X, Liu J, Dresselhaus MS, Chen G, Ren Z. Science 2008;320:634. [6] Li G, Gadelrab KR, Souier T, Potapov PL, Chen G, Chiesa M. Nanotechnology
2012;23:065703.
[7] Gothard N, Wilks G, Tritt TM, Spowart JE. J Electron Mater 2010;39:1909. [8] Medlin DL, Snyder GJ. JOM 2013;65:390.
[9] Medlin DL, Ramasse QM, Spataru CD, Yang NYC. J Appl Phys 2010;108:043517. [10] Schultz JM, McHugh JP, Tiller WA. J Appl Phys 1962;33:2443.
[11] Hyun D-B, Hwang J-S, Shim J-D, Oh TS. J Mater Sci 2001;36:1285. [12] Hashibon A, Elsässer C. Phys Rev B 2011;84:144117.
[13] Suryanarayana C. Prog Mater Sci 2001;46:1.
[14] Koch CC, Whittenberger JD. Intermetallics 1996;4:339.
[15] Lü L, Lai MO. Mechanical Alloying. Boston: Kluwer Academic Publishers; 1998. [16] Zhang DL. Prog Mater Sci 2004;49:537.
[17] Murty BS, Ranganathan S. Int Mater Rev 1998;43:101. [18] Oleszak D, Shingu PH. J Appl Phys 1996;79:2975.
[19] Fecht H, Hellstern E, Fu Z, Johnson W. Metall Mater Trans A 1990;21:2333. [20] Mohamed FA. Acta Mater 2003;51:4107.
[21] Mohamed FA, Xun Y. Mater Sci Eng A 2003;354:133.
[22] Eckert J, Holzer JC, Krill CE, Johnson WL. J Mater Res 1992;7:1751.
[23] Hirth JP. Chapter 20 - Dislocations, in: Cahn RW, Haasen P (Eds.). Phys. Metall. Fourth Ed. Oxford: North-Holland; 1996.
[24] Hellstern E, Fecht HJ, Fu Z, Johnson WL. J Mater Res 1989;4:1292. [25] Hong LB, Bansal C, Fultz B. Nanostructured Mater 1994;4:949. [26] Yamada K, Koch CC. J Mater Res 1993;8:1317.
[27] Goodrich DM, Atzmon M. Mater Sci Forum 1996;225-227:223. [28] Pochet P, Tominez E, Chaffron L, Martin G. Phys Rev B 1995;52:4006. [29] Shen TD, Koch CC. Mater Sci Forum 1995;179-181:17.
[30] Xu J, He JH, Ma E. Metall Mater Trans A 1997;28:1569.
[31] Bonetti E, Campari EG, Pasquini L, Sampaolesi E, Valdrè G. Mater Sci Forum 1998;269-272:1005.
[32] Chan TE, Venkatasubramanian R, LeBeau JM, Thomas P, Stuart J, Koch CC. MRS Online Proc Libr 2013;1456:null.
[33] Witkin DB, Lavernia EJ. Prog Mater Sci 2006;51:1. [34] Tian HH, Atzmon M. Acta Mater 1999;47:1255.
[35] Froes FH, Suryanarayana C, Russell K, Li C-G. Mater Sci Eng A 1995;192-193:612. [36] Delogu F, Cocco G. J Mater Sci 2007;42:4356.
20
[37] Delogu F, Cocco G. Mater Sci Eng A 2006;422:198.
[38] Börner I, Eckert J. Mater Sci Eng Struct Mater Prop Microstruct Process n.d.;226-28:541. [39] Humphry-Baker SA, Schuh CA. Scr Mater 2011;65:516.
[40] Streletskii, A. N. Mech Alloy Struct Appl 2nd Int Conf Struct Appl Mech Alloy Mech Alloy Struct Appl 51-58 n.d.
[41] Cocco G, Delogu F, Schiffini L. J Mater Synth Process 2000;8:167. [42] Delogu F, Schiffini L, Cocco G. Philos Mag A 2001;81:1917.
[43] Wertheim GK, Butler MA, West KW, Buchanan DNE. Rev Sci Instrum 1974;45:1369. [44] Nakajima S. J Phys Chem Solids 1963;24:479.
[45] Hellstern E, Fecht HJ, Fu Z, Johnson WL. J Appl Phys 1989;65:305. [46] Fecht H-J. Nanostructured Mater 1995;6:33.
[47] Jenkins JO, Rayne JA, Ure RW. Phys Rev B 1972;5:3171. [48] Brebrick RF. J Appl Crystallogr 1968;1:241.
[49] Magri P, Boulanger C, Lecuire J-M. J Mater Chem 1996;6:773. [50] Navrátil J, Starý Z, Plechác̆ek T. Mater Res Bull 1996;31:1559.
[51] Ionescu R, Jaklovszky J, Nistor N, Chiculita A. Phys Status Solidi A 1975;27:27. [52] Nieh TG, Wadsworth J. Scr Metall Mater 1991;25:955.
[53] Koch CC, Youssef KM, Scattergood RO. Mater Sci Forum 2008;579:15. [54] Estrin Y, Tóth LS, Molinari A, Bréchet Y. Acta Mater 1998;46:5509. [55] Starink MJ, Qiao XG, Zhang J, Gao N. Acta Mater 2009;57:5796. [56] Tóth LS, Estrin Y, Lapovok R, Gu C. Acta Mater 2010;58:1782. [57] Petryk H, Stupkiewicz S. Mater Sci Eng A 2007;444:214.
[58] Bouaziz O, Estrin Y, Bréchet Y, Embury JD. Scr Mater 2010;63:477. [59] Brown AM, Ashby MF. Acta Metall 1980;28:1085.
[60] Kuhrt, Schröpf H, Schultz L, Arzt E. Mech Alloy Struct Appl 2nd Int Conf Struct Appl Mech Alloy Mech Alloy Struct Appl 269-273 1993.
[61] Löffler J, Weissmüller J. Phys Rev B 1995;52:7076. [62] Chauhan M, Mohamed FA. Mater Sci Eng A 2006;427:7.
[63] Natter H, Schmelzer M, Loffler M-S, Krill CE, Fitch A, Hempelmann R. J Phys Chem B 2000;104:2467.
[64] Malow TR, Koch CC. Acta Mater 1997;45:2177. [65] Ebrahimi F, Li H. Scr Mater 2006;55:263.
[66] Dabhade VV, Rama Mohan TR, Ramakrishnan P. Mater Sci Eng A 2007;452-453:386. [67] Rupert TJ, Trelewicz JR, Schuh CA. J Mater Res 2012;27:1285.
[68] Koch CC. Nanostructured Mater 1993;2:109. [69] Delogu F, Cocco G. J Alloys Compd 2006;420:246.
[70] Boytsov O, Ustinov AI, Gaffet E, Bernard F. J Alloys Compd 2007;432:103. [71] Vives S, Gaffet E, Meunier C. Mater Sci Eng A 2004;366:229.
[72] Hellstern E, Fecht HJ, Garland C, Johnson WL, Keck WM. MRS Online Proc Libr 1988;132:null.
[73] Taylor GI, Quinney H. Proc R Soc Lond Ser Contain Pap Math Phys Character 1934;143:307.
[74] Eckert J. Nanostructured Mater 1995;6:413.
[75] Carslaw HS. Conduction of Heat in Solids, 2nd ed. Oxford [Oxfordshire] : New York: Clarendon Press ; Oxford University Press; 1986.
[76] Maurice DR, Courtney TH. Metall Trans A 1990;21:289. [77] Bhattacharya A., Arzt E. Scr Metall Mater 1992;27:749. [78] Schwarz RB, Koch CC. Appl Phys Lett 1986;49:146.
[79] Shackelford JF, Alexander W. CRC Materials Science and Engineering Handbook. Boca Raton, FL: CRC Press; 2001.
[80] Terada Y, Ohkubo K, Nakagawa K, Mohri T, Suzuki T. Intermetallics 1995;3:347. [81] Desai PD, Payne JE, Gilp BF, Dudley RD, editors. Properties of Intermetallic Alloys.
West Lafayette, Ind: Metals Information Analysis Center, Center for Information and Numerical Data Analysis and Synthesis, Purdue University; 1994.
21
[83] Westbrook JH, Fleischer RL, editors. Magnetic, Electrical and Optical Properties, and Applications of Intermetallic Compounds. Chichester, England ; New York: Wiley; 2000. [84] Asm, 0871703815, 978-0871703811. ASM Handbook: Volume 3: Alloy Phase Diagrams
(Asm Handbook) (Asm Handbook), 10 edition. ASM International; 1992.
[85] Pierson HO. 1 - Introduction, in: Pierson HO (Ed.). Handb. Refract. Carbides Nitrides. Westwood, NJ: William Andrew Publishing; 1996.
[86] Patnaik P. Handbook of Inorganic Chemicals. New York: McGraw-Hill; 2003. [87] Delogu F, Mulas G, Schiffini L, Cocco G. Mater Sci Eng A 2004;382:280.
APPENDIX A: Terminology and Impact Energy Evaluation
Here we develop the methodology for evaluating the energy consumption of milling under different conditions. This allows comparative investigation in different milling devices. Under the assumption that each collision is purely inelastic, we define the impact energy (E) specific milling intensity (Im) and specific milling dose (Dm) by:
[A.1]
/ ⁄ [A.2]
/ ⁄ [A.3]
Where mb is the ball mass, and vr is the media velocity and can be obtained
experimentally using the time lag method [42] or through the amount of heat released using the calorimetric method [40] under the assumption that most plastic work is dissipated as heat[73]. N is the number of hits per second, t is the milling time, mp is the mass of the powder, and CR is the charge ratio, i.e., ratio of total powder mass to total ball mass.
In the calorimetric method, the collision energy can be determined accurately from the temperature rise of the vial, so long as the vial is well insulated, and the milling time is small compared to the mean lifetime of temperature loss. This
procedure was employed to calculate the energy consumption of the SPEX 8000 mill under a variety of milling frequencies. Although the dynamics of this mill have been measured quantitatively using a single milling ball by Delogu et al.[42], we used
22
multiple milling balls in the present experiments. While this reduces processing time, it also necessitates independent verification of the energy consumption.
The rate of energy dissipation plotted as a function of milling frequency is plotted in Fig. A.1, with the corresponding rate of temperature rise shown in the upper left-hand corner of the figure. Total energy dissipation is calculated by estimating the vial heat capacity to be 419 J/K. This is then normalized per unit mass of milling media, to allow comparison between this study (approximately 50 g of balls) to the results of velocity measurements made on a single 12 g ball [42]. Good agreement is found between the two techniques, which suggests that collisions under many ball conditions are mainly inelastic. We note that in both cases the energy evolved per collision is linearly related to the square of the milling frequency. The result is that we can express the impact energy as:
[A.4]
Where D0 is a constant found to be 50 ± 2 μJ-s2-g-1 under the conditions used. This allows the milling dose to be expressed in terms of the experimentally varied parameters:
/ [A.5]
Tables:
Table 1. Change in steady-state grain size over the range in milling temperatures explored for this study, compared to other ordered intermetallic compounds in the literature.
Compound Equilibrium structure Tm (o C) Tmill (o C) dss (nm) Bi2Te3 hR15 585 41 170 32 59 Fe3Si [25] cF16 (D03) 1246 23 300 8.2 9.2 FeAl [28] cP2 (B2) 1310 70 300 7 13 Ni3Fe [25] cP4 (L12) 1426 23 300 13.4 18.7
23
1) Figures Figure Captions
Fig. 1 – Representative XRD scan on a logarithmic scale, with Rietveld simulation and fitted background overlaid. The difference plot in the lower section – plotted on a linear scale – indicates a good fit.
Fig. 2 – The volume fraction of compound Bi2Te3 (rhombuses) reaches near complete formation after 15-30 minutes of milling, after which the grain size (circles) decreases towards a steady state after about 4 hours.
Fig. 3 –Evolution in XRD grain size as a function of milling time at 183, 313, and 353 K is shown in part (a), while representative TEM micrographs at 4 hours of milling are shown in part (b). Grain size distributions of these samples, as shown in part (c), are log-normal as expected. Volume-weighted average grain sizes on each histogram are in good agreement with XRD.
Fig. 4 – The final grain size is a true dynamical steady state. Starting from two different starting initial grain sizes, 24 nm (closed symbols) and 42 nm (open symbols), both samples converge on the same structural state when milled under identical conditions.
Fig. 5 – Grain size evolution during milling as a function of (a) milling time, and (b) specific milling dose, Dm, for different milling frequencies, N. The steady state is reached at shorter times under higher N, but at the same Dm of about 32 kJ/g.
Fig. 6 – The steady-state microstructural disorder decreases with increasing milling
temperature and impact energy. The top panel shows the dependence of the steady-state grain size, dss on a) vial temperature, Tvial (b), milling frequency, N, and (c) media radius, R. The lower panel shows the corresponding change in microstrain, εss, and c/a lattice parameter ratio, (c/a)ss.
Fig. 7 – Microstrain (upper panel) and deviation in lattice parameter (lower two panels) follow an inverse grain size dependence across all samples milled in this study. Lattice parameter a increases, while c decreases, relative to literature values [44].
Fig. 8 – The steady-state grain size becomes increasingly temperature dependent above a homologous temperature of 0.2. Data shown is for (a) pure metals milled at ambient milling temperatures [53] and (b) metals, alloys and intermetallics milled at various temperatures
24
[25,28,29,34]. Eq. (4) is fitted to data above 0.2 Tm, yielding a dimensionless activation energy, , which varies from 2.3 for Bi2Te3 to 1.3 in the case of metals and the compound FeAl.
Fig. 9 – The steady-state grain size change, Δdss, increases with increasing impact energy, E, in the case of Bi2Te3 [this study], but decreases in the case of Cu, Ni and Fe [37]. The two studies of Kuhrt et al. [60] and Pochet et al. [28] report opposing energy dependencies for FeAl.
Fig. 10 – Change in steady-state grain size is plotted as a function of impact energy using Eq. (8), for various values of thermal effusivity, e. Thermal-regime behavior (ddss/dE > 0) is predicted at low e and defect-regime behavior (ddss/dE < 0) at high e. For intermediate e, a transition between regimes is predicted at intermediate impact energies.
Fig. 11 – The grain size landscapes (E vs Tvial) of Fe and Bi2Te3 have oppositely sloping faces, as predicted by Eq. (8). Fe is minimized at high E and low Tvial whereas Bi2Te3 is minimized at low E and low Tvial. Experimental data points [34] are overlaid and connected by verticals to the surface of Eq. (8), showing qualitative agreement with the model trends.
Fig. 12 – A milling intensity map delineating materials exhibiting “defect-regime” (ddss/dE < 0) or “thermal-regime” (ddss/dE > 0) behavior. Shaded divisions indicate uncertainty in (between 1.3 and 2.3). Bi2Te3 and other V-VI compounds lie within the thermal-regime, with most materials in the conventional defect-regime. A region of “no recovery” is sketched where recovery only plays a limited role – uncertainty in the homologous temperature is shown as shaded region.
Fig. A.1 – Calibration of milling apparatus using the calorimetric method. The inset shows the temperature rise during a calorimetric run at various milling frequencies, from which the slope of the line gives the energy consumption. These values are plotted in the main figure as a function of milling frequency squared, and compared to Delogu et al. [87].
25
Fig. 1
Fig. 3 – Representative XRD scan on a logarithmic scale, with Rietveld simulation and fitted background overlaid. The difference plot in the lower section – plotted on a linear scale –
26
Fig. 2
Fig. 4 – The volume fraction of compound Bi2Te3 (rhombuses) reaches near complete formation after 15-30 minutes of milling, after which the grain size (circles) decreases
towards a steady state after about 4 hours.
27
Fig. 3
Fig. 3 –Evolution in XRD grain size as a function of milling time at 183, 313, and 353 K is shown in part (a), while representative TEM micrographs at 4 hours of milling are shown in part (b). Grain size distributions of these samples, as shown in part (c), are log-normal as expected. Volume-weighted average grain sizes on each histogram are in good agreement with XRD.
28
Fig. 4
Fig. 4 – The final grain size is a true dynamical steady state. Starting from two different starting initial grain sizes, 24 nm (closed symbols) and 42 nm (open symbols), both samples
converge on the same structural state when milled under identical conditions.
29
Fig. 5
Fig. 5 – Grain size evolution during milling as a function of (a) milling time, and (b) specific milling dose, Dm, for different milling frequencies, N. The steady state is reached at shorter
times under higher N, but at the same Dm of about 32 kJ/g.
30
Fig. 6
Fig. 6 – The steady-state microstructural disorder decreases with increasing milling temperature and impact energy. The top panel shows the dependence of the steady-state grain
size, dss on a) vial temperature, Tvial (b), milling frequency, N, and (c) media radius, R. The lower panel shows the corresponding change in microstrain, εss, and c/a lattice parameter
31
Fig. 7
Fig. 7 – Microstrain (upper panel) and deviation in lattice parameter (lower two panels) follow an inverse grain size dependence across all samples milled in this study. Lattice
32
Fig. 8
Fig. 8 – The steady-state grain size becomes increasingly temperature dependent above a homologous temperature of 0.2. Data shown is for (a) pure metals milled at ambient milling
temperatures [53] and (b) metals, alloys and intermetallics milled at various temperatures [25,28,29,34]. Eq. (4) is fitted to data above 0.2 Tm, yielding a dimensionless activation energy, , which varies from 2.3 for Bi2Te3 to 1.3 in the case of metals and the compound
33
Fig. 9
Fig. 9 – The steady-state grain size change, Δdss, increases with increasing impact energy, E, in the case of Bi2Te3 [this study], but decreases in the case of Cu, Ni and Fe [37]. The two studies of Kuhrt et al. [60] and Pochet et al. [28] report opposing energy dependencies for
34
Fig. 10
Fig. 10 – Change in steady-state grain size is plotted as a function of impact energy using Eq. (8), for various values of thermal effusivity, e. Thermal-regime behavior (ddss/dE > 0) is predicted at low e and defect-regime behavior (ddss/dE < 0) at high e. For intermediate e, a
transition between regimes is predicted at intermediate impact energies.
35
Fig. 11
Fig. 11 – The grain size landscapes (E vs Tvial) of Fe and Bi2Te3 have oppositely sloping faces, as predicted by Eq. (8). Fe is minimized at high E and low Tvial whereas Bi2Te3 is minimized at low E and low Tvial. Experimental data points [34] are overlaid and connected by verticals
to the surface of Eq. (8), showing qualitative agreement with the model trends.
36
Fig. 12
Fig. 12 – A milling intensity map delineating materials exhibiting “defect-regime” (ddss/dE < 0) or “thermal-regime” (ddss/dE > 0) behavior. Shaded divisions indicate uncertainty in (between 1.3 and 2.3). Bi2Te3 and other V-VI compounds lie within the thermal-regime, with
most materials in the conventional defect-regime. A region of “no recovery” is sketched where recovery only plays a limited role – uncertainty in the homologous temperature is
shown as shaded region.
37
Fig. A.1
Fig. A.1 – Calibration of milling apparatus using the calorimetric method. The inset shows the temperature rise during a calorimetric run at various milling frequencies, from which the slope of the line gives the energy consumption. These values are plotted in the main figure as

![Fig. 9 – The steady-state grain size change, Δd ss , increases with increasing impact energy, E, in the case of Bi 2 Te 3 [this study], but decreases in the case of Cu, Ni and Fe [37]](https://thumb-eu.123doks.com/thumbv2/123doknet/14012867.456681/34.918.167.527.235.532/steady-state-change-increases-increasing-impact-energy-decreases.webp)
