Narrative Review
The food metabolome: a window over dietary exposure
1–3Augustin Scalbert, Lorraine Brennan, Claudine Manach, Cristina Andres-Lacueva, Lars O Dragsted, John Draper, Stephen M Rappaport, Justin JJ van der Hooft, and David S Wishart
ABSTRACT
The food metabolome is defined as the part of the human metabo-lome directly derived from the digestion and biotransformation of
foods and their constituents. With.25,000 compounds known in
various foods, the food metabolome is extremely complex, with a composition varying widely according to the diet. By its very nature it represents a considerable and still largely unexploited source of novel dietary biomarkers that could be used to measure dietary ex-posures with a high level of detail and precision. Most dietary bio-markers currently have been identified on the basis of our knowledge of food compositions by using hypothesis-driven approaches. However, the rapid development of metabolomics resulting from the develop-ment of highly sensitive modern analytic instrudevelop-ments, the availabil-ity of metabolite databases, and progress in (bio)informatics has made agnostic approaches more attractive as shown by the recent identification of novel biomarkers of intakes for fruit, vegetables, beverages, meats, or complex diets. Moreover, examples also show how the scrutiny of the food metabolome can lead to the discovery of bioactive molecules and dietary factors associated with diseases. However, researchers still face hurdles, which slow progress and need to be resolved to bring this emerging field of research to maturity. These limits were discussed during the First International Workshop on the Food Metabolome held in Glasgow. Key recommendations made during the workshop included more coordination of efforts; development of new databases, software tools, and chemical libraries for the food metabolome; and shared repositories of metabolomic data. Once achieved, major progress can be expected toward a better un-derstanding of the complex interactions between diet and human
health. Am J Clin Nutr 2014;99:1286–308.
INTRODUCTION
The 2 major achievements of nutrition research in the 20th century were the discovery of essential nutrients and the eluci-dation of their role in key physiologic functions. Recommen-dations were defined to provide adequate intakes of these nutrients that led to reduction in risks of deficiency diseases, at least in high-income Western societies. The past 2 decades have seen a shift in nutrition research away from the prevention of deficiency diseases toward the prevention of chronic diseases and the elucidation of the role of nonessential food constituents on such diseases (1). This constitutes a considerable challenge for nutrition research in the 21st century, in particular because of the extreme variety of these bioactive constituents and the large diversity of biochemical targets and signaling and metabolic pathways they may interact with.
Although classical hypothesis-driven approaches have been very successful in discovering essential nutrients, they are ill adapted to aid our understanding of the role of highly diverse nonessential compounds in foods. Data-driven approaches and “omics” technologies offer opportunities to explore the complex interactions between diet and the human organism. In particular, the measurement of hundreds or thousands of metabolites in metabolomic experiments now allows the characterization of in-dividual phenotypes with a level of precision never before achieved (2). Individuals or populations exposed to different environments, lifestyles, or diets can be distinguished and characteristic metabolic differences identified (3).
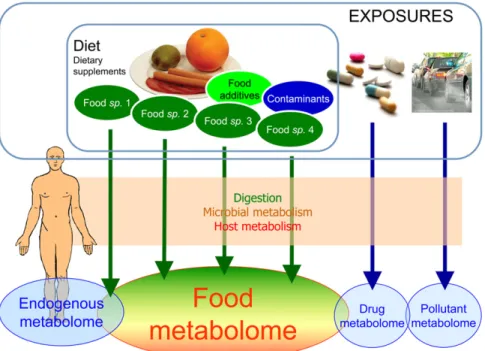
A growing number of metabolomic studies have been pub-lished over the past 5 y in the field of nutrition (3–6). Metab-olomics was used to show the alteration of metabolic profiles on the consumption of specific nutrients, foods, or diets in small-scale intervention studies. Two different fractions of the human metabolome are influenced by the diet: the endogenous metab-olome and the food metabmetab-olome (Figure 1). The endogenous metabolome includes all metabolites from the host. Its variations show novel metabolic effects of the diet that may affect human health. The “food metabolome” has been defined as the sum of
1
From the International Agency for Research on Cancer, Lyon, France (AS); University College Dublin, Dublin, Ireland (LB); the Institut National de la Recherche Agronomique, Clermont-Ferrand, France (CM); Clermont University, Clermont-Ferrand, France (CM); the University of Barcelona, Barcelona, Spain (CA-L); the University of Copenhagen, Frederiksberg, Denmark (LOD); Aberystwyth University, Aberystwyth, United Kingdom (JD); the University of California, Berkeley, CA (SMR); the University of Glasgow, Glasgow, United Kingdom (JJJvdH); and the University of Alberta, Edmonton, Canada (DSW).
2Supported by the European Union (NutriTech FP7-KBBE-2011-5 grant 289511, EUROCAN FP7-KBBE-2010.2.4.1-2 grant 260791); the Danish Ministry of Science, Technology, and Innovation (for the UNIK Food, Fit-ness and Pharma Project); the French National Agency for Research (Phe-noMeNEp ANR-10-ALIA-007); the Medical Research Council (MR/ J010308/1); and the Spanish Ministerio de Economia y Competitividad (MINECO; project AGL2009-13906-C02-01) and by a Senior Visiting Sci-entist Award (to SMR) granted by the International Agency for Research on Cancer.
3
Address correspondence to A Scalbert, International Agency for Re-search on Cancer (IARC), Nutrition and Metabolism Section, Biomarkers Group, 150 Cours Albert Thomas, F-69372 Lyon Cedex 08, France. E-mail: scalberta@iarc.fr.
Received September 19, 2013. Accepted for publication March 24, 2014. First published online April 23, 2014; doi: 10.3945/ajcn.113.076133.
1286 Am J Clin Nutr 2014;99:1286–308. Printed in USA.Ó 2014 American Society for Nutrition
all metabolites directly derived from the digestion of foods, their absorption in the gut, and biotransformation by the host tissues and the microbiota as first proposed by one of the authors of this review in 2008 (7). Other authors have also proposed to define the “food metabolome” as the whole set of food constituents in any foods (5, 8). A definition of the metabolome centered on biological species is preferred here. Humans consume as many metabolomes as there are biological species making up our foods—for example, the tomato or beef metabolomes. There-fore, the human metabolome contains fractions of these me-tabolomes, partly transformed after ingestion, which constitute the human food metabolome.
The various foods consumed by humans contain .25,000 compounds, most of them being further metabolized in the human body (9). The food metabolome is therefore highly complex and also highly variable. This variability constitutes a unique and extremely rich source of information on the human diet that has barely been exploited. Detailed characterization of the food metabolome should permit accurate monitoring of dietary ex-posure and identification of foods that influence disease risks in clinical and epidemiologic studies. This review describes the cur-rent knowledge on the food metabolome and discusses oppor-tunities for nutrition research. It also makes recommendations to move the field forward as discussed by the participants in the First International Workshop on the Food Metabolome (4–5 June 2013, Glasgow, United Kingdom), which convened with 50 experts from Europe and North America (Supplemental Table 1 under “Supplemental data” in the online issue).
DIETARY BIOMARKERS IN THE PRE-OMICS ERA Studies of connections between the diet or specific dietary factors and health status require accurate measurements of di-etary exposures. Such measurements can be used to evaluate compliance in dietary intervention studies, to find associations
with disease outcomes, or to monitor dietary changes in pop-ulations. Dietary exposure has traditionally been measured with self-reported methods, namely dietary recalls or food-frequency questionnaires (10). However, a number of random and sys-tematic errors are inherent in such methods, including recall bias and difficulty in assessing portion sizes (11). The resulting misclassification of subjects, especially when sorting them according to dietary intake, can influence observed associations between dietary exposures and disease outcomes and underlies inconsistencies in published findings in the field of nutritional epidemiology (12).
To address these shortcomings, intense efforts have been di-rected toward statistical techniques to correct measurement errors as well as toward developing new dietary assessment instruments. The application of dietary biomarkers as more objective mea-sures of dietary exposure in nutritional epidemiology has been particularly significant (13). These biomarkers have been used as measures of nutritional status and of exposure to bioactive molecules in foods, as surrogate indicators of food intake, and to validate measures of dietary intake (14). Biomarkers are also useful when little or no data exist on food composition, as is often the case for bioactive molecules such as glucosinolates or food contaminants such as aflatoxins (15, 16).
Dietary biomarkers measured in population studies
A variety of dietary biomarkers identified through the analysis of correlations with dietary intake have been measured in epi-demiologic studies. Information on these biomarkers has been systematically collected in the novel Exposome-Explorer data-base (V Neveu, DS Wishart, and A Scalbert, unpublished data, 2014); w100 biomarkers could be identified (Supplemental Table 2 under “Supplemental data” in the online issue). These biomarkers have been measured in plasma or serum (caroten-oids, fatty acids, vitamins, polyphenols, food contaminants, and
FIGURE 1.The human metabolomes. sp., species.
enzymes), red blood cells (fatty acids, carotenoids, and hemo-globin adducts), and to a lesser extent in urine (polyphenols, vitamins, inorganic compounds, and amino acids). Some of these biomarkers correspond to nutrients and bioactive compounds and have been used to compare status or exposure. Some have been used as surrogate biomarkers of food intake, as follows: poly-phenols, carotenoids, and vitamin C for fruit and vegetables (17, 18); alkylresorcinols for whole-grain cereals (19, 20); isoflavones for soy (21); amino acids and fatty acids for meat (22, 23); fatty acids for dairy products and fish (22, 24); and polyphenols for tea and wine (18, 25) (Table 1). Dietary biomarkers not only include natural food constituents but also certain food additives such as iodine in milk (26) or food contaminants such as polychlorinated biphenyls in fatty fish (27). These latter biomarkers are often specific to certain populations who consume these additives or where consistent levels of contamination are observed.
Other biomarkers are directly derived from the digestion and gut absorption of food constituents or are endogenous metabolites that have been altered by exposure to specific nutrients. For instance, serotonin metabolism is altered by acute alcohol intake (28), the activity of selenium-containing enzymes such as erythrocyte glutathione peroxidase depends on selenium intake, and ceramide synthase is inhibited by exposure to the mycotoxin fumonisins (29).
Pharmacokinetics and reliability of dietary biomarkers Dietary biomarkers are not without their limitations. They may be altered because of possible interactions with genetic factors, physiologic or health status (ie, age or obesity) (30), dietary factors such as fats for lipophilic biomarkers (31), and lifestyle factors such as alcohol intake or smoking (32). Their concen-trations also vary over time according to their pharmacokinetic properties. A higher intraindividual variability is expected for biomarkers with a short half-life (20, 33). Intraindividual vari-ability leads to exposure measurement errors when the objective is to characterize habitual exposure in epidemiologic studies and small numbers of measurements are available across subjects.
Some of the biomarkers listed in Table 1 have half-lives that do not exceed 24 h [polyphenols, alkylresorcinols, and amino acids (34, 35)]. These biomarkers may thus be useful only in pop-ulations who regularly and frequently consume these dietary sources. Lipophilic markers (carotenoids, lipids) (36) or bio-markers associated with erythrocytes (folate, fatty acids) (29) have longer half-lives (week to month) because of the equilibrium of biomarkers between blood and fatty tissues, or because of their integration into erythrocytes. Some dietary compounds such as isothiocyanates and acrylamide also form adducts with blood albumin and hemoglobin (37, 38), with half-lives varying be-tween 3 and 8 wk, and may be used as longer-term biomarkers. Protein adducts with dietary compounds have received limited attention thus far. Adductomics appears to be particularly promising for the discovery of these adduct biomarkers (39, 40).
Biomarker sensitivity and specificity
Dietary biomarkers should have sufficient sensitivity to measure exposures within ranges commonly found in the populations of interest. Intervention studies are essential to address this question and to evaluate the relation between exposure and biomarker concentrations (17, 41). Biomarkers such as vitamin C or selenium
in erythrocyte glutathione peroxidase show saturable effects and may not be suitable for use at high levels of exposure (29, 42). Conversely, some biomarkers are present at concentrations too low to be reliably detected at low levels of exposure. For example, some biomarkers of alcohol abuse were not appropriate to evaluate low to moderate levels of alcohol consumption (43).
Specificity is another essential characteristic of biomarkers. Some biomarkers can be highly specific for a particular food (Table 1). Proline betaine and lycopene are well-established biomarkers for citrus fruit and tomato products, respectively (44, 45). Other biomarkers may be common to several foods or characteristic of an entire food group. Vitamin C and a number of carotenoids and flavonoids are common to many fruit and vegetables. Vitamin C or the sum of carotenoids or flavonoids have been used as generic biomarkers for fruit and vegetable intake (18, 45).
Single biomarker or combinations of biomarkers
Traditionally, single biomarkers have been used to characterize complex dietary exposures such as consumption of a whole food group or intake of a group of compounds with related biological activities. Two examples show the limits of such global assays. Vitamin C used as a biomarker for fruit and vegetable intake is present in a large number of fruit and vegetables, but its content varies widely according to species, varieties, and food-processing methods. It is also widely used as an additive and dietary sup-plement. The Folin assay, commonly used to estimate total polyphenols in foods (46), has also been applied to urine samples to compare polyphenol intake (47), but such use may be in-appropriate because of the presence of interfering reducing metabolites in such complex biological matrices (46).
In contrast to these global assays, analytic approaches based on the estimation of combinations of dietary constituents may pro-vide more accurate measurements of dietary exposure. The ratios of 2 alkylresorcinols characteristic of whole-grain wheat or rye were found to be good indicators of the relative consumption of these cereals (20, 48). However, there are very few such examples in which combinations of biomarkers were used to improve the specificity of dietary exposure measurements. Metabolomics constitutes a comprehensive approach to identify new panels of biomarkers that are specific or common to particular foods or food groups, as shown recently for citrus fruit (49). This should greatly improve the assessment of exposure to classes of food bioactive compounds, food groups, or dietary patterns.
THE FOOD METABOLOME IN THE OMICS ERA
Metabolomics can be described as the application of high-throughput analytic chemistry technologies [liquid chromatography– mass spectrometry (LC-MS)4, nuclear magnetic resonance
4Abbreviations used: dbNP, Nutritional Phenotype Database; ECMDB, E. coli Metabolome Database; FDR, false discovery rate; FooDB, Food Com-ponent Database; GC-MS, gas chromatography–mass spectrometry; HMDB, Human Metabolome Database; LC-MS, liquid chromatography–mass spec-trometry; MS, mass specspec-trometry; MSI, Metabolomics Standards Initiative; MWAS, metabolome-wide association study; NMR, nuclear magnetic reso-nance spectroscopy; PCA, principal components analysis; PLS-DA, partial least-squares discriminant analysis; TMAO, trimethylamine oxide-N-oxide; YMDB, Yeast Metabolome Database.
spectroscopy (NMR), gas chromatography–mass spectrometry (GC-MS)] directed at characterizing the metabolome (ie, the small molecules associated with metabolism). Its development follows that of genomics, transcriptomics, and proteomics. Al-though not as rapid in development or as high-throughput as its omics cousins, metabolomics led a sea change in how small molecules could and should be analyzed. Rather than being limited to measuring only one or a few compounds at a time, new metabolomic technologies allowed researchers to measure hundreds or even thousands of metabolites at a time. This newly found capacity to measure so many chemicals at once led to a number of metabolomic projects, all launched in the mid-2000s, aimed at identifying the metabolomes of microbes (50), plants (51), and humans (52–54). These projects typically used LC-MS, GC-MS, NMR, or a combination of all 3 techniques to identify and/or quantify as many metabolites as possible in cells, tissues, and biofluids of the organisms of interest. These comprehensive metabolomic studies were also complemented by a number of much more specific metabolomic studies aimed
at characterizing the metabolic responses of humans to the in-take of various foods or food constituents such as soy (55), citrus fruit (44), nuts (56), meats (57), and tea (58).
The food metabolome as part of the human metabolome It was through these early metabolome studies that scientists realized that the human metabolome was not as small or as simple as first imagined. In particular, noticeable differences in human metabolomes could be detected that appeared to depend strongly on diet, sex, health status, genetics, kinetics, physiology, and age—with diet being most important (59–62). This dietary de-pendence was not unexpected, but it was not anticipated to be so complicated. Unlike laboratory animals, humans are free-living omnivores who, in fact, eat other metabolomes. Furthermore, humans are exposed to a huge variety of “chemical environ-ments” associated with the various foods we consume. Thus, the human metabolome is not just a single entity but consists of several components (Figure 1), including the following: 1) the
TABLE 1
Biomarkers used as surrogate indicators of consumption of foods and food groups for which significant (r. 0.3) correlations have been reported1 Food category and food Biomarkers
Fruit
Apple Kaempferol, isorhamnetin, m-coumaric acid, phloretin Orange Caffeic acid, hesperetin, proline betaine
Grapefruit Naringenin
Citrus fruit Ascorbic acid, b-cryptoxanthin, hesperetin, naringenin, proline betaine, vitamin A, zeaxanthin
Fruit (total) 4-O-Methylgallic acid, b-cryptoxanthin, carotenoids (mix), flavonoids (mix), gallic acid, hesperetin, isorhamnetin, kaempferol, lutein, lycopene, naringenin, phloretin, vitamin A, vitamin C, zeaxanthin
Vegetables
Carrot a-Carotene
Tomato Carotenoids (mix), lycopene, lutein Vegetables, leafy Ascorbic acid, b-carotene, carotenoids (mix) Vegetables, root Ascorbic acid, a-carotene, b-carotene
Vegetables (total) Ascorbic acid, a-carotene, b-carotene, b-cryptoxanthin, carotenoids (mix), enterolactone, lutein, lycopene Fruit and vegetables (total) a-Carotene, apigenin, ascorbic acid, b-carotene, b-cryptoxanthin, carotenoids (mix), eriodictyol, flavonoids (mix),
hesperetin, hippuric acid, lutein, lycopene, naringenin, phloretin, phytoene, zeaxanthin Cereal products
Whole-grain rye 5-Heptadecylresorcinol, 5-pentacosylresorcinol, 5-tricosylresorcinol Whole-grain wheat 5-Heneicosylresorcinol, 5-tricosylresorcinol, alkylresorcinols (mix)
Whole-grain cereals (total) 5-Heneicosylresorcinol, 3,5-dihydroxybenzoic acid, 3-(3,5-dihydroxyphenyl)-1-propanoic acid, 5-pentacosylresorcinol, 5-tricosylresorcinol, alkylresorcinols (mix)
Seeds
Soy products Daidzein, genistein, isoflavones (mix), O-desmethylangolensin Meats
Meat 1-Hydroxypyrene glucuronide, 1-methylhistidine Meat, beef Pentadecylic acid
Animal products (total) 1-Methylhistidine, 3-methylhistidine, margaric acid, pentadecylic acid, phytanic acid Dairy products
Milk, dairy products Iodine, margaric acid, pentadecylic acid, phytanic acid Fish
Fatty DHA, EPA, long-chain v-3 PUFAs, polychlorinated biphenyl toxic equivalents, pentachlorodibenzofuran, polychlorinated biphenyl 126, polychlorinated biphenyl 153, v-3 PUFAs
Lean Long-chain v-3 PUFAs Beverages (nonalcoholic)
Tea 4-O-Methylgallic acid, gallic acid, kaempferol Coffee Chlorogenic acid
Beverages (alcoholic)
Wine 4-O-Methylgallic acid, caffeic acid, gallic acid, resveratrol metabolites
Beverages (alcoholic) (total) 5-Hydroxytryptophol/5-hydroxyindole-3-acetic acid, carbohydrate-deficient transferrin, ethyl glucuronide, g-glutamyltransferase, aspartate aminotransferase, alanine aminotransferase
1
Data were extracted from the Exposome-Explorer database (V Neveu, DS Wishart, and A Scalbert, unpublished data, 2014).
endogenous metabolome (consisting of chemicals needed for, or excreted from, cellular metabolism), 2) the food metabolome (consisting of essential and nonessential chemicals derived from foods after digestion and subsequent metabolism by the tissues and the microbiota), 3) other xenobiotics derived from drugs, and 4) xenobiotics derived from environmental or workplace chemicals.
The exact size and composition of these different human metabolomes are difficult to ascertain. Minimally, the human metabolome contains 50,000 different detectable compounds (9, 63), but as instrument sensitivity and separation technologies improve, this number is expected to increase. Up to 200,000 different metabolites are estimated to occur in the plant kingdom, and combinations of several hundreds of secondary metabolites generally characterize each edible plant (6, 64, 65). Furthermore, the composition often depends on the body compartment, tissue, or biofluid to which one refers. For instance, many food or drug constituents that might be found in the mouth or stomach are chemically identical to the compounds isolated from the intact food or drug. On the other hand, food constituents found in blood, urine, or other excreta are often metabolically transformed in the liver, kidney, or intestine to metabolites that are very different from the parent compound. This adds greatly to the diversity of the food metabolome. However, in some cases, the parent compounds are broken down to such an extent that their end products are actually identical to chemicals that the body pro-duces naturally. The importance of the gut microbiota in con-tributing metabolites to the human metabolome has also recently emerged (50, 66). Some microbial metabolites, typically vitamins, certain essential amino acids, and a few fatty acids, are specific microbial metabolites (w100 compounds in total are known at this time). However, a large majority of the metabolites produced by the gut microbiota are derived from the biotransformation of both the endogenous metabolome and the food metabolome and are therefore an integral part of these 2 metabolomes. These microbial metabolites include short-chain fatty acids, secondary bile acids, protein and amino acid metabolites, as well as plant polyphenol metabolites (67).
Metabolism of food constituents
Knowledge of the metabolism of food constituents is critical to understanding the origin of the biotransformed fraction of the food metabolome. It is also essential if we wish to use food metabolites as nutritional biomarkers or as a means to monitor food consumption. In this regard, it is useful to review how food chemicals can be metabolized. Food constituents can be me-tabolized in 3 different ways: 1) they can be digested in the mouth, stomach, and small intestine into simple nutrients that can be absorbed through the gut barrier; 2) they can be further transformed by host tissues, especially the liver and kidney; or 3) they can be processed by the gut microbiota in the large intestine.
The first category of food constituents are intermediary me-tabolites formed by digestion of lipids, polysaccharides, and proteins. Most of these compounds are common to all living organisms and identical to human endogenous metabolites. They cannot generally be used as dietary biomarkers because of their common identity and the impossibility to trace their dietary origin. The possible exceptions are the essential amino acids,
essential fatty acids along with most vitamins, and minerals, which cannot be produced by humans and must originate from external dietary sources.
The second way that food constituents can be metabolized is through transformation by host tissues. Food compounds that are not useful for basic metabolism or that do not correspond to fa-miliar endogenous metabolites are treated as “foreign” or as xenobiotics. Examples of exogenous food constituents include polyphenols, alkaloids, carotenoids, chlorophylls, artificial colors, artificial flavors, natural volatiles for flavoring/aroma, and Mail-lard reaction products formed during cooking. The human body maintains a complex defense system consisting of dozens of en-zymes and membrane transporters to recognize these foreign and potentially toxic chemicals and to neutralize them by rapid bio-transformation and/or elimination. Classically, the biotrans-formation process consists of 2 types of chemical reactions, phase I and phase II transformations, both of which occur primarily in the liver, kidney, and intestine. Phase I trans-formations typically involve oxidation of compounds via cytochrome P450 enzymes as well as hydrolysis by various dehydrogenases, esterases, and amidases. On the other hand, phase II transformations consist of chemical modifications such as methylation (by methyltransferases), sulfation (by sulfotransferases), acetylation (by N-acetyltransferases), glu-curonidation (by UDP-glucuronyltransferases), and amino acid conjugation (by glutathione or glycyl transferases). A recent meta-analysis (68) of the metabolic fate of .1000 xenobiotics showed that cytochrome P450 catalyzed oxidations (40%) and UDP-glucuronosyltransferase glucuronidations (14%) were the most common followed by reactions involving dehydrogenases (8%), hydrolases (7%), glutathione-S-transferases (6%), and sul-fatases (5%). In fact, there are.300 different empirical rules that allow one to predict the fate of metabolites on the basis of their chemical structure (69). Many of the metabolites derived from the biotransformation of food components have not been well char-acterized. For polyphenols, .230 phase I/II metabolites have been identified and associated with the consumption of specific polyphenol-containing foods (70). The yield of phase I/II reactions are often very high (68, 71), and host-transformed metabolites re-tain many of the features of their parent compounds. Consequently, these exogenously derived metabolites can be quite useful as specific food biomarkers.
The third way that food metabolites may be transformed is through microbial metabolism. Microbes have a very different set of enzymes from mammals, and given that there are .1000 different species of microbes in the human gut (72) there is an enormous diversity of enzymatic processes that act on food-derived compounds. The gut microbiota is particularly adept at processing polyphenols to phenolic breakdown products. For instance, depending on the predominant microbiota, polyphe-nols can be transformed by ring cleavage to a variety of aromatic compounds such as benzoate and various derivatives of hy-droxyphenylacetic and hydroxypropionic acids. These phenolic acids can be further conjugated to glycine as in hippurate. The gut microbiota also processes indigestible carbohydrates through a variety of fermentative pathways yielding short-chain fatty acids such as butyric acid and propionic acid. Certain microbial metabolites can be useful as food biomarkers, al-though there is a complex relation between the food source, the predominant gut microbial species, and the resulting food
metabolites (73). Consequently, weaker correlations with in-takes of foods or of their constituents were observed for mi-crobial metabolites when compared with untransformed food compounds and host-transformed metabolites (41). This is most probably a result of the large variability of the microbiota across subjects (74). As a result, microbial metabolites should be treated with some caution when used as food biomarkers.
Food metabolome and metabolite databases
Given the complexity of food constituents, the diversity of known food metabolites, and the rapidly growing number of studies on the food metabolome, it is becoming clear that well-curated databases are of utmost importance to keep track of this information. These “omics era” databases are being developed to help researchers understand the origins and fate of many food metabolites (Table 2). Some recent examples include the Human Metabolome Database (HMDB) (9), the E. coli Metabolome Database (ECMDB) (66), the Yeast Metabolome Database (YMDB) (75), Food Component Database (FooDB) (76), Phenol-Explorer (70), and PhytoHub (77). HMDB is an online database of all known and presumptive human metabo-lites. This rapidly growing database currently contains.40,000 metabolites including endogenous, microbial, biotransformed, and exogenous/xenobiotic compounds. ECMDB is another online database consisting of 2750 metabolites known to be produced by Escherichia coli. This resource provides a representative estimate of the microbial metabolome that exists within the human gut. YMDB is a database consisting of 1730 metabolites known to be produced by Saccharomyces cerevisae. Given the number of food products (wine, beer, bread) produced by yeast fermentation and given that yeast also lives in the human gut, this database can also provide some useful data with regard to food metabolites and their possible origins and fate. FooDB is a database of .28,000 food con-stituents, including artificial food additives. Much of the chemical data in FooDB is now in HMDB, but FooDB provides additional information about food sources and food concentra-tions that is not in the HMDB. PhytoHub is an online database dedicated to the phytochemicals present in plant foods (w1000 compounds), their known human metabolites reported in the literature, and other potential metabolites predicted with in silico expert systems. Phenol-Explorer is an online database providing detailed information on dietary polyphenols and polyphenol metabolites. These food-focused resources are particularly de-tailed and provide substantially more in-depth information and reference material than what is available in the HMDB, YMDB,
and ECMDB resources. Entries in each of these databases mentioned here are linked to other online resources such as PubMed, PubChem, Kyoto Encyclopedia of Genes and Ge-nomes, Chemical Entities of Biological Interest, ChemSpider, and other widely used chemical resources. The establishment of these database resources along with the increasingly widespread use of metabolomics in nutrient analysis has now moved the field of food and nutrition science firmly into the modern “omics” era.
METABOLOMICS AND DISCOVERY OF NOVEL DIETARY BIOMARKERS
Study design
As noted previously, metabolomics has emerged as a key tool in the search for novel biomarkers of dietary intake. To date, the methods used for biomarker discovery can be divided into 2 main categories: hypothesis-driven and data-driven. In both cases, metabolomics-based approaches can be applied. In the hypothesis-driven approach, prior knowledge about the biomarker or a series of biomarker candidates is available from food composition databases such as FooDB (78) and methods are developed to measure the candidate biomarkers. So far, this approach has essentially been applied to specific families of food constituents such as fatty acids or carotenoids (45, 79).
In the data-driven approach, there is no prior knowledge of the biomarker and a large number of metabolites are measured, with the main limitation being the capacity of the analytic instrument to detect them. This approach has been used to discover novel biomarkers for a number of foods, nutrients, or diets (Table 3). The samples to be analyzed can be obtained from 1) controlled dietary interventions or 2) cross-sectional studies.
In controlled dietary interventions, subjects consume the food items of interest in a single meal (acute study) or in repeated meals over a given period of time (ranging from a few days to up to 6 mo; short- to medium-term study). In acute studies, biofluids are collected postprandially over a time period of up to 24 h after consumption of the food of interest. Ideally, any biomarker identified in these acute studies must be validated with an in-tervention study to ensure there is a dose response, which would render the biomarker suitable for use over a range of intakes. In short-term interventions, biofluids are collected at the end of the intervention period and compared in subjects consuming either the test food or a control food. Biofluids can also be collected before and after consumption of the test food. A limitation of these intervention studies is the fact that the biomarkers identified
TABLE 2
Metabolite databases related to the food metabolome and accessible online1
Database Metabolites
No. of
metabolites Website address Reference HMDB Endogenous, microbial, biotransformed, and exogenous/
xenobiotic compounds identified in humans
.40,000 www.hmdb.ca (9) ECMDB Escherichia coli metabolites 2750 www.ecmdb.ca (66) YMDB Saccharomyces cerevisiae metabolites 1730 www.ymdb.ca (75) FooDB Food constituents and food additives 28,000 www.foodb.ca (76) Phenol-Explorer Dietary polyphenols and their metabolites 502 www.phenol-explorer.eu (70) PhytoHub Dietary phytochemicals and their metabolites 1500 www.phytohub.eu (77)
1
ECMDB, E. coli Metabolome Database; FooDB, Food Component Database; HMDB, Human Metabolome Database; YMDB, Yeast Metabolome Database.
may not be sufficiently specific for the test food in population studies, because regular diets may include other foods containing precursors of the same biomarkers. For instance, in a cross-sectional analysis of a whole-diet intervention study it was only possible to verify 23% of potential biomarkers observed in previous-meal studies (81).
Cross-sectional studies can therefore play an important role in biomarker discovery. Low and high consumers are selected from food intake data collected by using food-frequency questionnaires, food diaries, or other dietary assessment tools. Comparison of these groups can lead to the identification of biomarkers that are reflective of habitual intake, provided that these biomarkers have a sufficient half-life in the organism or that the foods are regularly consumed. Although these and other studies have shown the potential of cross-sectional studies, care needs to be taken because many of the foods consumed are highly correlated and there is a risk of identifying biomarkers that are not specific to the par-ticular food of interest unless their identity and specific occurrence in the considered foods are established. Notwithstanding, cross-sectional studies are excellent resources that are currently un-derused for dietary biomarker discovery.
Novel dietary biomarkers identified through a metabolomic approach
An extensive list of potential dietary biomarkers discovered by metabolomics is presented in Table 3. Markers associated with the consumption of foods, nutrients, or diets have been identified. Successful studies include the identification of proline betaine as a marker of citrus intake (49, 80). This marker was first identified in small-scale acute feeding studies and validated in free-living subjects in 2 independent studies (44, 80). It was confirmed in a cross-sectional study that used untargeted metabolomics (49) and played an important role in discriminating noncompliant individuals in a dietary pattern study of Nordic compared with habitual diets (106). In these same studies, screening of urinary profiles for predicted metabolites of citrus fruit also led to the identification of some terpenoids and flavonoids as biomarkers of citrus food intake as well as of intake of citrus-flavored sweets. This shows well the importance of previous knowledge on food composition and on metabolism of food constituents for anno-tating unknown discriminating ions in untargeted metabolomic studies.
Trimethylamine oxide-N-oxide (TMAO) was found to be a putative biomarker for meat intake or for meat-containing diets in several studies (102–104), but it has also been reported as a biomarker of fish intake by other authors (82, 107) and shown to be more responsive to intake of fish than meat (85). Several dietary precursors of TMAO such as choline or carnitine have been described (108) and care should be paid when interpreting variations in TMAO concentrations in populations.
The state of validation of biomarkers listed in Table 3 varies widely. Proline betaine is a good example of a well-validated citrus fruit biomarker. Other biomarkers, particularly those identified in controlled intervention studies, may prove to be less robust in populations because of the possible existence of a va-riety of precursors as seen for TMAO, or the occurrence of the same precursor in various foods. Food-derived biomarkers such as caffeic acid sulfate or methylepicatechin sulfate, which were found to discriminate consumers of raspberries (82), may not be
that useful in epidemiologic studies because both their parent metabolites (caffeic acid and epicatechin) have been described in a variety of foods of plant origin (70).
For this reason, it may be particularly advisable to look for characteristic dietary biomarkers directly in cross-sectional studies. However, the chances to identify robust biomarkers will rely both on the sensitivity of the analytic equipment used and on the quality of the dietary data against which metabolic profiles are correlated. Both 24-h dietary recalls and food-frequency ques-tionnaires have been used, and new biomarkers for citrus fruit intake or coffee were successfully identified (49, 88) (Table 3). The use of food-frequency questionnaires may directly lead to the identification of biomarkers of habitual dietary exposure, but the lower accuracy and lower number of foods documented may limit their value for such discovery studies (105).
With the exception of 2 studies on dietary fiber and milk protein diet, all discovery studies were conducted on urine samples as opposed to blood samples (Table 3). The reason for this is partly technical because of the higher concentrations of food-derived metabolites in urine as compared with blood and because of the lack of interfering proteins. This contrasts with the preferred use of blood biospecimens to measure biomarkers of nutritional status in epidemiologic studies. More metabolomic studies using blood samples should be carried out because of the more common availability of plasma or serum samples in biobanks. Also, li-pophilic biomarkers, which may be more stable over time (see Pharmacokinetics and reliability of dietary biomarkers section), are more likely to be found in blood. Regression analyses of the concentrations of 363 metabolites in plasma with a number of dietary variables measured with a food-frequency questionnaire showed the highest correlations with phospholipid concentra-tions (109). Furthermore, chain length and degree of saturation of fatty acids in glycerophosphatidylcholines were associated with intake of specific foods or nutrients such as fish and dietary fiber.
It is important to point out that the identities of many of the proposed biomarkers in Table 3 (marked with an asterisk) have not been fully validated with proper chemical standards because these standards are often not commercially available. In addition, no standard yet exists to report chemical identification of bio-markers in metabolomic studies (110). For this reason, it is often difficult to evaluate the degree of confidence in biomarker identification.
Analysis of the food metabolome
Analyzing the food metabolome is a particularly challenging task for 3 reasons. First, it comprises a much greater chemical diversity than any other part of the metabolome (see Food me-tabolome and metabolite databases section). A second feature of the food metabolome is the huge range of concentrations, from picomolar or nanomolar concentrations for some contaminants or phytochemical metabolites to millimolar concentrations for nutrients such as sugars. Third, many components of the food metabolome are unknown. Indeed, the metabolism for a large proportion of nonnutrients in humans has never been studied and the chemical structures of their circulating metabolites have not been identified. Until recently, the food metabolome was typi-cally analyzed through targeted methods optimized for specific compounds or families of nutrients or nonnutrients, such as
T ABL E 3 T entati v e dietar y biomark ers iden tifi ed throu gh unta rg eted metabol omic ap proaches in human dietar y inter v ention studies an d cro ss-sectional stu dies 1 Diet ary factor and study typ e No. of subj ects Compa rison D ietary assessme nt tool Biosp ecimen Ana lytic techniqu e Biom arker Refere nce Fruit, fru it juices Mix ed-fru it meal AI 8 Consume rs/ cont rol N A U (s pot) NMR Prolin e betai ne (80) Citrus fruit CS 499 Consume rs/ nonco nsumer s 24-h dietar y record U (2 4-h) NMR Prolin e betai ne (80) CS 12 H/M/L FFQ U (fast ing) FIE-F TICR-MS Prolin e betai ne, 4-hyd roxyp roline betai ne (44) Orange juice AI 4 Consume rs/ cont rol N A U (k inetics) L C -Q-T of, L TQ-Orbitra p Prolin e betai ne, limonene -8,9-diol -glucu ronide,* noot katone-13, 14-di ol-glucu ronid e,* hespere tin-3 #-glu curoni de, hydro xypro line betai ne, N -methylty rami ne-sulfate,* naringe nin-7-O -glucu ronide (49) SMTI 12 Consume rs/ cont rol N A U (2 4-h) LC -Q-T of, L TQ-Orbitra p Citrus fruit CS 80 H/L FFQ and 24-h dieta ry reco rd U (s pot) LC -Q-T of, L TQ-Orbitra p CS 107 Consume rs/ nonco nsumer s 24-h dietar y record U (2 4-h) LC -Q-T of Prolin e betai ne, hesperetin-3-g lucu ronide* (81) Raspbe rries SMTI 24 Consume rs/ cont rol N A U (k inetics) FIE-F TICR-MS, GC-T of Caf feic acid-su lfate, met hylepicat echin-s ulfate (82) Stra wber ries CS 107 Consume rs/ nonco nsumer s 24-h dietar y record U (2 4-h) LC -Q-T of 2,5-Di methyl-4-metho xy-3(2H) -fur anone-su lfate* (81) V egetables V eg etabl es CS 160 H/M/L F ood diary U (fast ing) NMR Phen ylacet ylglutam ine (83) Brocco li SMTI 24 Consume rs/ cont rol N A U (k inetics) FIE-F TICR-MS T etr onic acid,* xyl onate/l yxonate,* threi tol/ery thrito l* (82) Crucif erous v eg etabl es SMTI 20 Before/ after N A U (k inetics) N MR S -Meth yl-L -c ysteine sul foxide (84) AI 17 Consume rs/ cont rol N A U (k inetics) L C -Q-T of S u lf o ra p h an e N -acety lc y stein e, N -a cetyl-( N #-b en zyl thi o carba moyl )cy st ei n e, su lf oraphane N -cy steine,* N -acetyl-S -( N -3-met hy lt hiopropyl)c ys te ine,* N -acetyl-S -( N -all ylthiocarb amoyl)c ystei n e,* iberin N -ace tyl-c y steine ,* 4-iminop entylisothioc yanate,* erucin N -acetylc y stei ne* (85) Red cabbage CS 107 Consume rs/ nonco nsumer s 24-h dietar y record U (2 4-h) LC -Q-T of 3-Hydrox y-3-(methyl sulfi n yl)pro panoi c acid,* 3-hyd roxyh ippuric acid-su lfate,* 3-hyd roxyh ippur ic acid,* iberi n N -acetyl-c ysteine,* N -acetyl-S -( N -3-methylt hiopropy l)c ysteine,* N -acetyl-S -(N -ally lthioca rbamoyl )c ysteine,* sul foraphane N -acet ylc ysteine* (81) Beetroot (Con tinued)
T ABLE 3 (Continued ) Dietary factor and study type No. of subjects Co mparison Diet ary assessm ent too l Biosp ecim en Analy tic techn ique Biomar ker Ref erence CS 107 Co nsumers/ nonconsum ers 24-h diet ary reco rd U (24-h) LC-Q -T of 4-E th y l-5 -a m inopyrocatechol sulfate,* 4 -ethyl -5 -methylami nopyro catechol-su lfat e,* 4 -et hyl py ridi ne-2 -carb oxyl ic aci d g lyci n e con ju gate (8 1) Cereals Whol e-grain rye br ead SM TI 20 Co nsumers/ contro l N A U (24-h) LC-Q -T of 3 -( 3 ,5 -D ih y d ro x y p h en y l) -1 -p ro p an o ic ac id -s u lf at e* an d -g lu cu ro n id e, * enterolacto n e-glucuron id e,* azel aic acid ,* 2 -aminoph enol-sulfate, * 2,4-dihy droxy -1,4-be nzoxazin-3-one,* 2-amino pheno l-sulf ate,* 2-4-di hydroxy -1 ,4-benzoxazin -3 -on e-su lfate,* indol y la cryl oyl g lyci ne,* feruli c acid-su lfate,* 3,5-dihy droxy phen ylethano l-sulfa te,* 3,5-dihy droxy cinn amic acid-sulfate* (8 6) Meat and fi sh Red meat CS 160 H/M /L F ood diary U (fastin g) NMR O -Acetyl carnitines (8 3) Sal mon SM TI 24 Co nsumers/ contro l N A U (kineti cs) FIE-FTI CR-MS A nserin e, methylhi stidi ne, trimethyl amine-N -oxid e (8 2 ) O ily fi sh CS 68 H/M /L FF Q U (spot , 24-h, fasti ng) FIE-FTI CR-MS Me thylhist idine (8 7) Be v erages Co ffee CS 18 Co nsumers/ nonconsum ers U (fastin g) LC-Q -T of N -Meth ylpyrid inium, trig onelli ne (8 8) AI 9 Before /after N A U (kineti cs) LC-Q -T of N -Meth ylpyrid inium, trig onelli ne (8 8) CS 68 H/M /L FF Q U (spot , 24-h, fasti ng) FIE-FTI CR-MS D ihydroca ffeic acid (8 7) Ch amomil e tea SM TI 14 Before /after N A U (spot ) NMR H ippuric acid* (8 9) Bla ck tea AI 3 Before /after N A U (24-h) NMR H ippuric acid,* gallic acid, 1,3-di hydro xyphe n yl-2-O -sulfat e* (9 0) T ea (black and gree n) ST I 1 7 C o nsumers/ contro l N A U (24-h) NMR H ippuric acid.* 1,3-di hydro phen yl-2-O -sulfat e* (5 8) G reen tea AI 8 Before /after N A U (kineti cs) NMR H ippuric acid* (9 1) Bla ck tea AI 20 Co nsumers/ contro l N A U (kineti cs) NMR H ippuric acid,* 4-hyd roxyh ippuric acid,* 1,3-di hydro phen yl-2-O -sulfate ,* allic acid, 4-O -met hylgalli c acid* (9 2) (Continued )
T ABLE 3 (Co ntinued ) Dietary factor an d study typ e No . o f subjec ts Co mparison Diet ary asse ssment too l B iospecim en Analy tic techn iqu e Bioma rker Referenc e Mix ed red wine/ grape juice ex tracts SM TI 35 Co nsumer s/control N A U (24-h) GC-M S, LC -MS/MS Hip puric ac id, * 3-hy droxy hippu ri c ac id ,* 4 -hydrox yhip puric ac id, * 4-hy droxy benz o ic ac id,* 1 ,2,3 -t rihyd ro xyb en ze ne,* v an illic acid,* iso v anillic acid,* syr ingic acid,* 3-hyd roxyp hen ylacet ic acid,* 4-hyd roxyma ndelic acid,* v anilm andel ic acid,* ferul ic acid,* 3-h ydrox yp hen y lpro pion ic acid ,* 3 ,4 -d ihy drox yph en y lprop ion ic acid, * 3 -(3 -h yd ro xy ph enyl )-3-h y dro x yp ro pi o n ic aci d ,* cat ec h o l, * p yr og al lo l,* citrate,* b etaine* (93, 94) W ine SM TI 61 Co nsumer s/control N A U (24-h) NMR T artrate,* 4-hyd roxyp hen ylacet ate,* man nitol,* ethan ol* (95) Other foods Cocoa po wde r A I 10 Co nsumer s/control N A U (kinet ics) LC-Q -T of V an il lo y lg ly ci n e, * 6 -a m in o -5 -( N -met hy lf orm y la min o )-1-methyluracil,* 3-meth yl uric aci d,* 7 -met hy luri c acid ,* 3 -met hyl xant hi ne,* 7-me th yl x ant h in e,* di met h y luri c aci d ,* th eob romi n e, caf fe in e, tr ig on el li n e,* hydro xynicot inic acid,* tyros ine, 3,5-dieth yl-2-me thylpyr azine,* hydro xyacetophen one,* diketop iperazines,* epicat echin-s ulfate,* O -met hylepicat echin ,* v anillic acid,* phen ylv aleric acid* and ph en y lv alerol act one* d eri v at iv es, furoy lgl y ci ne,* xant hureni c acid * (96) SM TI 20 Co nsumer s/control and before /after N A U (24-h) LC-Q -T of Hydrox ynicotini c acid,* 6-a mino-5 -( N -methyl formy lamino)-1-me thylurac il,* 7-and 3 -m ethyluri c aci d,* 7 -and 3-met h yl xanth ine,* 3,7-di methylr uric acid,* cy clo(pro pyl alan yl),* 3,5-dieth yl-2-methy lpy razine,* theo bromin e,* v anillic acid-glucuronid e* and -sulfat e-glucuroni de,* v anillo ylglycine,* 4- hydroxy-5-(dih ydrox yphen yl)-v aleric acid-gl ucuron ide* and -sulfat e,* 3# -met hoxy-4 #-h ydrox yphen ylv alerol acton e,* 4# -hydrox y-5-(hydrox ym ethoxyph en yl)v aleric acid-gl ucuron ide,* 5-(3 #,4 #-dihydr oxyphen yl)-g-v alerol acton e-glucu ronide* an d -sulfate * and -sulfat e glucur onide,* (ep i)catechin-glucuroni de* and -sulfat e gl ucuronid e,* met h yl -(ep i) catec hin-sulfate,* N -( 4# -hydroxy-3 #-met hoxy -E -cinnam oyl)-L -aspartic acid,* N -( 4# -hydroxycinnam o yl]-L -aspartic ac id,* methox yhyd roxyp hen ylv aler olactone-glucu ronid e,* hydro xyph en ylv aler olactone-glucuroni de* and -sulfat e,* 5-(hydr oxymet hoxyphen yl)v aleric acid-sulfate,* 4-hyd roxy-5-(phe n yl)v aler ic acid-su lfate* (97) Chocol ate (solid or drink ) CS 107 Co nsumer s/ nonco nsumers 24-h dietary reco rd U (24-h) LC-Q -T of 6-Am ino-5-( N -met hylfor mylami no)-1-m ethylurac il,* theobr omine, 7-methy luri c acid (81) (Conti nued)
T A BLE 3 (Continued ) Diet ary fact or and stu dy type No. of subj ects Comp arison Dietary assessme nt tool Biosp ecimen A nalytic techn ique Biom arker Refer ence Almon d-ski n ex trac t AI 24 Before/ after N A U (kineti cs) LC -Q-T of (Epi )catechin-sulf ate,* O -met hyl-(ep i)catechin-sulfat e,* nar ingenin -O -glucu ronide,* 5-( hydro xyphe n yl)-g-v aler olactone-glucu ronide * and -sulfat e,* 5 -(dihyd roxyph en yl )-g-v al erolactone-g lucuronide, * -su lfate glu curoni de* an d -sul fate, * 5-(tri hy droxy phen y l) -g -v alerolactone-glu curoni de, * 5-(hyd roxymet hox yphen y l) -g -v aler olactone-glucuronide* and sul fat e,* 4-hy droxy -5-(di hydro xyph en yl)-v aleri c acid-g lu curoni de* and sul fat e,* 4-hy droxy -5-(hyd ro xymet hoxy phen y l) v al eric aci d-glu curoni de, * 4-hyd roxy-5 -(met hox yphe n y l)v al eri c aci d-gl ucu roni de,* 4-hyd ro xy-5 -(h ydrox yph en y l)v al eri c aci d-gl ucu roni de and -su lfat e,* 4-hyd ro xy-5 -(p hen y l)v aleric acid -sulfate,* 2 -(dihydro xyph en yl)acetic acid-glucuroni de,* -sulfat e glucuroni de* and -sulfat e,* 2-(hydrox ymetho xyphe n yl)acetic acid-gl ucuron ide,* 2-(hydrox yphen yl)acetic acid-su lfate,* 3-(hydro xyph en yl)pro pio nic acid-glucuroni de,* 3-(dih ydrox yphen yl)pro pionic acid-su lfate,* v anil lic acid-gl ucuron ide,* hydroxyhi ppuric acid,* ferulic acid-glucuroni de* (98) Nuts SMTI 42 Consume rs/con trol N A U (24-h) LC -Q-T of, L TQ-Orbitr ap 10 -H y d roxy decene-4, 6-diyno ic acid-sulf ate, * tridecadieno ic/tridec ynoic acid-glu curoni de,* dodecan edio ic acid,* 1,3-dihy droxy phen yl-2-O -sul fate,* p -co umaroyl alcoh ol-glucu ronid e* and -sulfat e,* N -acetylseroto nine-s ulfate,* 5-hydro xyindo leacetic acid,* urolitin A-glu curoni de, sulfate * and sulfate glu curonide* (56) W alnu ts CS 107 Consume rs/ nonco nsumer s 24-h dieta ry reco rd U (24-h) LC -Q-T of 5-Hydr oxyind ole-3-acetic acid (81) Nutri ents Diet ary fi ber SMTI 77 H/L Diet ary reco rd U (24-h) N M R Hipp uric acid* (99) SMTI 25 Consume rs/con trol N A P (fastin g) LC -Q-T of 2-Am inopheno l-sul fate, 2,6-dihy droxy benzoi c acid, hydro xynu ate geni n-glu curoni de* (100) Whe y protein iso late SMTI 12 Consume rs/con trol N A P (seque ntial) LC -Q-T of T rypto phan, phen ylal anine, k ynuren ine, g-Glu-Leu (101) Whe y hydro lysate SMTI 12 Consume rs/con trol N A P (seque ntial) LC -Q-T of Meth ionine sulphox ide, cy clo(P ro-Thr) , cy clo(A la-Ile), cyclo(Phe-V al) , b -As p-Leu, pGlu -Pro, (101) Diet s Omn iv orous diet SMTI 12 Consume rs/con trol N A U (24-h) N M R T aur ine,* carn itine, * acetylcarnitin e,* 1-methy lhist idine,* 3-methylhi stidine ,* trimethyl amine-N -oxide * (102) V egetarian diet SMTI 12 Consume rs/con trol N A U (24-h) N M R p -Hydr oxyphen ylacetate* (102) Meat protein diet SMTI 24 Before/ after N A U (24-h) N M R T rim ethylamin e-N -oxid e,* histidin e* (103) Seafood AI 17 Consume rs/con trol N A U (kineti cs) LC -Q-T of T rim ethylamin e-N -oxid e (85) (Con tinued)
lipids, organic acids, sugars, flavonoids, or carotenoids. How-ever, the combination of available targeted analysis methods is still far from covering the whole chemical space of the food metabolome. In principle, untargeted metabolomics provides a wider coverage and is likely to show the presence of new metabolites in biofluids and tissues.
As is the case for the other parts of the metabolome, mass spectrometry (MS) coupled with gas chromatography or liquid chromatography and NMR are currently the most widely used technologies for food metabolome analysis (Table 3). The ad-vantages and disadad-vantages of these techniques have been ex-tensively discussed elsewhere and are beyond the scope of the present review (111–113). Briefly, NMR is robust, nondestructive, and quantitative but has a relatively low sensitivity, which narrows its coverage of the food metabolome to predominant nutrients, sugars, and microbial metabolites present at millimolar to mi-cromolar concentrations. MS is by far the most sensitive tech-nique and the only method able to cover the nonnutrient metabolites of the food metabolome occurring at low concen-trations in biological samples. GC-MS combined with chemical derivatization has been used to analyze constituents of the food metabolome such as phenolic acids or fatty acids (79, 93, 94). However, to date, most studies on the food metabolome have been performed by using high-resolution liquid chromatography-quadrupole-time-of-flight MS with electrospray ionization (Table 3). This technique has been successful in detecting compounds such as terpene metabolites, diketopiperazine me-tabolites, phenylvalerolactones, and benzoxazinoid meme-tabolites, which are interesting candidate biomarkers of food intake that would not be easily detected in biofluids by NMR or GC-MS (49, 86, 96). No single chromatographic method is able to cover the wide range of polarity existing for the food metabolome compounds. Highly polar compounds may have to be analyzed by using hydrophilic interaction chromatography, whereas spe-cific methods with atmospheric pressure chemical ionization may be developed for profiling apolar plasma metabolites. Di-rect flow injection-MS has also been used (82, 114), which of-fers the advantage of high-throughput analysis, as would be required for large-scale epidemiologic studies. However, ion suppression effects, due to inefficient ionization of certain ions in complex matrices and the inability to discriminate between isomers, limit the use of this approach.
The main current limitation of MS is the very challenging and burdensome task of the structural elucidation of the detected ions (see below). However, because of its sensitivity and breadth of coverage, LC-MS has certainly become the method of choice for untargeted analysis of the food metabolome. Rapid advances in technology have led to a new generation of much more efficient time-of-flight and single-stage Orbitrap (Exactive; Thermo Sci-entific) instruments, offering improved linearity, resolution, and mass accuracy, which will be critically important for the analysis of the food metabolome (115). As with any experimentally based analytic method, multiple variables can substantially affect the final data set. These include the mode of sample preparation, method of chromatography, mode of detection, and the choice of data reduction methods (116, 117). No standardized method exists yet, and the need for improved harmonization is certainly desirable for further progress on the food metabolome.
Achieving absolute quantification rather than relative quantifi-cation of food metabolome metabolites via untargeted methods
T ABL E 3 (Co ntinued ) Diet ary factor and study typ e No. of subj ects Compa rison D ietary assessme nt tool Biosp ecimen Ana lytic techniqu e Biom arker Refere nce Milk protein diet SMTI 24 Before/ after N A S (fastin g) NMR Shor t-chain fatty acids* (103) Omni v o rous diet CS 161 Consume rs/control Quest ionnaire U (fast ing) NMR T ri m et h y la m in e-N -o x id e, * d im et h y la m in e, * p h en y la la n in e, * m et h y lh is ti d in e* (104) Lacto v egetari an diet CS 161 Consume rs/control Quest ionnaire U (fast ing) NMR Citrat e* (104) Phyto chem ical-rich diet (citrus, cru ciferous v eg etabl es, soy) SMTI 10 Consume rs/control N A U (s pot) LC -FTICR -MS Sulfora phane,* proline betai ne,* hippuri c acid,* geni stein,* daid zein,* eq uo l,* g ly ci tein,* O -d esm et h y lang o le n sin,* entero lact on e,* trig o n ellin e* (105) CS 60 H/L Dietary reco rd U (s pot) LC -FTICR -MS Prolin e betai ne* (105) Nordi c diet SMTI 107 Consume rs/control 24-h recall and superm arke t reco rds U (fast ing) LC -Q-T of T rime thylami ne-N -oxide , hydro quinon e-glucu ronide , hippuri c acid, (2-o xo-2,3-dihydro-1H-indol-3-yl)ac et ic acid, 3 ,4,5,6-t etrahydrohi ppurat e* (106) 1*No standar d was used to confi rm the iden tity of the biomark er . AI, acu te inte rv ention; CS, cross-se ctional; FFQ, food-frequenc y questio nnaire; FIE , fl o w inje ction electrospray; FT ICR, F ourier transform ion cyclo tron resona nce; G C , gas chrom atograp hy; H/L, hig h an d lo w (intake) ; H/M /L, high, med ium, and lo w (intake ); LC , liquid chrom atograp hy; MS, m ass spectro metry; N A , not ap plicabl e; NMR , nuclear mag netic res onance spectro scopy ; P, plasma ; Q , quadru pole; S, serum ; S M TI, short -and med ium-t erm interv ention; T of, time-o f-flig ht; U, urine.
remains a continuing challenge. It is essentially impossible to use standards or isotopically labeled references to quantify the thou-sands of compounds in the food metabolome. New approaches are being developed with isotope labeling and multiple reaction monitoring–based profiling for families of compounds sharing distinctive chemical functionalities (118). Labeled reagents tar-geted at these functionalities or particular multiple reaction monitoring transitions could be used to specifically measure se-lected fractions of the food metabolome such as amines, phenols, glucuronides, or mercapturic acid derivatives. These advances may allow researchers to target larger areas of the food metabolome chemical space with the use of standardized quantitative methods.
Analysis of metabolomic data
The metabolic profile of raw data generated by the spectro-metric analysis of biological samples can be analyzed in several steps (119, 120). These include data preprocessing, data align-ment, data normalization, and signal correction followed by the analysis through various statistical methods. There are a number of different software tools available for these tasks; most vendors have their proprietary software but highly efficient freeware programs, Web servers, or add-on softwares exist. For NMR, an example is the Interval Correlation Optimized shift algorithm produced for Matlab (121), and for LC-MS data alignment freeware such as XCMS (122), MZmine (119, 123), and Met-Align (124) are widely used.
The preprocessing step is software dependent and typically includes data reduction methods such as centroiding of mass spectra or analog-to-digital conversion of NMR, infrared, or UV/ visible spectra. Preprocessing also includes translation of data formats and data export. The next step is data alignment. It is crucial to align the different sample profiles, which do not match exactly because of small variations in retention times, masses, or chemical shifts. All available software tools differ in their peak picking algorithms. There is only a 50–70% overlap between the peaks detected by different packages from the same raw data set, even with similar settings (125). Additional markers may be observed by using additional softwares or simply by altering software settings. Another major difference between packages is the presence or absence of so-called gap filling, a routine to revisit the raw data for any peak that has not been detected in a sample when it was found in others. The lack of a gap-filling algorithm creates major problems for normalization and for statistical analysis. An ideal food intake marker would have a zero value in control samples from volunteers who did not consume the food; in this case, the gap-filling routine helps to estimate the background noise in the peak area.
The output from the peak detection and data alignment steps is typically a matrix of samples and features with the intensity as the values within the matrix structure. A feature here denotes any distinct peak in the data set, regardless of whether it represents a known, unknown, or even an artifact ion. In LC-MS profiling, the features are characterized by a retention time and a mass (m/z) value. Such a feature may be a compound’s parent ion, but just as frequently it represents an adduct ion or a fragment from a compound. In NMR and in most other digitized spectral data the single features are part of spectral shapes that usually have local maxima and minima. For both kinds of data the fine structure of the data contains additional information that is useful for identifying
compounds and structures in the samples and is therefore partic-ularly important for characterizing the food metabolome.
Metabolic profiling data may be analyzed by using univariate or multivariate statistical methods. Statistical analysis of untargeted metabolomic data is often an initial step in the biomarker discovery process that should not be confused with hypothesis testing, be-cause there is no a priori hypothesis. In dietary intervention studies with single foods, the contrast observed for a good biomarker can be large, sometimes even infinite, making it possible to work robustly with small sample sets and discriminate potential intake biomarkers from more subtle changes in endogenous metabolites (126). In cross-sectional studies this large contrast seldom applies, but ap-proximate dose-response relations from food-frequency question-naires may help in the identification of food intake biomarkers.
Multivariate analysis is most commonly used for explorative analysis of metabolic profiling data (127). As opposed to uni-variate analysis, multiuni-variate analysis can be performed in an unsupervised manner (ie, without including information on group assignment for the analysis). This provides an objective as-sessment of the principal patterns in the data set (eg, intake or no intake of a specific food component or diet). Unsupervised analysis such as principal components analysis (PCA) should always be the starting point for explorative multivariate analysis to ascertain that there is an overall segregation into a food-related pattern. The features associated with any pattern can be shown by the loadings in a PCA plot; however, PCA is generally not well suited to identify the most prominent part of the pattern. Sparse PCA overcomes this limitation (128, 129). Clustering methods are also widely used for subdividing and ordering a data set into groups of data with a high degree of similarity. Hierarchical clustering generates a dendrogram in which neighboring samples share the greatest similarity and neighboring features are those most closely related. This provides useful biological information and unsupervised groupings of the data set (130).
Supervised multivariate analysis is commonly the next step in many data analysis methods but has a strong tendency to overfit the data. Even random data will usually segregate and show a “marker pattern” after supervised analysis (131). Careful validation with the use of techniques such as permutation testing and cross-validation is therefore always necessary. There are a large number of supervised methods (120, 127), with the most commonly used analysis for comparing 2 groups being partial least-squares discriminant analysis (PLS-DA) (132) or one of its several variants. In complex nutritional studies it may be useful to combine ANOVA separations of factors with PLS-DA (133, 134) or use multilevel PLS-DA to reduce the influence of in-terindividual variation (135). Some multivariate methods such as PLS are mainly used to fit the data to a continuous variable. This is useful to explore the relation of any features in the profiling data set with an external variable (eg, intake of a specific food based on a questionnaire or any biological outcome marker) (121). In addition, for these prediction models very careful validation is required and their global ability to predict a specific food intake has to be assessed in separate studies.
Univariate analysis is supervised—that is, a hypothesis re-garding a difference between groups is implicit. Any marker identified by this approach should therefore also be in-dependently validated in a separate study. For univariate analysis used in exploration of new food intake biomarkers it is impor-tant to set a reasonable threshold for false discovery rates
(FDRs) (136, 137). In explorative science there is no fixed rule for the acceptability level of the FDR, and any level from 5% to 50% may be useful, depending on further data analysis steps. If no additional data analysis is planned as, for instance, in metabolome-wide association studies (MWASs), the FDR should generally be selected in the lower end of this range. If the univariate data step is used for selection of features that will be analyzed further (eg, by multivatiate models), it may be more appropriate to use a higher FDR. In any case, the markers found must be validated in subsequent independent studies.
Overall, the field of metabolomics is rich with data analysis options, and the challenge in the future will be to optimally apply these to food metabolomic studies. Useful resources exist to help in selecting and using in the most rigorous way appropriate tools for data analysis in a particular project (138).
Metabolite identification
Metabolite identification in metabolomic studies relies on the comparison of generated spectra with those in curated metabolite databases. However, the vast majority of the food metabolome components are not yet represented in these databases, which makes the elucidation of their structure difficult. As previously described, the identification of candidate dietary biomarkers is complicated by the fact that the majority of food compounds are treated as xenobiotics by the human body in phase I and phase II reactions or undergo fermentation in the colon by the gut microbiota (139). Despite some increase in their availability over the past few years, these highly diverse metabolites are largely absent from most databases. One exception is Phenol-Explorer, which gives a comprehensive overview of the human and animal metabolites formed from polyphenols (70).
NMR spectroscopy and MS are the 2 essential tools for elu-cidation of the structure of unknown metabolites in metabolomic studies (140, 141). Metabolites such as S-methyl-L-cysteine sulfoxide or proline betaine as biomarkers of cruciferous vege-tables or citrus fruit, respectively, could be identified in NMR studies on the basis of their characteristic chemical shifts (Table 3) (80, 84). More markers of food intake have been identified in MS-based metabolomic studies on the basis of their accurate mass and mass fragmentation spectra (142–144).
A number of commercial and “in house” software tools have been developed recently and used to recognize and identify fragments and adducts derived from one food metabolite (97, 114, 145). These tools are particularly useful to identify phase II conjugates, common constituents of the food metabolome, which show characteristic neutral losses (eg, 79.957 amu for sulfate conjugates and 176.032 amu for glucuronides) (44, 114, 140). Customized in-house databases on the most likely phase I and phase II metabolites have also been developed based on in silico prediction with expert systems such as Meteor (49, 146– 148). An important challenge for the future will be the de-velopment of a coordinated international effort to extend existing and develop novel software tools and databases allowing the more “intelligent” prediction of the metabolic fate of food constituents.
Spectral databases for the food metabolome
Despite the many initiatives to make spectral data sets available to the scientific community, the publicly accessible
existing spectral data are still scattered over numerous Web-based (searchable) databases, printed tables in scientific journals, Excel files in supporting information, and scientific books (140, 149, 150). As described earlier, the major online chemical resources (typified by PubChem, Kyoto Encyclopedia of Genes and Ge-nomes, and ChemSpider) contain limited information on human metabolites derived from food compounds. Although they are not specific to the food metabolome, these resources are useful for metabolite identification because fragmentation data or NMR signals of known metabolites can be compared with the unknown query to gain structural information. The most comprehensive and best-curated chemical (commercial) database is currently SciFinder, which includes many food metabolome compounds collected from the literature (151). Recently, a large number of food compounds have been added to the HMDB, which makes searches on the basis of their accurate masses possible (9); however, to date it contains few mass fragmentation spectra useful for food metabolite identification.
The robust and reproducible fragmentation patterns and re-tention times of volatile metabolites in GC-MS have successfully been used to set up metabolomic workflows that search for possible candidate metabolites in the National Institutes of Standards and Technology library or in-house libraries (152). Recently, similar approaches have been proposed for LC-MS– and NMR-based metabolomic data sets. Spectral databases contain fragmentation spectra obtained in different experimental conditions (eg, several collision energies and different mass spectrometers) to facilitate direct comparison with experimental data (141). Also, the number of metabolite spectra in Chem-spider and HMDB is increasing. Even though not specific to the food metabolome, these resources are particularly useful for metabolite identification because fragmentation data or NMR signals of known metabolites can give structural hints for the unknown query.
Software tools for annotation of the food metabolome Software tools such as MetFrag, MyCompoundID, MetiTree, and Mass Frontier can handle metabolite fragmentation data and permit library searches for potential candidates using in silico fragmentation predictions of metabolites or comparisons to previously fragmented metabolites or standards (146, 153–155). MetFusion combines knowledge from spectral databases such as MassBank with the multitude of candidates generated by frag-menters such as MetFrag (156).
Software tools have also been developed that integrate me-tabolite annotation directly within the processing pipeline of LC-MS data (157). For example, CAMERA is a pipeline for the annotation and analysis of LC-MS data in cooperation with XCMS (158, 159). Online MS/MS fragmentation, UV spectra, and estimates of partition coefficients based on retention time have been used to further investigate metabolite structures (157, 160, 161). The MagMA software package recently launched is able to read multistage tandem mass spectral data to add potential candidates based on in silico–predicted fragmentation (162). In particular, the use of accurate fragmentation mass data as input can enhance the metabolite identification process by selecting the most likely candidates on the basis of similarities in frag-mentation pathways and their readily assigned elemental for-mula with the unknown query metabolite as exemplified by