All-Optical Interferometric Switches for Data
Regeneration in Fiber Optic Networks
by
Shelby Jay Savage
Submitted to the Department of Electrical Engineering and Computer
Science
in partial fulfillment of the requirements for the degree of
Doctor of Philosophy in Electrical Engineering
at the
MASSACHUSETTS INSTITUTE OF TECHNOLOGY
@
Massachusetts Institute
May 2007
of Technology 2007. All rights reserved.
Author .
... ,... ...-. ... ...Department of Eectri l Engineering and Computer Science
May 22, 2007
Certified by ...
Certified by...
Accepted by . .
... ...Erich P. Ippen
Elihu Thomson Professor of Electrical Engineering
Thesis Supervisor
.. . . . .Scott A. Hamilton
MIT Lincol Laboratory, Assistant Group Leader
_
,ThesgSupervisor
Arthur C. Smith
Chairman, Department Committee on Graduate Students
PARCH1vEjS
MASSACHUsfr INSfirr
OF TECHNOLOGY
AUG 1 6 2007
All-Optical Interferometric Switches for Data Regeneration
in Fiber Optic Networks
by
Shelby Jay Savage
Submitted to the Department of Electrical Engineering and Computer Science on May 22, 2007, in partial fulfillment of the
requirements for the degree of
Doctor of Philosophy in Electrical Engineering
Abstract
In the thirty years since the installation of the first fiber optic data link, data rates in installed fiber links have risen from a few Mb/s to tens of Gb/s. In the laboratory, data rates in a single optical fiber have already reached tens of Tb/s. These data rates greatly exceed electronic processing rates, so researchers have turned to all-optical signal processing to achieve many basic network tasks, like wavelength conversion, packet switching, and data regeneration.
As data rates increase, the impairments caused by propagation through the glass of optical fiber become worse. Chromatic dispersion causes the temporal broaden-ing of optical bits durbroaden-ing propagation, leadbroaden-ing to interference between neighborbroaden-ing bits. Nonlinear effects, like the nonlinear index of refraction and four-wave mixing, can cause interference between neighboring wavelength channels. The interaction of dispersion and nonlinearities can lead to variations in the timing of bits and the appearance of optical energy where there had been none.
All these effects make 1-bits and 0-bits difficult to distinguish. Today, these dis-tortions are overcome by electronic regenerators. Optical data streams are converted to electrical signals, processed electronically, converted back to an optical signal, and returned to the optical network. In this way, regenerators prevent the accumulation of noise and prevent noise from contributing to the production of more noise. The electronic solution is costly because of the extra hardware required for optical to elec-trical to optical conversions and performs poorly because of the losses incurred by those conversions.
In this thesis, we investigate two regenerators that restore the data quality of ON/OFF keyed data without a conversion of the data to the electrical domain. Both regenerators are based on all-optical switches that take two inputs: the data pulses from the network, and a locally generated clock-pulse train. The all-optical switches then modulate the data pattern onto the clock-pulse train, which becomes the new data stream.
The first switch we consider, the WMFUNI, uses the nonlinear properties of fiber to produce the switching action. Using the WMFUNI regenerator, we demonstrate
the propagation of 10 Gb/s data over 20,000 km of commercial optical fiber. We also demonstrate the WMFUNI's ability to operate on 40-Gb/s data. Unfortunately, fiber has only a weak nonlinearity, so the WMFUNI is large (-40 cmx40 cm).
The second switch uses the much stronger nonlinearity of a semiconductor optical amplifier (SOA). SOA-based switches can be integrated onto chip-scale optics. The switch we test, the SOA-MZI, fits on a ~0.5 cmx1 cm chip. Using the SOA-MZI regenerator, we demonstrate the propagation of 10 Gb/s data over 10,000 km of commercial optical fiber. We also show in simulation that the SOA-MZI's operation may be extended to 40 Gb/s.
Thesis Supervisor: Erich P. Ippen
Title: Elihu Thomson Professor of Electrical Engineering Thesis Supervisor: Scott A. Hamilton
Acknowledgments
This dissertation is the labor of many, including the engineers directly involved in my research and the friends and family who gave me encouragement and hope throughout my graduate studies. I know how much of my success I owe to others, and it is my pleasure to acknowledge them here.
It has been a great privilege to work with Professor Erich Ippen, whose patience and knowledge have been great sources of support for all seven years that he has been my advisor. His broad interests outside engineering have been a model for my own academic career. I also thank Professor Franz Kdrtner for his service on my thesis committee and for the kindness I have known from him since my undergraduate days at MIT.
I was fortunate, when I needed it the most, to find an excellent supervisor at Lincoln Laboratory. Scott Hamilton has been my mentor and friend almost from the beginning of my graduate work. His boundless energy and sincere concern for my education were indispensable to the completion of my Doctorate. I was also fortunate to find fellow students to share my work in. Dr. Bryan Robinson has been a constant source of ideas and intuition. I have always enjoyed our mathematical, religious, and political discussions, which have enriched my life at MIT. Jade Wang has shared with me all the trials and uncertainties of graduate school, and without that shared experience and mutual concern I am sure I could not have finished this thesis. I learned much of what I have presented here from our daily struggles with the theory and equipment of our field.
Working at Lincoln Laboratory was the best academic choice I made at MIT. I thank Dr. Johnathan D. Moores for first introducing me to optical communications. His intelligence and kindness helped me decide to stay at MIT. I also thank Dr. Todd Ulmer for his friendship, advice, and musical talents. Many others at Lincoln Laboratory have contributed to this work, including Prof. Thomas Murphy, Dr. David Caplan, Dr. Steve Constantine, Chad Demers, Peg Danek, Claudia Fennelly, and Dr. Jeffrey Roth. I also thank my group leaders, Dr. William Keicher and Dr.
Donald Boroson, for supporting my work throughout my education.
A large share of credit for the completion of this thesis also belongs to those friends who reminded me unceasingly that life is more than engineering. I am thankful that Andy Copeland has been with me all the way through undergraduate and graduate education; there aren't many of us left from those first years at MIT. I thank John McKay for many wonderful conversations and long friendship. Jamie Byrum and Garrett Cradduck have always encouraged me by reminding me of the world that awaits me outside academics. I also thank Susanna Mierau, Lora Reineck, Andrew Shtulman, Christina Silcox, and Ryan Hall for their friendship through the years.
I owe an unpayable debt to my father, my mother, and my brother. My father is an engineer himself and first sparked my own interest in the world of machines. He has always been a great source of peace in my restless life. My mother is devoted to her sons. She pushed us to succeed and gave us everything we needed and more than we deserved. Her industry and keeness have always been a model for me. My brother, one year younger than I am, is my only lifelong friend and peer. I always wish him the best and am thankful for his unique place in my life.
To everyone I have mentioned and to those I have forgotten, I offer this thesis with the hope that it is worthy of our efforts. But still, vitae summa brevis, spem nos vetat incohare longam.
Contents
1 Introduction 23
1.1 Networks and Fiber Propagation . . . . 24
1.2 Regeneration of Optical Data . . . . 26
1.3 Organization of Work... . . . . . . . . 31
2 Overview of Regeneration 37 2.1 Classes of Regenerators . . . . 37
2.1.1 Intensity Self-Switches: Gain Modulation . . . . 38
2.1.2 Intensity Self-Switches: Self-Phase Modulation . . . . 40
2.1.3 Synchronous Modulation . . . . 42
2.1.4 Interferometric Switches . . . . 45
2.2 The Nonlinear Mach-Zehnder Regenerator . . . . 47
2.2.1 Mach-Zehnder All-Optical Switch . . . . 47
2.2.2 Clock Recovery . . . . 52
3 Nonlinear Media 57 3.1 A Brief Introduction to Nonlinear Optics . . . . 58
3.2 Optical Fiber . . . . 65
3.2.1 The Intensity-Dependent Index of Refraction . . . . 67
3.2.2 D ispersion . . . . 73
3.2.3 The Nonlinear Schr6dinger Equation. . . . ... 77
3.2.4 Effects of Loss on Phase Shift . . . . ... . . . . 85
3.2.5 Numerical Solution to the NLS.... . . . ... 87
3.3 Semiconductor Optical Amplifiers . . . . 90
3.3.1 Basic M odel . . . . 92
4 Wavelength-Maintaining Folded Ultrafast Nonlinear Interferometer 99 4.1 The Folded Ultrafast Nonlinear Interferometer ... 100
4.1.1 FUNI description ... ... 101
4.1.2 Choice of Nonlinear Medium in the FUNI . . . . 104
4.1.3 The FUNI as an All-Optical Switch . . . . 113
4.2 FUNI Regenerator Performance . . . . 115
4.2.1 Re-am plification . . . . 116
4.2.2 Reshaping . . . . 117
4.2.3 Retim ing . . . . 119
4.2.4 Repolarization . . . . 120
4.3 Wavelength Maintaining FUNI . . . . 121
4.3.1 SOA Wavelength Converter . . . . 122
4.3.2 Wavelength-Maintaining FUNI Switching Performance . . . . 125
4.3.3 WMFUNI Regenerative Buffer . . . . 130
4.4 Transmission Experiments in a Recirculating Loop.... . . . . . . 132
4.5 40-Gb/s Operation of WMFUNI . . . . 141
4.6 Conclusions.. . . . . . 143
5 SOA Mach-Zehnder Interferometer 151 5.1 SOA-MZI Model for Simulations . . . . 152
5.1.1 SOA M odel . . . . 153
5.1.2 SOA-MZI Model . . . . 155
5.1.3 Model of Pre-Amplified Receiver . . . . 156
5.1.4 Estimation of BER Performance of the SOA-MZI . . . . 159
5.1.5 Adding Noise to the SOA Models . . . . 165
5.2 Simulation of a Cascade of SOA-MZIs . . . ... ... 170
5.2.1 SOA-MZI Cascade at 10 Gb/s . . . . 171
5.2.2 SOA-MZI Cascade at 40 Gb/s . . . . 174
5.3 Integrated SOA-MZI . . . . 180 5.3.1 SOA Mach-Zehnder Interferometer . . . . 180 5.3.2 The Wavelength-Maintaining SOA-MZI All-Optical Regenerator 184 5.4 Conclusions . . . . 187
6 Future of All-Optical Data Regeneration 195
6.1 Choice of Nonlinear Medium . . . . 196 6.2 Possibility of an Opto-Electronic Solution . . . . 197 6.3 Transmission without Regeneration . . . . 198
List of Figures
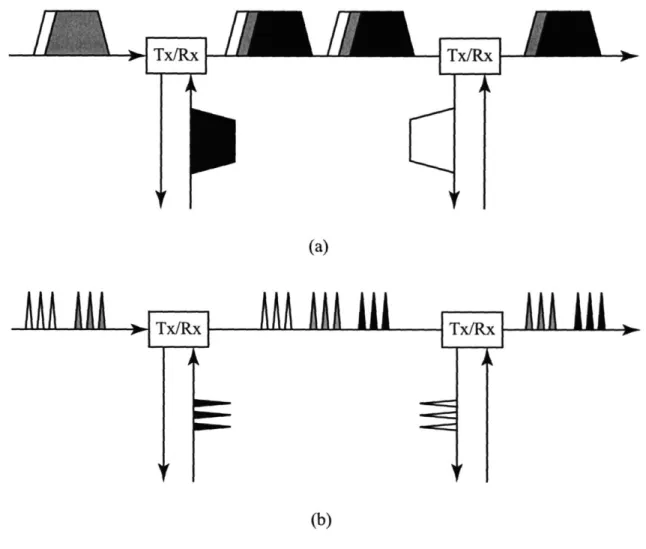
1-1 Two methods of multiplexing data: (a) wavelength-division multiplex-ing and (b) slotted optical time-division multiplexmultiplex-ing. . . . . 25
1-2 Simulation of the propagation of 2.5-ps wide pulses through 240 km of TrueWave optical fiber. The dispersion compensation module perfectly compensates any chromatic dispersion added by the TrueWave fiber, and the amplifiers are assumed to be noiseless. . . . . 27
1-3 The thresholder is a simple regenerator that extinguishes noise in the Os and restores is to their proper intensity. The top diagram shows an ideal thresholder acting on distorted data pulses. The bottom diagram shows a more realistic thresholder . . . . 28
1-4 Schematic for an electronic regenerator. The regenerator boxes may also include network routing or other functionality. . . . . 30
1-5 Schematic for a broad class of all-optical regenerators. In this case the clock pulses (black) are modulated with the original data pattern. In some regenerators, however, the clock pulses are used to improve the quality of the incoming data pulses, rather than replace them. .... 30
2-1 (a) Saturable absorbers can be used to produce all-optical switches. (b) The 2R self switch has an intensity-dependent transmittance, as
2-2 Experimental data showing the degradation of the Q-factor of a 40-Gb/s data stream versus propagation distance both with (solid) and without a cross-gain modulation regenerator (dashed). This plot comes
from Figure 4 of Rouvillain, et al., OFC, 2002 [3]. . . . . 39
2-3 (a) Schematic of a 2R all-optical regenerator based on self-phase mod-ulation. The plots show the pulse spectra at the input, at the end of the fiber, and after the band-pass filter. (b) Desired input-output response of this regenerator. . . . . 41 2-4 Output pulse intensity of the SPM regenerator versus input pulse
inten-sity after one stage of the regenerator (dotted) and two stages (solid). The plots are experimental data from Figure 2 of Mamyshev, ECOC,
1998 [4]. . . . . 42 2-5 (a) Schematic of the synchronous modulator. (b) Effect of the E/O
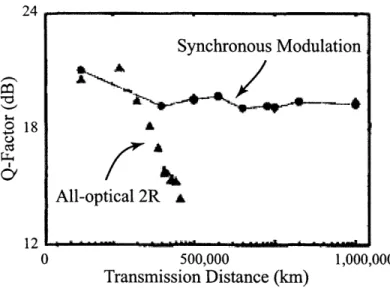
modulator on the pulse timing. . . . . 43 2-6 Plot of the Q-factor of data pulses as a function of propagation
dis-tance. One plot (triangles) shows the evolution of
Q
with a 2R re-generator, and the other (circles) shows the evolution ofQ
with 3R synchronous modulation. This plot comes from Figure 3 of Raybon, et al., O FC, 2002 [5]. . . . . 44 2-7 (a) Schematic of interferometer-based regenerator. Cross-phasemod-ulation (XPM) is used to imbalance the interferometer. (b) Output pulse intensity versus input pulse intensity, showing the raised-sine re-sponse typical of interferometers. . . . . 45 2-8 Bit-error rate data showing the performance of an MZI-based
regen-erator at 10 Gb/s over 1,250,000 km of propagation. The plots show the number of errors per bit as a function of the optical power input into an optical receiver. The optical data are regenerated after every 125 km of propagation. These data come from Figure 6 of Zhu, et al., Photonics Technology Letters, 2006 [10]. . . . . 46 2-9 Nonlinear Mach-Zehnder interferometer. . . . . 48
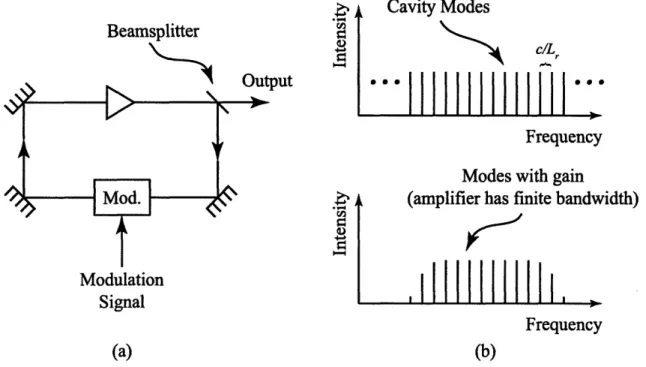
2-10 Normalized output intensity of the nonlinear Mach-Zehnder interfer-om eter versus <be,. . . . . 51 2-11 (a) Schematic of a ring laser. (b) The top plot shows the cavity
fre-quency modes and the bottom plot shows the cavity modes with net gain . . . . 53
2-12 Clock recovery circuit based on the Fabry-Perot filter. The filter fills in the Os with pulses, and the semiconductor optical amplifier (SOA)
equalizes the pulse intensities. . . . . 54
3-1 Figure of the cross-section of an optical fiber. The core's higher index of refraction allows total internal reflection. . . . . 65
3-2 The top plots show the effects of second- and third-order dispersion on the intensity envelope. Second-order dispersion broadens the pulse width, and third-order dispersion causes ringing in one of the tails. The bottom plot shows the effects of the nonlinear index of refraction on a pulse's spectrum. The spectrum continues to broaden with more propagation. . . . . 66
3-3 The split-step Fourier method of solutions involves alternate applica-tions of the linear and nonlinear operators. Linear steps are labeled with an "L" and nonlinear steps are labeled with "NL." The axis shown is the discretized spatial axis. . . . . 89
3-4 (a) The SOA is a pn-junction designed to produce gain. (b) Het-erostructure designs trap carriers in a potential well in the active region. 91 3-5 The three basic SOA processes are (a) absorption of light, (b)
stimu-lated emission of light, and (c) spontaneous emission of light. . . . . . 91
4-1 Schematic of a fiber link with data regeneration. . . . . 99 4-2 In the folded UNI, a Faraday mirror provides polarization stabilization.
PCI and PC2 are polarization controllers. The nonlinear medium is ~ 1 km of dispersion shifted fiber. . . . . 102
4-3 This plot shows the relative positions in time of a signal pulse and three possible control pulses with jitter, all at the beginning of the DSF. Each control pulse moves 4 ps with respect to the signal pulse, guaranteeing signal-control overlap during propagation through the DSF 105 4-4 Experimental setup for dispersion measurement. The polarization
con-troller adjusts the polarization of light from the continuous wave source to the polarization axis of the electro-optic modulator. An RF driver modulates a sine wave onto the CW light, which then passes through the test fiber. An oscilloscope or network analyzer then measures the relative propagation delay through the fiber as a function of wavelength. 106 4-5 Dispersion data for (a) the 530-m spool used in this section and (b)
the 1100-m spool used in Section 4.3. . . . . 108
4-6 Experimental setup for switching window measurement. Two mode-locked fiber lasers provide the input pulse trains at slightly offset pulse frequencies. The oscilloscope, triggered at the offset frequency, displays the switching window. . . . . 109
4-7 Switching windows for the FUNI (a) with 530 m of DSF as its nonlinear medium, and (b) with 1100 m of DSF as the nonlinear medium. In both cases the principle peak is 4.1 ps wide at its half-maximum point. 110 4-8 Dispersion data for the fiber used in the experiments shown in Figure 4-9.112 4-9 Switching windows of the 2 km fiber at a control-pulse carrier
wave-length of (a) 1552.1 nm and (b) 1556.3 nm . . . . 113 4-10 Experimental setup for bit-error rate measurements of the FUNI and
other all-optical switches . . . . 114 4-11 Bit-error rates of both the FUNI output and the transmitter
back-to-back plotted as a function of the optical power at the receiver input. Also shown are linear fits minimizing the mean squared error. .... 115 4-12 Normalized output pulse energy of FUNI with respect to input pulse
4-13 (a) Intensity autocorrelation, A(T), of the FUNI's output pulse. This autocorrelation's full-width at half maximum is 4.53 ps. If we assume a Gaussian shape to the pulse, the intensity full-width at half maximum of the pulse itself is 3.20 ps. (b) Intensity of the output pulse's spectrum plotted versus wavelength (v = c/A). The intensity full-width at half maximum is 1.22 nm or 155.4 GHz. . . . . 118
4-14 Plot of bit-error rate of the FUNI output versus the delay between the data pulses and the clock pulses. The optical energy per bit at the receiver was 6.3 aJ/bit or 26.9 dBphotons/bit. . . . . 119
4-15 By changing the control polarization with the polarization controller (PC), we can measure the FUNI's sensitivity to input polarization. . 121 4-16 A wavelength converter (A-conv.) changes the control pulse wavelength
from 1547.5 nm to the auxiliary wavelength of 1557.5 nm. . . . . 122
4-17 Schematic of the SOA wavelength converter. Two optical signals couple together into an SOA, the output of which passes through a notch filter, a band-pass filter, and an optical amplifier. . . . . 123
4-18 (a) Intensity autocorrelation, A(T), of the SOA wavelength converter's output pulse. The autocorrelation full-width at half maximum is 6.63 ps. Assuming a Gaussian pulse, the pulse's IFWHM is 4.69 ps. (b) Inten-sity of the output pulse's spectrum plotted versus wavelength. The IFWHM is 0.95 nm or 119 GHz. . . . . 125
4-19 Bit-error rate performance of the wavelength converter compared to a transmitter back-to-back BER. . . . . 126
4-20 (a) Intensity autocorrelation, A(T), of the WMFUNI's input pulses. The autocorrelation full-width at half maximum is 4.97 ps. Assuming a Gaussian pulse, the pulse's IFWHM is 3.51 ps. (b) Intensity of the input pulse's spectrum plotted versus wavelength. The IFWHM is 1.01 nm or 126 GHz. . . . . 127
4-21 (a) Intensity autocorrelation, A(r), of the wavelength-maintaining FUNI's output pulse. The autocorrelation full-width at half maximum is 4.57 ps. Assuming a Gaussian pulse, the pulse's IFWHM is 3.23 ps. (b) Inten-sity of the output pulse's spectrum plotted versus wavelength. The IFWHM is 1.3 nm or 162 GHz. . . . . 127 4-22 Bit-error rates curves for the SOA wavelength converter and for the
WMFUNI, both compared to the transmitter back-to-back BER curve. 128 4-23 Setup used to test sensitivity of WMFUNI to polarization at the control
input. ... ... 129
4-24 Comparison of bit-error rate performances at a fixed optimum polar-ization with a scrambled input polarpolar-ization in (a) the SOA wavelength converter and (b) the WMFUNI. . . . 130 4-25 Schematic of a regenerative buffer using the wavelength-maintaining
F U N I. . . . 131 4-26 Bit-error rates of several loop passes through the WMFUNI
regenera-tive buffer. . . . 133 4-27 Schematic of the 100-km recirculating loop using the wavelength-maintaining
FU N I. . . . . 134 4-28 Cross-correlations of pulses through 100-km recirculating loop after 0
through 63 successive passes. The three smaller plots zoom in on pulses after passes 0, 10, and 20 passes. . . . . 136 4-29 Cross-correlations of pulses through 100-km regenerative recirculating
loop after 0 through 119 successive passes. The three smaller plots zoom in on passes 0, 50, and 119. . . . . 137 4-30 Bit-error rates after 100- and 200-loop passes through the WMFUNI
recirculating loops, corresponding to 10,000 and 21,000 km of data propagation. . . . . 139 4-31 Schematic of the 100-km reconfigurable recirculating loop using the
wavelength-maintaining FUNI. Two alternative paths through the loop allow use to adjust the distance between regeneration. . . . . 140
4-32 Cross-correlations of pulses through 100-km reconfigurable recirculat-ing loop after 0 through 100 successive passes. . . . . 142 4-33 Experimental setup to test 40 Gb/s WMFUNI. . . . . 143
4-34 Bit-error rate tests for each of the four 10-Gb/s channels at the output of the W M FUNI. . . . . 144
5-1 The top plot shows the optical pulse power at the input of the SOA. The middle plot shows the resulting value of h(T). The bottom plot shows the output power of the SOA. In this SOA, ho = 7, Tc = 75 ps, and Esat = 1 pJ... . . . . ... 154
5-2 Model used for simulations of the SOA-MZI. The switch is a Mach-Zehnder interferometer, like that described in Section 2.2.1. One SOA in each arm serves as the nonlinear medium. The control pulse in Arm 1 enters the SOA-MZI first, turning the switch on. The signal pulse then enters both arms through a power splitter. Finally, the control pulse in Arm 2 enters the switch, turning it off. . . . . 155
5-3 Schematic of the receiver used in Figure 5-2. . . . . 156
5-4 Intensity of the output of the SOA-MZI, showing the 27 - 1 PRBS as
well as some patterning on the Is and Os. . . . . 161
5-5 Integrated gains in both SOAs. The relative phase shift induced equals the difference in the two gains times a = 5. This section of the gains corresponds with 10 bits of the pattern (0100000110). The vertical grid lines mark the center of the signal pulses. . . . . 162
5-6 Distribution of energies in (a) 0-bits and (b) 1-bits, all normalized to the power in the bit with the most energy. . . . . 164 5-7 Simulated bit-error rate curve of the output of the SOA-MZI compared
to the transmitter back-to-back. . . . . 164 5-8 Histogram of power penalties of 10,016 random bit-patterns compared
5-9 Optimal bit-error rates of the SOA-MZI over a range of control pulse energies in Arm 1. The bit error rates are taken at a received optical power of 18 dBphotons/bit. . . . . 169 5-10 BER plots of SOA-MZI's output cases with and without noise in the
SO A s. . . . . 170 5-11 Cascade of SOA-MZI's in regeneration. . . . . 171 5-12 Simulated BER curves for an optical data stream in a cascade of
SOA-MZIs taken after 1, 50, and 100 switches. . . . . 172 5-13 Output pulse intensity of 4 of the switches in the SOA-MZI cascade. . 173
5-14 Output pulse intensity of 4 of the switches in the SOA-MZI cascade at
40 Gb/s... ... 175
5-15 Simulated BER curves for an optical data stream in a cascade of in-verting SOA-MZIs taken after 2 and 100 switches at 40 Gb/s compared with the BER curve of the transmitter back-to-back. . . . . 176 5-16 Output intensity of switches 1, 2, 99, and 100 in the inverting SOA-MZI
cascade at 40 Gb/s. . . . . 177 5-17 Optimal BER as a function of E1 at two different values of a for the
10-Gb/s cascade. . . . . 179 5-18 Optimal BER as a function of E1 at two different values of a for the
40-Gb/s cascade. . . . 179 5-19 Schematic of the Alphion integrated SOA-MZI optical switch. . . . . 181 5-20 Schematic of the SOA wavelength converter presented in Section 4.3.1. 181 5-21 Schematic of the wavelength-maintaining SOA-MZI setup for a BER
m easurem ent. . . . . 182 5-22 BER curves of the SOA wavelength converter and the
wavelength-maintaining SOA-MZI, compared to a transmitter back-to-back. . . . 183 5-23 Switching window of the SOA-MZI. This plot shows the average output
power of the SOA-MZI as a function of relative delay between the signal and control pulses. . . . . 183
5-24 Schematic of the 100-km recirculating loop using the wavelength-maintaining SOA-MZI as a regenerator. . . . . 185 5-25 Cross-correlations of pulses through 100-km regenerative recirculating
loop after 1 through 114 successive passes. The three smaller plots zoom in on the pulses after 1, 50, and 114 passes. . . . . 186 5-26 Bit error rates of the loop data after 10 passes (top) and 100 passes
(bottom) through the regenerator. Both are compared to BER curves of the transmitter back-to-back and of the data after 1 pass through the regenerator. . . . . 188
List of Tables
5.1 Parameters used for SOA-MZI simulations in Section 5.1.4. . . . . 160 5.2 Parameters used for SOA-MZI simulations in Section 5.1.5. . . . . 168
Chapter 1
Introduction
In 1977 GTE sent telephone voice data, coded as pulses of light, through kilometers of glass optical fiber at 6 Mb/s [1]. Now we measure the capacity of commercial optical fiber links in tens of Gb/s, and research groups have reported transmission of data at tens of Tb/s with spectral efficiencies above 3 b/s/Hz [2, 3, 4]. These data rates far exceed the processing speeds of electronic hardware. This problem is overcome by demultiplexing these high data rate channels down to many lower rate channels, which are then converted to electronic data channels. The channels are then processed electronically, converted back to optical signals, and finally multiplexed up to the optical data rate to propagate further in the network. For applications requiring complex logical operations, this solution remains the best one [5, 6].
For some applications, however, processing of the optical data signals in the optical domain (i.e., without an optical-electrical-optical conversion) offers several possible advantages, like higher speed and lower power consumption. For example, all-optical logic has been demonstrated at 100 Gb/s [7]. This speed advantage suggests that optical data can be processed at rates much faster than electronics and, therefore, without the need for demultiplexing and optical-to-electrical conversions. In fact, such logic has been experimentally tested in wavelength conversion [8, 9, 10], label swapping [11], packet synchronization [12], packet switching [13, 14], and data regen-eration [15, 16, 17, 18].
regen-eration. Data in optical fiber networks are most often coded using ON/OFF keying (OOK), in which pulse envelopes are modulated onto a carrier wavelength of light. The presence of a pulse of light represents a 1-bit and the absence of a pulse represents a 0-bit. These pulses distort over long-distance propagation in fiber so that Os and is become difficult to distinguish, as we will see in Section 1.1. To prevent runaway degradation of the data signal, we can place data regenerators periodically along the optical link to restore pulse quality so that errors do not accumulate. In this thesis I present two interferometric all-optical switches designed to regenerate OOK data and assess their performance in data regeneration.
1.1
Networks and Fiber Propagation
Data from electronic systems have to be multiplexed up to optical rates. There are several methods for doing so, two of which are shown in Figure 1-1. Commercial systems typically use wavelength-division multiplexing (WDM). In WDM systems, data in the optical link are divided among many channels, each with a different carrier wavelength. Figure 1-1 (a) shows part of a WDM system. The data are
OOK in this case, although the data could instead be coded using phase-shift keying or one of many other modulation formats. Each channel is a train of data pulses modulated onto a distinct carrier wavelength, shown in the figure with different shades of grey. Transceivers (Tx/Rx) add and drop wavelength channels to and from the link. The technology for WDM systems is well-developed because of commercial and industrial investment, and very high data rates are possible. For example, Alcatel has demonstrated an experimental 2,100-km WDM optical link at 6.4 Tb/s [19]. Unfortunately, the time required to reconfigure transceivers to add and drop different wavelength channels is long compared to the length of a packet of data. Therefore, WDM networks are circuit-switched rather than packet-switched networks.
Slotted optical time-division multiplexed systems, on the other hand, provide the possibility of a packet-switched optical network [14]. Figure 1-1 (b) shows part of a slotted OTDM optical link. All the data are part of a single ultra-fast channel and are
Tx/Rx Tx/Rx
(a)
(b)
Figure 1-1: Two methods of multiplexing data: (a) wavelength-division multiplexing and (b) slotted optical time-division multiplexing.
composed, in this case, of OOK pulses modulated onto a single optical wavelength. This time, the different shades of grey denote different time slots in the data stream rather than different wavelengths. Transceivers burst data onto the optical channel in distinct time slots. This system allows on-demand resource allocation by a centralized processor and improves the efficiency of bandwidth allocation [20, 21]. Nonetheless, many of the basic tools required to make such a system work, like ultrafast data regeneration, still require development.
In fact, both of these multiplexing systems can, at high data rates and long prop-agation distances, require inline data regeneration because the optical fiber distorts data pulses during propagation. One effect is loss in the fiber, which decreases
opti-cal power by ~0.25 dB/km. This loss can be compensated with Erbium-doped fiber amplifiers (EDFAs), which add noise to the optical signal. The other dominant dis-torting effects are chromatic dispersion, which causes different groups of wavelengths to have different group velocities, and the nonlinear index of refraction, which causes more intense light to experience a higher index of refraction. In higher rate systems the interactions that these distortions produce among pulses, both within and across wavelength channels, become more severe. This is especially true when higher rates are achieved with shorter optical pulses.
Figure 1-2 shows the results of a simulation of data pulse propagation in TrueWave fiber. The optical link, shown at the top of the figure, contains three 80-km spools of TrueWave fiber separated by EDFAs that restore the time-averaged power of the data signal. The EDFAs are assumed to be prefect so that they add no noise to the data signal. The only distorting effects included in the model are the chromatic dispersion (approximated out to third order) and the nonlinear index of refraction. The link also includes a dispersion compensation module, which perfectly compensates the chromatic dispersion in the 240 km of TrueWave. So, in the absence of a nonlinear index, the pulses will propagate undistorted through the link. The top plot in the figure shows the intensity envelope of the input data pulses. The optical pulses are modulated onto a 1550-nm carrier and have a width of 2.5 ps. The data rate is 100 Gb/s and the data pattern is a 25 - 1 pseudorandom bit stream (PRBS). At the input to the link and after each EDFA, the data stream has a time-averaged optical power of 25 mW. The next two plots show the intensity envelope of the data pulses after one and two passes through the optical link. The is no longer have uniform intensity, and optical energy appears in the 0 spaces. We can see that some of the Os
and is have become indistinguishable, leading to errors at the data receiver.
1.2
Regeneration of Optical Data
A simple way to correct the data pulse distortions incurred during propagation through the TrueWave fiber above is intensity thresholding, shown in Figure 1-3.
... ... 0 0.. . . . . . . . . . . .. . . . . .. . . ... .. .. . . . .. . .. . .. .. . .. . . .
W
C) Cl C) H. .... .. ... . .. . . .. . .. . . .. . . H .. ... .. . .CZ§14
.0 0*4 000 ClC ClC 0C - 0 . . . 0 0. . 0 6 . 0 . .. .. .. .. .. .. .. .. .. .. . .. . .. . ... .~0 .~ . (PA .. ~ ... (.X .. d Figure ~ ~ ... 1-:Sm ltono.h.rpaaino .p wide .. pulesthrug .24.k. o True ~ optical... ~ ~ ~ fier.Tedipesincopesain.odleprfcty.opesaeave.... ...any~~~~~~~~~~~~~~~~~~ choaiCiprinaddb)h reav ieadteapiir r sue
The top diagram in the figure shows an ideal thresholder, which blocks optical pulses below a certain peak intensity threshold. Above that threshold it outputs a single intensity. Thus, the thresholder extinguishes optical power in the Os and restores the is to a fixed peak intensity. Of course, no real thresholder works this way. A real
Ideal Threshold 2 -Regenerator Input Pulse Threshold Intensity Ln Realistic Threshold -.Regenerator Input Pulse Intensity
Figure 1-3: The thresholder is a simple regenerator that extinguishes noise in the Os and restores Is to their proper intensity. The top diagram shows an ideal thresh-older acting on distorted data pulses. The bottom diagram shows a more realistic thresholder.
thresholder may not have an instantaneous response time and will not have a perfect step-function nonlinearity. The bottom plot shows a more realistic thresholder with a raised sine-function nonlinearity. Its output reduces the optical power in the Os and reduces variability in the intensity of the Is, but not perfectly. The thresholder will occasionally flip a bit's value, for example, when a noise spike adds too much energy to a 0-bit. In most circumstances, however, the thresholder improves the signal-to-noise ratio so that signal-to-noise will not accumulate and so that the signal-to-noise will not contribute to interactions that produce even more noise.
Thresholder regenerators are simple enough that all-optical designs exist and have been tested in transmission experiments. One common design is based on the nonlin-ear optical loop mirror (NOLM) [22], which has been demonstrated in regeneration experiments at 42.66 Gb/s over 10,000 km of transmission [23]. Nonetheless the thresholder does not accomplish everything an ideal regenerator should. For
exam-ple, it does not necessarily correct phase distortions under the pulse's envelope. It also does not correct the random drifts of pulses from the center of their bit periods (timing jitter). Finally, it does not correct any polarization drifts that the data pulses have accumulated during propagation.
These problems can be solved with more complicated regenerators that correct timing jitter and restore pulse polarization by either modifying the data pulses
di-rectly or, more commonly, replacing them altogether. Ideally, such a regenerator accomplishes four things, the 4Rs of regeneration. First, it Re-amplifies the data to restore signal strength lost in propagation. Second, it Reshapes data pulses, restoring both the envelope shape and a flat phase under the envelope. Third, it Retimes the data pulses so that neighboring bits will not interfere with each other. Fourth, it Repolarizes the pulses so that variations in polarization at the regenerator's input do not affect the output polarization. The two regenerators presented in this thesis are all-optical 4R regenerators.
Today, however, such regenerators are electronic. Figure 1-4 one such regenera-tor. Optical data that have become distorted after long-distance propagation enter a demultiplexer, which divides the optical data among many electronic-rate data chan-nels. Photodiodes then convert these channels to electrical signals, which are detected in electronic regenerators. These regenerators decide whether each bit is a 1 or 0 and then modulate the appropriate bit value onto the output of a laser transmitter.
The electronic solution requires extra hardware for demultiplexing the data and converting the data between the optical and electrical domains, and both these do-main conversions add loss to the link. Instead, we can use the speed of all-optical switches to design a regenerator that operates at the line rate, eliminating the need for demultiplexing. Figure 1-5 shows a basic schematic for a broad class of all-optical
I
1
0
1
Photodiode Bank A-- Regenerator--
Regenerator
--
Regenerator
--1 Regenerator --1 Regenerator -Laser Bank-A
-A
-A
I
1
0
1
Figure 1-4: Schematic for an electronic regenerator. include network routing or other functionality.
The regenerator boxes may also
regenerators. Incoming network data pulses (white) are distorted after propagation through optical fiber. The power of these pulses is split between a clock recovery circuit and an all-optical switch. The clock recovery circuit produces a clock signal (black), which may be optical or electrical, depending on the design. In the regener-ators presented in this thesis, the clock is an optical pulse train, and the all-optical switch modulates the data pattern of the input data pulses (white) onto the clock pulses (black). In other designs, clock pulses enter the all-optical switch not to re-place the data pulses, but to re-form them. One such regenerator uses synchronous
Figure 1-5: Schematic for a broad class of all-optical regenerators. In this case the clock pulses (black) are modulated with the original data pattern. In some regenera-tors, however, the clock pulses are used to improve the quality of the incoming data pulses, rather than replace them.
modulation, described in Chapter 2.
1.3
Organization of Work
This thesis presents an evaluation of two all-optical regenerators, both based on in-terferometric all-optical switches. Before presenting the results of this evaluation, Chapter 2 reviews four classes of regenerators with an emphasis on interferometer-based regenerators. Two of the classes are 2R regenerators that only re-amplify and reshape the pulses. One is a 3R regenerator that re-amplifies, reshapes, and retimes the pulses. The fourth class can be adapted to both 3R and 4R regeneration. Chap-ter 2 also discusses the importance of nonlinear maChap-terials for inChap-terferometric switches.
Chapter 3 discusses the two most common nonlinear media used in interferometer-based switches and regenerators. The first is optical fiber, which possesses a nearly instantaneous nonlinear index of refraction. The second is the semiconductor optical amplifier (SOA), which possesses a much stronger nonlinearity but also has a much longer response time. This chapter may be omitted on a first reading.
Chapter 4 discusses the experimental evaluation of a fiber-based all-optical regen-erator: the wavelength-maintaining folded ultrafast nonlinear interferometer (WM-FUNI). Fiber-based regenerators have the advantage of being nearly instantaneous medium. SOAs, on the other hand, have long recovery times. So the effects on the SOA of a bit can linger through the next several bits, producing undesirable interfer-ence between neighboring bits. Fiber switches, however, can operate on bits without such interference. We have demonstrated operation of the WMFUNI in 10-Gb/s re-generation over 20,000-km of transmission. We have also shown that the WMFUNI operates at data rates up to 40 Gb/s.
Chapter 5 discusses the experimental evaluation of an SOA-based all-optical regen-erator: the SOA Mach-Zehnder interferometer (SOA-MZI). The principle advantage of SOA-based regenerators and switches is their ability to be integrated onto semicon-ductor chips. We have demonstrated successful operation of an integrated SOA-MZI regenerator in a 10,000-km transmission experiment at 10 Gb/s. Simulations of the
SOA-MZI regenerator, presented in Section 5.2, show how the SOA-MZI's operation may be extended to 40 Gb/s.
This thesis evaluates the ability of all-optical regenerators to extend the propaga-tion distances of high data-rate communicapropaga-tions. All-optical solupropaga-tions, however, are not the only possibilities. Chapter 6 will consider briefly how all-optical solutions may develop in the future, and how they may compare with other methods of high-rate communication, including opto-electronic regeneration and specially designed optical
Bibliography
[1] J. Hecht, City of Light: The Story of Fiber Optics. New York: Oxford University Press, 1999.
[2] A. Gnauck, G. Charlet, P. Tran, P. Winzer, C. Doerr, J. Centanni, E. Burrows, T. Kawanishi, T. Sakamoto, and K. Higuma, "25.6-Tb/s C+L-Band Transmis-sion of Polarization-Multiplexed RZ-DQPSK Signals," Optical Fiber
Communi-cation Conference, Postdeadline Session, 2007.
[3] H. Masuda, A. Sano, T. Kobayashi, E. Yoshida, Y. Miyamoto, Y. Hib-ino, K. Hagimoto, T. Yamada, T. Furuta, and H. Fukuyama, "20.4-Tb/s
(204 x 111 Gb/s) Transmission over 240 km Using Bandwidth-Maximized Hy-brid Raman/EDFAs," Optical Fiber Communication Conference, Postdeadline Session, 2007.
[4] D. Foursa, A. Lucera, C. Davidson, J.-X. Cai, W. Anderson, Y. Cai, P. Corbett, W. Patterson, H. Li, M. Mazuczyk, M. Nissove, A. N. Pilipetskii, and N. Bergano, "2Tb/s (200xlOGb/s) Data Transmission over 7,300km Using 150km Spaced Repeaters Enabled by ROPA," Optical Fiber Communication Conference, Post-deadline Session, 2007.
[5] H. Caulfield, C. Vikram, and A. Zavalin, "Optical logic redux," Optik, vol. 117, no. 5, pp. 199-209, 2006.
[6] R. Keyes, "Optical Logic-in the Light of Computer Technology," Journal of Modern Optics, vol. 32, no. 5, pp. 525-535, 1985.
[7] K. L. Hall and K. A. Rauschenbach, "100-Gbit/s bitwise logic," Optics Letters, vol. 23, pp. 1271-1273, Aug. 1998.
[8] S. Nakamura, Y. Ueno, and K. Tajima, "168-Gb/s all-optical wavelength conver-sion with asymmetric-Mach-Zehnder-type switch," IEEE Photonics Technology Letters, vol. 13, no. 10, pp. 1091-1093, 2001.
[9] J. Leuthold, L. M5ller, J. Jaques, S. Cabot, L. Zhang, P. Bernasconi, M. Cap-puzzo, L. Gomez, E. Laskowski, E. Chen, et al., "160 Gbit/s SOA all-optical wavelength converter and assessment of its regenerative properties," Electronics
[10] C. Schubert, R. Ludwig, S. Watanabe, E. Futami, C. Schmidt, J. Berger, C. Boerner, S. Ferber, and H. Weber, "160 Gbit/s wavelength converter with 3R-regenerating capability," Electronics Letters, vol. 38, no. 16, pp. 903-904, 2002.
[11] D. Blumenthal, B. Olsson, G. Rossi, T. Dimmick, L. Rau, M. Masanovic, 0. Lavrova, R. Doshi, 0. Jerphagnon, J. Bowers, et al., "All-optical label swapping networks and technologies," Journal of Lightwave Technology, vol. 18, no. 12, pp. 2058-2075, 2000.
[12] D. Apostolopoulos, 0. Zouraraki, D. Petrantonakis, P. Bakopoulos, D. Tsiokos, E. Kehayas, and H. Avramopoulos, "Bit- and Packet-Level Self-Synchronization for All-Optical Label-Switched Network Nodes with Transparency to Network-Traffic," Optical Fiber Communication Conference, 2006.
[13] J. Wang, B. Robinson, S. Hamilton, and E. Ippen, "40-Gbit/s all-optical header processing for packet routing," Optical Fiber Communication Conference, 2006, p. 3, 2006.
[14] S. Hamilton, B. Robinson, T. Murphy, S. Savage, and E. Ippen, "100 Gb/s optical time-division multiplexed networks," Journal of Lightwave Technology, vol. 20, no. 12, pp. 2086-2100, 2002.
[15] B. Lavigne, E. Balmefrezol, P. Brindel, B. Dagens, R. Brenot, L. Pierre, J.-L. Moncelet, D. de la Grandiere, J.-C. Remy, J.-C. Bouley, B. Thedrez, and 0. Leclerc, "Low input power all-optical 3R regenerator based on SOA devices for 42.66 Gbit/s ULH WDM RZ transmissions with 23 dB span loss and all-EDFA amplification," Optical Fiber Communications Conference, 2003.
[16] Z. Zhu, M. Funabashi, Z. Pan, L. Paraschis, and S. Yoo, "10 000-Hop Cascaded In-Line All-Optical 3R Regeneration to Achieve 1 250 000-km 10-Gb/s Trans-mission," IEEE Photonics Technology Letters, vol. 18, no. 5, pp. 718-720, 2006. [17] S. J. Savage, B. S. Robinson, S. A. Hamilton, and E. P. Ippen, "200-pass picosecond-pulse transmission through a regenerative recirculating fiber loop," in CLEO 2006 Technical Digest, (Long Beach, CA), May 2006.
[18] J. P. Wang, S. J. Savage, B. S. Robinson, S. A. Hamilton, E. P. Ippen, R. Mu, H. Wang, L. Spiekman, and B. B. Stefanov, "Regeneration using an SOA-MZI in a 100-pass 10,000-km recirculating fiber loop," in CLEO 2007 Technical Digest,
(Baltimore, MD), May 2007.
[19] G. Charlet, J. Antona, S. Lanne, P. Tran, W. Idler, M. Gorlier, S. Borne, A. Klekamp, C. Simonneau, L. Pierre, Y. Frignac, M. Molina, F. Beaumont, J.-P. Hamaide, and S. Bigo, "6.4 Tb/s (159 x 42.7 Gb/s) Capacity Over 21x 100 km Using Bandwidth-Limited Phase-Shaped Binary Transmission," 28th Euro-pean Conference on Optical Communication, vol. 5, 2002.
[20] S. G. Finn, "HLAN-An Architecture for Optical Multi-Access Networks," 1995
Digest of the LEOS Summer Topical Meetings, pp. 45-46, 1995.
[21] R. A. Barry, V. W. S. Chan, K. L. Hall, E. S. Kintzer, J. D. Moores, K. A. Rauschenbach, E. A. Swanson, L. E. Adams, C. R. Doerr, S. G. Finn, H. A. Haus, E. P. Ippen, W. S. Wong, and M. Haner, "All-Optical Network Consortium-ultrafast TDM networks," JLT/JSA C Special Is-sue on Optical Networks, vol. 14, p. 999, June 1996.
[22] M. Jinno and T. Matsumoto, "Nonlinear Sagnac interferometer switch and its applications," IEEE Journal of Quantum Electronics, vol. 28, no. 4, pp. 875-882, 1992.
[23] F. Seguineau, B. Lavigne, D. Rouvillain, P. Brindel, P. Pierre, L. Pierre, and 0. Leclerc, "Experimental demonstration of simple NOLM-based 2R regenerator for 42.66 Gbit/s WDM long-haul transmissions," Optical Fiber Communication Conference, vol. 1, 2004.
Chapter 2
Overview of Regeneration
In order to extend data propagation distances and increase data rates, researchers and businesses have tested many different regenerators, including both electronic and all-optical solutions (see references [1, 2] for broad reviews of these areas). This thesis presents our work on two all-optical regenerators. Therefore, Section 2.1 reviews four broad classes of all-optical regenerators. The last class of regenerators described in Section 2.1 will be interferometer-based designs. Both of the regenerators we present in this thesis have interferometer-based designs, so we will review this class of regenerators in more detail in Section 2.2. As we saw in Figure 1-5, clock recovery is an important component in all-optical regenerators. Although this thesis focuses on the all-optical switch component of regenerators, an understanding of regeneration would be incomplete without a review of research in clock recovery. So, Section 2.2 will also describe some clock recovery solutions from the literature.
2.1
Classes of Regenerators
An ideal regenerator accomplishes four tasks, which are called the 4Rs. First, it Re-amplifies the optical data signal to compensate losses. Second, it Reshapes the data pulses, producing the proper envelope and phase. Third, it Retimes data pulses that have randomly drifted from the centers of their bit periods. Fourth, it Repolarizes data pulses to correct any drifts in polarization caused by fiber propagation.
Repolar-2R
A A
,-,
SA
AA
,a a A
3R
(a)
In (b)Figure 2-1: (a) Saturable absorbers can be used to produce all-optical switches. (b) The 2R self switch has an intensity-dependent transmittance, as shown in this plot of output pulse intensity versus input intensity.
ization ensures that all data packets leave the regenerator with the same polarization. The four classes of all-optical regenerators described in this section cover most of the designs discussed in the literature. The first two are 2R regenerators, which amplify and reshape the data pulses. The third is a 3R regenerator, which re-amplifies, reshapes, and retimes the data. The fourth is a 4R regenerator and will be the subject of most of the rest of this thesis.
2.1.1
Intensity Self-Switches: Gain Modulation
Intensity self-switches use cross-gain modulation (XGM) to produce an intensity-dependent or pulse-energy-intensity-dependent gain or loss. These switches can be implemented in several ways, including with a semiconductor optical amplifier (SOA) or a saturable absorber (SA). Figure 2-1 (a) shows how an SA can be implemented as both a 2R and
a 3R regenerator. The SA's transmittance depends on the input optical intensity, as shown in Figure 2-1 (b). At low intensities, the SA is opaque, but at high intensities it becomes transparent'. In the 2R case, this low-intensity opacity causes the SA regenerator to suppress small amounts of noise in the 0-bits. The Is, as long as they have sufficient energy, pass through the SA unchanged.
In the 3R case, intense data pulses enter the SA along with weaker clock pulses, which are produced by a clock recovery unit (CR). The CR extracts the pulse rate from the network data pulses, producing a clock train with the same pulse rate and a different carrier wavelength. The presence of a data pulse switches the SA from opaque to transparent, which modulates the data pattern of the data pulses onto the clock pulses. SAs are rarely used this way as logical switches because the contrast between their opaque and transparent states are often only a few dB. For regeneration, however, such low contrast may be adequate.
20 14 0d S- 2R (_WDM)WJN) - 2R(1-Chan.) -+-- No 2R, No Filt. -No 2R, + Filt. 0 5000 10000 Distance (km)
Figure 2-2: Experimental data showing the degradation of the Q-factor of a 40-Gb/s data stream versus propagation distance both with (solid) and without a cross-gain modulation regenerator (dashed). This plot comes from Figure 4 of Rouvillain, et al., OFC, 2002 [3].
'In fact, the SA's transmittance does not usually depend on instantaneous intensity. Rather, it often has a recovery time that causes its transmittance to depend on a weighted integral of the intensity over tens or even hundreds of picoseconds. In this simple description, we neglect this effect, although it has important consequences. For example, at high data rates, it causes the SA's behavior to depend on the value of previous bits, leading to undesirable pattern-dependent effects.
Figure 2-2 shows experimental data from [3] for a transmission experiment using an SA-based regenerator. The optical data were modulated onto a 40-Gb/s train of 8-ps pulses. The data pulses entered a loop containing 240 km of dispersion-compensated fiber and they propagated through the loop 41 times for a total propagation distance of -10,000 km. The figure shows the Q-factor of the data train in the loop as a function of propagation distance. The Q-factor in ON/OFF keyed data is defined as
|p -- pio|
Q = ,
0
,
-1
+
gowhere
si
and po are the means of the peak intensities of the is and Os, and o- and o are the standard deviations of the distribution of intensities of the is and Os. The solid lines in the plot show the quick decline of the Q-factor when the loop contains no regenerator. When there is a data regenerator in the loop, the Q-factor drops much more slowly, as shown with the dashed lines in the plot.2.1.2
Intensity Self-Switches: Self-Phase Modulation
In the previous section, we saw an intensity self-switch with an intensity-dependent transmissivity. This suppresses noise in the Os, but does not suppress variations in the intensities of the 1s. A 2R regenerator could instead have an input-output response like that shown in Figure 2-3 (b). In this case, is entering the regenerator with a range of intensities all exit with the same intensity.
Figure 2-3 (a) shows a schematic of a 2R regenerator that produces the desired input-output response. A data pulse with carrier wavelength A0 enters an
Erbium-doped fiber amplifier (EDFA), which increases the intensity of the pulse. The pulse then enters a section of nonlinear fiber, in which the index of refraction is higher for higher intensities. The pulse's intensity has an approximately Gaussian envelope so that the peak of the pulse moves more slowly than its tails, causing the leading tail to red shift and the lagging tail to blue shift. This effect is often referred to as self-phase modulation (SPM), and, for Gaussian pulses with the proper length of propagation, produces the middle spectrum plot shown in Figure 2-3 (a). The filter then passes
EDFA Nonlinear Fiber (a) X 0 (b) In
Figure 2-3: (a) Schematic of a 2R all-optical regenerator based on self-phase modula-tion. The plots show the pulse spectra at the input, at the end of the fiber, and after the band-pass filter. (b) Desired input-output response of this regenerator.
one of the two peaks in that spectrum.
Figure 2-4 shows experimental data from [4] for the SPM regenerator. The dotted line shows the output pulse intensity versus input pulse intensity. The solid line shows the same plot for a chain of two SPM regenerators, showing the desired step-function response.
The SPM regenerator has many useful properties. It gives 2R regeneration with a very simple design. Nonetheless, the regenerator does not retime or repolarize the data. Moreover, its operation depends on the pulse shape, as described above. So amplifier noise, which will not have the same time profile as the Gaussian pulse, may not be eliminated from the Is. So, in the next two sections, we consider more complicated designs that overcome these problems.
0.15 0.10 8 / + 0.05- / 0 0.0 0.0 0.5 1.0 1.5 2.0 2.5
Input Intensity, I/10
Figure 2-4: Output pulse intensity of the SPM regenerator versus input pulse intensity after one stage of the regenerator (dotted) and two stages (solid). The plots are experimental data from Figure 2 of Mamyshev, ECOC, 1998 [4].
2.1.3
Synchronous Modulation
Synchronous modulation has received a great deal of attention in the literature, es-pecially from the private sector [5, 6, 7]. Figure 2-5 (a) shows the schematic of a synchronous-modulation regenerator. The energy of the data pulses is split in two. Part of the energy enters the clock recovery circuit (CR) that generates the clock pulse train, in this case an electronic pulse train, that drives an electro-optic modulator. The pulses then pass through a filter and a section of highly nonlinear fiber.
The electro-optic modulator (E/O modulator) retimes the data pulses. The clock pulses change the transmissivity of the E/O modulator, as shown in Figure 2-5 (b). The peak of the clock pulses correspond with the peak of the E/O modulator's trans-missivity. In the figure, the data pulse leads the clock pulse, which causes its leading edge to be attenuated. This attenuation moves the center of mass of the pulse towards the center of the clock pulse. Many other devices have been used in place of the E/O modulator, including electro-absorption modulators, all-optical switches, and phase
modulators. The filter serves a similar purpose in the frequency domain, dragging the data pulse's frequency center to the desired frequency.
The nonlinear fiber's purpose is subtler. When the pulse widths and intensities are at the right values, the fiber's second order chromatic dispersion, discussed in the next
Nonlinear Fiber E/O Band-Pass Modulator Filter (a) Transmittance Modulator Intensity Profile Data Pulse Envelope > Time (b)
Figure 2-5: (a) Schematic of the synchronous modulator. (b) Effect of the E/O modulator on the pulse timing.
Synchronous Modulation AA S18 A All-optical 2R a 12 - - -0 500,000 1,000,000 Transmission Distance (km)
Figure 2-6: Plot of the Q-factor of data pulses as a function of propagation distance. One plot (triangles) shows the evolution of
Q
with a 2R regenerator, and the other (circles) shows the evolution ofQ
with 3R synchronous modulation. This plot comes from Figure 3 of Raybon, et al., OFC, 2002 [5].chapter, and its self-phase modulation can cancel out, producing first order soliton pulses [8, 9]. First order soliton pulses propagate undistorted through lossless fiber. Moreover, they are stable to perturbations so that any pulse that deviates slightly from the ideal soliton shape will evolve during propagation into an ideal soliton. It is this property that allows the nonlinear fiber to reshape the pulses. The soliton effects also ensures that all the pulses possess the same peak intensity and that the energy in the Os dissipates away during propagation.
Figure 2-6 shows the results of the transmission experiment given in [5]. The optical data were modulated onto a 40-Gb/s train of 8-ps pulses. The data pulses en-tered a loop containing 400 km of dispersion-compensated fiber and they propagated through the loop -2500 times for a total propagation distance of ~1,000,000 km. The figure shows the Q-factor of the data train in the loop as a function of propagation distance. One plot (triangles) shows the evolution of
Q
when the loop contains a 2R regenerator. The accumulation of random timing jitter causes a steady degradation in the data quality. To correct the timing jitter, a 3R synchronous modulator was inserted into the loop, causing the value ofQ
to remain stable after 1,000,000 km of propagation.(a)
>In (b)
Figure 2-7: (a) Schematic of interferometer-based regenerator. Cross-phase modula-tion (XPM) is used to imbalance the interferometer. (b) Output pulse intensity versus input pulse intensity, showing the raised-sine response typical of interferometers.
2.1.4
Interferometric Switches
Synchronous-modulation regenerators do not repolarize the data pulses. In networks that have polarization-sensitive components, regenerators may need to convert the polarization of all input data pulses to a single constant output polarization. One solution is to use a regenerator that replaces the incoming network data pulses with a new set of data pulses modulated with the same data pattern.
One such regenerator is shown in Figure 2-7 (a). A clock recovery circuit (CR) produces a train of optical clock pulses. A 50/50 coupler splits the optical power into the two arms of the Mach-Zehnder interferometer (MZI). When the pulses from the two paths recombine at the MZI's output, they destructively interfere. A data pulse can be coupled into the interferometer's top arm. It then enters a medium with an intensity dependent index of refraction (XPM in the figure) where the pulse increases the optical path length of the top arm by a half wavelength. This process modulates the data pattern onto the clock pulses. Usually a filter at the output removes the