Behavior of Fresh and Aged Catalysts In Response to Rapid
Engine Control Perturbations
By
Chad A. Smutzer B.S., Mechanical Engineering
Clarkson University, 2000
Submitted to the Department of Mechanical Engineering in Partial Fulfillment of the Requirements for the Degree of
Master of Science in Mechanical Engineering
at theMassachusetts Institute of Technology
January 2002
@ 2002 Massachusetts Institute of Technology
All rights reserved
I A MASsACHUSETS IN TITUTE OF TECHNOLOGY
LAR5E2002
LIBRARIES Signature of AuthorDepartment of Mechanical Engineering January 18, 2001
Certified by
Certified by
John B. Heywood
Sun Jae Professor of Mechanical Engineering Thesis Advisor
Wai K. Cheng Professor, Department of Mechanical Engineering Thesis Advisor
Accepted by
Ain A. Sonin Professor, Department of Mechanical Engineering
Behavior of Fresh and Aged Catalysts In Response to Rapid
Engine Control Perturbations
By
Chad A. Smutzer
Submitted to the Department of Mechanical Engineering
January 2002 in Partial Fulfillment of the Requirements for the Degree of Master of Science in Mechanical Engineering
ABSTRACT
Continuously decreasing emissions standards and environmental concern have caused much research to be undertaken on the topic of catalytic converters and how to optimize their performance. The steady state performance of the Three Way Catalyst is excellent. As emissions standards become stricter, however, emphasis must be given to what happens during transients, what happens when there are substantial air fuel excursions, and the effects of the catalyst aging. The objective of this work is to take a systems approach to the engine/catalyst setup to quantify catalyst behavior as the catalyst ages.
To accomplish this objective, three sets of experiments were carried out: 1. Steady-state air/fuel ratio sweeps of catalyst NOx and HC removal efficiency, 2. Transient throttle perturbations, and 3. Oxygen storage tests. The goals of the steady-state efficiency testing and the oxygen storage tests were to quantify the effects of aging on the catalyst and separate the effects of active material degeneration from oxygen storage capacity. The goal of the throttle perturbations was to cause breakthrough in the catalyst and be able to quantify the amount of breakthrough that occurred. Three
different dyno-aged catalysts on a production spark-ignition engine were the test bed for the three sets of experiments.
For the catalysts tested, there was not a substantial reduction in the hydrocarbon conversion efficiency as the catalyst aged, but there was approximately a 50% reduction in NOx conversion efficiency. The middle-aged catalyst was found to have a NOx conversion efficiency between that of the oldest catalyst and the newest catalyst. However, with respect to oxygen storage capacity, there was a 17% reduction between the newest catalyst and the middle-aged catalyst, but essentially no change between the oxygen storage capacity of the middle-aged catalyst and the oldest catalyst. This implies that the difference in conversion efficiency is not due to loss of oxygen storage, but rather to active material degeneration. The transient tests documented two types of
breakthrough: a primary breakthrough that occurred when the throttle transient occurred, and a secondary breakthrough that occurred after the engine was at full load. The
magnitude of both levels of breakthrough was found to increase rapidly with catalyst age. These breakthroughs are potentially of concern for aggressive driving under strict Tier 2 emissions regulations.
ACKNOWLEDGEMENTS
Under the guidance of Professors Cheng and Heywood, I have learned much about engines and the research process. Their experience in engine research guided this project in a direction that yielded interesting results and challenged me to continually think of the problem from a different angle.
I have also benefited from speaking with the members of the MIT Engine and Fuels Research Consortium. Their practical input helped to steer the research in an applicable direction. Frank Zhao (DaimlerChrysler), Chris Thomas (DaimlerChrysler), Arthur Frelund (GM), Walt Weissman (Exxon Mobil), Yeong Kwon (Exxon Mobil), Tim Coatesworth (DaimlerChrysler), Dave Radke (GM), Thomas Asmus (DaimlerChrysler), and Ron Herrin (GM) all spoke to me during the Consortium meetings to give helpful pointers. A special thanks belongs to Yeong Kwon for the testing of the sulfur level of the oil that I used during my experiments.
Richard Perdichizzi (MIT) was very helpful when I was trying to calibrate the hot wire anemometer (which we ended up not using). Dr. Mark Peckham (Cambustion) gave prompt, helpful replies to any queries I had regarding the fast NO meter. Thane Dewitt (MIT) receives thanks for lending a helping hand in the laboratory. Karla Stryker and Susan Lutin made the administrative procedures easy. Leslie Regan's organization and knowledge made all of the required paperwork seem very easy to complete.
I also would like to acknowledge my friends at MIT. Vinod, Ed Tully, and
Tanaka-san often had their office invaded by me for social visits, and their humorous views through this project was invaluable. Brian (another resident of that office), my Waltham neighbor, provided many words of advice about the operation of the laboratory, life in general, and stereos. Sephir, who I keep following, was always helpful and a great encouragement. The other members of the Sloan Automotive Laboratory have also been friendly and supportive: Przemak, Yianni, Dan, Yong, Jim, Halim, Adam, Michael, Tony, Liang, Ertan, Ferran, and Jennifer.
Finally, I would like to thank my friends outside of MIT who have been
supportive of my efforts and who think that I can fix their car after my experience here. I am not going to list everyone's name, as they probably will not read my thesis, but they know who they are. I am indebted to my parents, who have backed every decision that I have made. Without their help, I would not have made it this far.
Many people have had a hand, indirectly or directly, in this project. It is nice to see the compilation of the efforts of so many people.
efad
Smutaze January 18, 2002TABLE OF CONTENTS
Abstract ... 3
Acknow ledgem ents ... 5
Table of Contents ... 7
List of Tables... 9
List of Figures ... 11
N om enclature ... 15
Chapter 1: Introduction and Background... 17
1.1: Issues W ith Em issions ... 17
1.2: Em issions Standards... 17
1.3: Technical Background ... 19
1.3.1: Engine Em issions ... 19
1.3.2: N orm al Catalyst Function ... 20
1.3.3: Catalyst D eterioration ... 22
1.4: O bjective ... 23
Chapter 2: Experim ental Setup ... 25
2.1: Introduction ... 25
2.2: Experim ental Setup ... 25
2.2.1: Engine and D ynam om eter Control... 25
2.2.2 Catalytic Converters... 27
2.2.3: Fuel U sed ... 27
2.2.4: O il U sed ... 28
2.3 D iagnostics ... 28
2.3.1 D ata A cquisition... 28
2.3.2 A ir/Fuel R atio M easurem ent and Theory... 28
2.3.3 H ydrocarbon M easurem ent and Theory... 30
2.3.4 N O M easurem ent and Theory ... 30
2.3.5: Carbon M onoxide M easurem ent and Theory ... 31
2.3.6: Tem perature M easurem ent... 32
2.3.7: Locations of Sam pling Probes ... 32
Chapter 3: Steady State Results and D iscussion ... 37
3.1 Introduction ... 37
3.2 Steady State Em issions and Catalyst Efficiency ... 38
3.2.1 Steady State H ydrocarbon Results ... 38
3.2.2 Steady State O xide of N itrogen R esults... 39
3.2.3 Steady State Catalyst Tem perature Trends ... 40
3.2.4 Steady State Carbon M onoxide Results... 41
3.2.5 Differences in Pre- and Post-Catalyst Oxygen Sensors ... 42
3.2.6: Engine V olum etric Efficiency... 44
3.3 Steady State Conclusions ... 45
Chapter 4: R apid Transients Results and Discussion... 53
4.1 Introduction ... 53
4.2- Transient Tests ... 53
4.2.2: Definition of Terminology ... 54
4.2.3 Transients with 4K Catalyst ... 55
4.2.3.1: Slow Transient with the 4K Catalyst ... 55
4.2.3.2: Fast Throttle Transient with the 4K Catalyst ... 56
4.2.3.3: Multiple Steps Throttle Transients with the 4K Catalyst... 57
4.3 Transients with the Aged Catalysts... 57
4.4 Conclusions From Transient Tests...58
Chapter 5: Oxygen Storage Tests...85
5 .1: Introdu ction ... 85
5.2 Oxygen Storage Calculation Methodology ... 85
5.2: Oxygen Storage Test Results ... 87
5.2.1: Determination of Rich Starting Point...87
5.2.2: Rich to Lean Transitions ... 88
5.2.2.1:Temperature Rise Phenomenon ... 89
5.3: Conclusions From Oxygen Storage Tests ... 90
Chapter 6: Conclusions and Further Research Directions ... 127
6 .1: C onclu sion s ... 127
6.2: Further Research Directions... 128
Appendix A: Step Motor Program Code... 129
Appendix B: Fuel Properties [15] ... 131
Appendix C: Steady State Matlab Code... 133
Appendix D: Water Content In Spark Ignition Exhaust [4]... 135
Appendix E: Tables of Steady State Emissions Measurements and Efficiency ... 137
Appendix F: MATLAB Code Used To Evaluate Transients ... 139
Appendix H: MATLAB Code Used to Evaluate Oxygen Storage... 145
Appendix I: Air/Fuel Modulation and Oxygen Supplied to the Catalyst... 149
Appendix J: Calculation of HC Contribution to Temperature Rise ... 151
LIST OF TABLES
T able 2.1: Engine Specifications... 25
Table 2.2: Dynamometer controller specifications ... 26
Table 2.3: Catalyst Ages and Aging Time... 27
Table 2.4: PCI-6025E Specifications ... 28
Table 2.5: Horiba MEXA-1 10X specifications ... 29
Table 2.6: Cambustion HFR400 Fast FID specifications ... 30
Table 2.7: Cambustion fNOx400 Fast CLD Specifications... 31
Table 2.9: Axial Locations of Upstream Sensors... 33
Table 2.10: Axial Locations of Downstream Sensors... 33
Table 2.11 Axial Locations of Thermocouple Probes... 33
Table 3.1: Data Recorded for Each of the Three Experiments ... 37
Table 3.2 Differences in Pre- and Post- Catalyst UEGO Readings @ 1600 RPM...43
Table 3.3: Differences in Pre- and Post-Catalyst UEGO Readings @ 2000 RPM...44
Table 3.4: Volum etric Efficiency M ap ... 45
Table 4.1: Programmed Throttle Opening and Closing Times for Transient Tests...54
Table 5.1: Summary of Oxygen Depletion Times ... 88
LIST OF FIGURES
Figure 1.1: H istory of N Ox Em issions... 18
Figure 2.1: Schem atic of X Control... 34
Figure 2.2: Schematic of Engine/Catalyst Setup... 35
Figure 3.1: Pre-Catalyst HC Emissions as a Function of Upstream X, 0.5 Bar MAP... 46
Figure 3.2: Post-Catalyst HC Emissions as a Function of Upstream X, 0.5 Bar MAP ... 46
Figure 3.3: Steady State HC Efficiency vs. Upstream X @ 1600 RPM, 0.5 Bar MAP .. 47
Figure 3.4: Steady-State HC Efficiency vs. Upstream X @ 2000 RPM, 0.5 Bar MAP.. 47
Figure 3.5: Pre-Catalyst NOx Emissions as a Function of Upstream X, 0.5 Bar MAP .. 48
Figure 3.6: Post-Catalyst NOx Emissions as a Function of Upstream X, 0.5 Bar MAP. 48 Figure 3.7: Steady State NOx Efficiency vs. Upstream X @ 1600 RPM, 0.5 Bar MAP Efficiency values = 0 for X >= 1.05 in this experimental run ... 49
Figure 3.8: Steady State NOx Efficiency vs. Upstream X @ 2000 RPM, 0.5 Bar MAP Efficiency values = 0 for X >= 1.05 in this experimental run ... 49
Figure 3.9: Steady State Brick Temperature vs. Upstream X, 0.5 Bar MAP ... 50
Figure 3.10: Steady State Mid-Catalyst Temperature vs. Upstream X, 0.5 Bar MAP .... 50
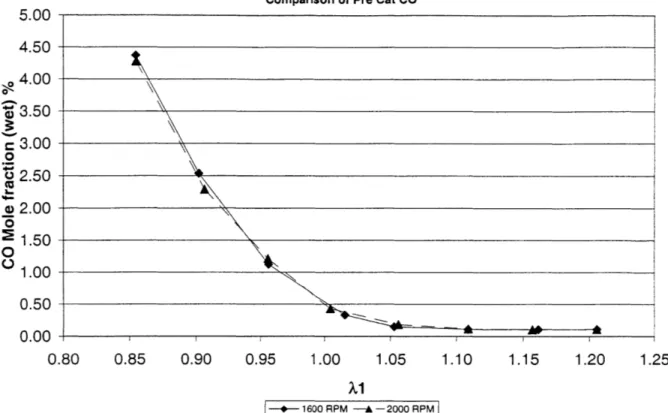
Figure 3.11: Steady State Pre-Catalyst CO vs. Upstream X, 0.5 Bar MAP ... 51
Figure 3.12: Downstream X vs. Upstream X @ 1600 RPM, 0.5 Bar MAP... 51
Figure 3.13: Downstream X vs. Upstream X @ 1600 RPM, 0.5 Bar MAP... 52
Figure 3.14: Volumetric Efficiency M ap ... 52
Figure 4.1: Definition of Some Chapter 4 Terminology... 60
Figure 4.2: Slow Transient Pre- and Post-Catalyst (4K) X ... 60
Figure 4.3: Slow Transient Pre- and Post-Catalyst (4K) HC ... 61
Figure 4.4: Slow Transient Pre- and Post-Catalyst (4K) NOx ... 61
Figure 4.5: Slow Transient Catalyst Brick and Mid-Catalyst (4K) Temperature ... 62
Figure 4.6: Fast Transient Pre- and Post-Catalyst (4K) X ... 62
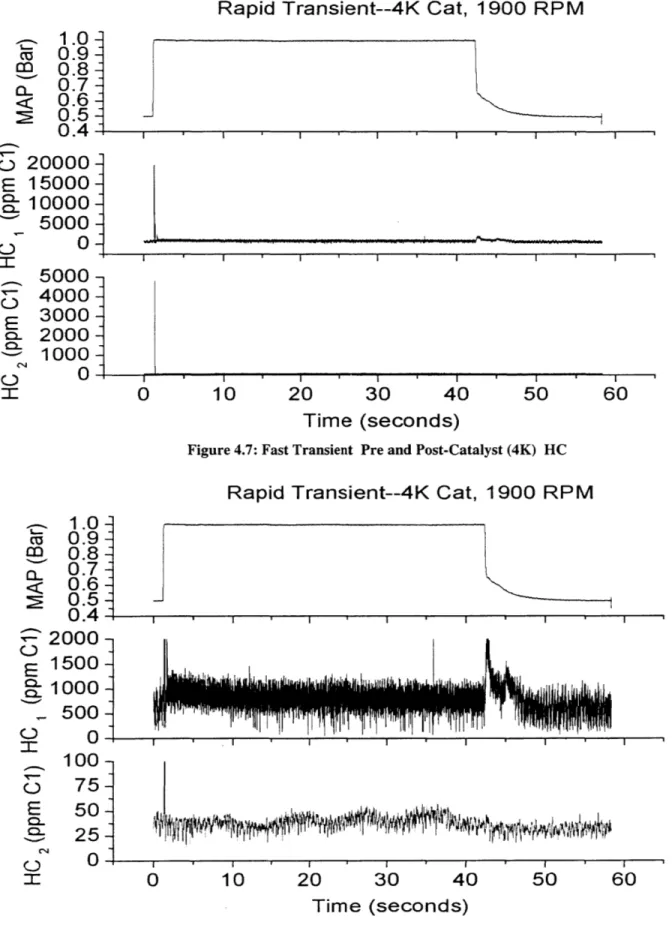
Figure 4.7: Fast Transient Pre- and Post-Catalyst (4K) HC... 63
Figure 4.8: Fast Transient Expanded Pre- and Post-Catalyst (4K) HC... 63
Figure 4.9: Fast Transient Pre- and Post-Catalyst (4K) NOx ... 64
Figure 4.10: Fast Transient Catalyst Brick and Mid-Catalyst (4K) Temperature...64
Figure 4.11: Multiple Steps Transient Pre- and Post-Catalyst (4K) X ... 65
Figure 4.12: Multiple Steps Transient Pre- and Post-Catalyst (4K) HC... 65
Figure 4.13: Multiple Steps Transient Expanded Pre- and Post-Catalyst (4K) HC... 66
Figure 4.14: Multiple Steps Transient Pre- and Post-Catalyst (4K) NOx... 66
Figure 4.15: Multiple Steps Transient Catalyst Brick and Mid-Catalyst (4K) T em p eratu re ... 6 7 Figure 4.16: Slow Transient Pre- and Post-Catalyst (50K) X ... 67
Figure 4.17: Slow Transient Pre- and Post-Catalyst (50K) HC ... 68
Figure 4.18: Slow Transient Pre- and Post-Catalyst (50K) NOx... 68
Figure 4.19: Slow Transient Catalyst Brick and Mid-Catalyst (50K) 'Temperature ... 69
Figure 4.20: Fast Transient Pre- and Post-Catalyst (50K) X ... 69
Figure 4.21: Fast Transient Pre- and Post-Catalyst (50K) HC... 70
Figure 4.24: Fast Transient Catalyst Brick and Mid-Catalyst (50K) Temperature...71
Figure 4.25: Multiple Steps Transient Pre- and Post-Catalyst (50K) X ... 72
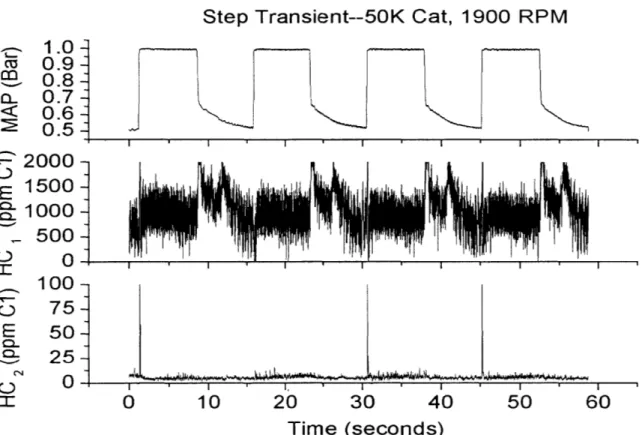
Figure 4.26: Multiple Steps Transient Pre- and Post-Catalyst (50K) HC... 72
Figure 4.27: Multiple Steps Transient Expanded Pre- and Post-Catalyst (50K) HC...73
Figure 4.28: Multiple Steps Transient Pre- and Post-Catalyst (50K) NOx...73
Figure 4.29: Multiple Steps Transient Catalyst Brick and Mid-Catalyst (50K) T em p eratu re ... 74
Figure 4.30: Slow Transient Pre- and Post-Catalyst (150K) X ... 74
Figure 4.31: Slow Transient Pre- and Post-Catalyst (150K) HC ... 75
Figure 4.32: Slow Transient Pre- and Post-Catalyst (150K) NOx ... 75
Figure 4.33: Slow Transient Catalyst Brick and Mid-Catalyst (150K) Temperature ... 76
Figure 4.34: Fast Transient Pre- and Post-Catalyst (150K) X ... 76
Figure 4.35: Fast Transient Pre- and Post-Catalyst (150K) HC... 77
Figure 4.36: Fast Transient Expanded Pre- and Post-Catalyst (150K) HC... 77
Figure 4.37: Fast Transient Pre- and Post-Catalyst (150K) NOx ... 78
Figure 4.38: Fast Transient Catalyst Brick and Mid-Catalyst (150K) Temperature...78
Figure 4.39: Multiple Steps Transient Pre- and Post-Catalyst (150K) X ... 79
Figure 4.40: Multiple Steps Transient Pre- and Post-Catalyst (150K) HC... 79
Figure 4.41: Multiple Steps Transient Expanded Pre- and Post-Catalyst (150K) HC.... 80
Figure 4.42: Multiple Steps Transient Pre- and Post-Catalyst (150K) NOx... 80
Figure 4.43: Multiple Steps Transient Catalyst Brick and Mid-Catalyst (150K) T em p eratu re ... 8 1 Figure 4.44: Slow Transient Primary Peak NOx Breakthrough... 81
Figure 4.45: Slow Transient Secondary Peak NOx Breakthrough... 82
Figure 4.46: Fast Transient Primary Peak NOx Breakthrough ... 82
Figure 4.47: Fast Transient Secondary Peak NOx Breakthrough ... 83
Figure 4.48: Multiple Steps Transient Primary Peak NOx Breakthrough: Values are A veraged O ver 4 C ycles ... 83
Figure 4.49: Multiple Step Transient Secondary Peak NOx Breakthrough: Values are A veraged O ver 4 C ycles ... 84
Figure 4.50: Fast Transient Expansion of Pre- and Post-Catalyst X ... 84
Figure 5.1: Definition of Oxygen Storage Terminology... 92
Figure 5.2: Comparison of Rich Starting Points ... 93
Figure 5.3: Oxygen Flush Times: 1600 RPM 4K Catalyst ... 94
Figure 5.4: 0.9541.05 Step HC 1600 RPM 4K Catalyst ... 94
Figure 5.5: 0.9541.05 Step NOx 1600 RPM 4K Catalyst ... 95
Figure 5.6: 0.9541.05 Step Catalyst Brick and Mid-Catalyst Temperatures 1600 RPM 4 K C ataly st ... 9 5 Figure 5.7: 0.95-)1.1 Step HC 1600 RPM 4K Catalyst ... 96
Figure 5.8: 0.9541.1 Step NOx 1600 RPM 4K Catalyst ... 96
Figure 5.9: 0.954 1.1 Step Catalyst Brick and Mid-Catalyst Temperatures 1600 RPM 4K C ataly st... 9 7 Figure 5.10: 0.9541.2 Step HC 1600 RPM 4K Catalyst ... 97
Figure 5.11: 0.9541.2 Step NOx 1600 RPM 4K Catalyst ... 98
Figure 5.12: 0.9541.2 Step Catalyst Brick and Mid-Catalyst Temperatures 1600 RPM 4 K C ataly st ... 9 8
Figure 5.13: 0.95+1.05 Step HC 1600 RPM 50K Catalyst ... 99
Figure 5.14: 0.9541.05 Step NOx 1600 RPM 50K Catalyst ... 99
Figure 5.15: 0.95-1.05 Step Catalyst Brick and Mid-Catalyst Temperatures 1600 RPM 50K C atalyst... 10 0
Figure 5.16: 0.95-)1.1 Step HC 1600 RPM 50K Catalyst ... 100
Figure 5.17: 0.954 1.1 Step NOx 1600 RPM 50K Catalyst ... 101
Figure 5.18: 0.95+ 1.1 Step Catalyst Brick and Mid-Catalyst Temperatures 1600 RPM 50 K C ataly st ... 10 1
Figure 5.19: 0.9541.2 Step HC 1600 RPM 50K Catalyst ... 102 Figure 5.20: 0.9541.2 Step NOx 1600 RPM 50K Catalyst ... 102 Figure 5.21: 0.9541.2 Step Catalyst Brick and Mid-Catalyst Temperatures 1600 RPM 50K C atalyst ... 10 3
Figure 5.22: 0.9541.05 Step HC 1600 RPM 150K Catalyst ... 103
Figure 5.23: 0.95+1.05 Step NOx 1600 RPM 150K Catalyst ... 104 Figure 5.24: 0.9541.05 Step Catalyst Brick and Mid-Catalyst Temperatures 1600 RPM 150 K C atalyst ... 104 Figure 5.25: 0.95 41.1 Step HC 1600 RPM 150K Catalyst ... 105
Figure 5.26: 0.95-41.1 Step NOx 1600 RPM 150K Catalyst ... 105
Figure 5.27: 0.95-41.1 Step Catalyst Brick and Mid-Catalyst Temperatures 1600 RPM 150K C atalyst ... 106
Figure 5.28: 0.9541.2 Step HC 1600 RPM 150K Catalyst ... 106
Figure 5.29: 0.9541.2 Step NOx 1600 RPM 150K Catalyst ... 107
Figure 5.30: 0.9541.2 Step Catalyst Brick and Mid-Catalyst Temperatures 1600 RPM 150 K C atalyst... 10 7
Figure 5.31: 0.9541.05 Step HC 2000 RPM 4K Catalyst ... 108
Figure 5.32: 0.9541.05 Step NOx 2000 RPM 4K Catalyst ... 108
Figure 5.33: 0.9541.05 Step Catalyst Brick and Mid-Catalyst Temperatures 2000 RPM 4 K C ataly st ... 10 9
Figure 5.34: 0.95+)1.1 Step HC 2000 RPM 4K Catalyst ... 109
Figure 5.35: 0.95+)1.1 Step NOx 2000 RPM 4K Catalyst ... 110
Figure 5.36: 0.95--> 1.1 Step Catalyst Brick and Mid-Catalyst Temperatures 2000 RPM 4 K C ataly st... 1 10
Figure 5.37: 0.954 1.2 Step HC 2000 RPM 4K Catalyst ... 111
Figure 5.38: 0.9541.2 Step NOx 2000 RPM 4K Catalyst ... 111
Figure 5.39: 0.9541.2 Step Catalyst Brick and Mid-Catalyst Temperatures 2000 RPM 4 K C ataly st... 1 12 Figure 5.40: 0.9541.05 Step HC 2000 RPM 50K Catalyst ... 112 Figure 5.41: 0.9541.05 Step NOx 2000 RPM 50K Catalyst ... 113
Figure 5.42: 0.954 1.05 Step Catalyst Brick and Mid-Catalyst Temperatures 2000 RPM 50 K C atalyst ... 113
Figure 5.43: 0.95 41.1 Step HC 2000 RPM 50K Catalyst ... 114 Figure 5.44: 0.954 1.1 Step NOx 2000 RPM 50K Catalyst ... 1 -14
Figure 5.45: 0.954 1.1 Step Catalyst Brick and Mid-Catalyst Temperatures 2000 RPM 50 K C ataly st ... 1 15
Figure 5.46: 0.954 1.2 Step HC 2000 RPM 50K Catalyst ... 115
Figure 5.48: 0.9541.2 Step Catalyst Brick and Mid-Catalyst Temperatures 2000 RPM 50 K C atalyst ... 116
Figure 5.49: 0.95-->1.05 Step HC 2000 RPM 150K Catalyst ... 117
Figure 5.50: 0.9541.05 Step NOx 2000 RPM 150K Catalyst ... 117
Figure 5.51: 0.95-41.05 Step Catalyst Brick and Mid-Catalyst Temperatures 2000 RPM 150 K C ataly st ... 118
Figure 5.52: 0.95-)1.1 Step HC 2000 RPM 150K Catalyst ... 118
Figure 5.53: 0.9541.1 Step NOx 2000 RPM 150K Catalyst ... 119
Figure 5.54: 0.95- 1.1 Step Catalyst Brick and Mid-Catalyst Temperatures 2000 RPM 150 K C ataly st ... 1 19
Figure 5.55: 0.9541.2 Step HC 2000 RPM 150K Catalyst ... 120 Figure 5.56: 0.9541.2 Step NOx 2000 RPM 150K Catalyst ... 120 Figure 5.57: 0.951.2 Step Catalyst Brick and Mid-Catalyst Temperatures 2000 RPM 150 K C atalyst ... 12 1 Figure 5.58: 0.9541.2 Step Catalyst Extended Brick and Mid-Catalyst Temperatures 2000 R PM 150K C atalyst ... 121 Figure 5.59: 0.95 4 1.1 Step X Comparison of 4K, 50K, and 150K catalysts ... 122 Figure 5.60: 0.954 1.1 Step HC Breakthrough Comparison of 4K, 50K, and 150K
cataly sts ... 12 2 Figure 5.61: 0.95 4 1.1 Step Mid-Catalyst Temperature Comparison of 4K, 50K, and
150 K catalysts ... 123
Figure 5.62: 0.954 1.1 Step NOx Breakthrough Comparison of 4K, 50K, and 150K cataly sts ... 12 3
Figure 5.63: Oxygen Storage of 4K, 50K, 150K Catalyst as a Function of the
L ean S tep ... 12 4 Figure 5.64: Oxygen Storage of 4K, 50K, 150K Catalyst as a Function of the Catalyst A g e ... 12 4 Figure 5.65: Oxygen Storage of 4K, 50K, 150K Catalyst as a Function of the Maximum C atalyst B rick T em perature ... 125
NOMENCLATURE
Meaning
4K 50K 150K CAA CaHb CLD CmHn CO CO2 ECU FED FTP H2 H20 HC MAP NDIR NO NO2 NOx 02 03 RHS RPM Stoich TWC UEGO WOTMeaning
Average molecular weight of i Diffusion coefficient of
Faraday constant=96485.3415(39) C mo 11
Enthalpy of stream i
Mole fraction of component i
Acronyms/
Abbreviations
2 2 5 1 4,000 50,000 150,000Clean Air Act
Fuel with a carbon molecules and b hydrogen molecules
Chemiluminescence Detector
Hydrocarbon molecule with m carbon and n hydrogen atoms
Carbon Monoxide Carbon dioxide
Engine Control Unit [or Computer] Flame Ionization Detector
Federal Test Procedure Nitrogen
Water Hydrocarbon
Manifold Absolute Pressure Non Dispersive Infra Red Nitric Oxide
Nitrogen Dioxide Oxides of nitrogen Oxygen
Ozone
Right Hand Side Revolutions Per Minute stoichiometric
Three-Way Catalyst
Universal Exhaust Gas Oxygen sensor Wide Open Throttle
First
Occurrence
(Chapter)
3 3 3 1 1 2 1 1 1 2 2 1 1 1 1 4 2 I 1 1 1 2 5 3 2 1 2 4First
Occurrence
(Chapter)
5Symbol
MWi Di F X iMass flow rate of i 2 M i
Ip Pumping current of oxygen sensor 2
L Length of gas diffusion path 2
mi Mass of i 3
MO2stored Mass of 02 stored
N Engine speed, rev/s 3
P' Partial pressure 2
Qchem Chemical heat release 5
R Univeral Gas Constant (8.314 J/mol-K) /molecular 2
weight
S Cross section of gas diffusion path 2
T Temperature 2
Vd Displaced volume 3
V0 Oxygen sensor voltage output 2
y Mass fraction of i 5
Volumetric efficiency 3
Relative ratio of air/fuel to a stoichiometric mixture 1
CHAPTER 1: INTRODUCTION AND BACKGROUND
1.1: ISSUES WITH EMISSIONS
It is hard to imagine a world without the automobile, as the automobile has grown (especially in the Western world) to be a symbol of personal freedom. However, there is a downside having many people with this personal freedom: the increase in pollutants due to the increase in automobiles on the road. The three main pollutants of concern to health and the environment emitted from internal combustion engines are hydrocarbons
(HG), oxides of nitrogen (NOx), and carbon monoxide (CO).
Lower level atmospheric ozone is formed by the reactions of NOx and volatile organic compounds when exposed to sunlight. Ozone, when in the lower atmosphere, is the main ingredient in smog, which is present in many urban areas. Short-term (1-3 hours) exposure to ozone has been linked to increased respiratory problems. Prolonged exposure to ozone can cause lung inflammation and permanently change the lung structure, leading to chronic respiratory illness. Ozone also affects crop health, can damage trees and plants, and chemically attacks elastomers [1].
In addition to being an ozone precursor, NOx also has detrimental health effects. The oxides of nitrogen irritate the lungs and lower the body's resistance to respiratory infection. NOx is a precursor to acid rain, and also may affect local ecosystems by altering growth patterns and changing the balance of species [1].
Carbon monoxide affects the human body negatively by reducing the delivery of oxygen to the body's organs and tissues. Long term exposure to CO is associated with impairment of visual perception, work and learning ability, and the ability to perform complex tasks [1].
1.2: EMISSIONS STANDARDS
Even though internal combustion engines have been in existence since the 1860s,
it is only in the past half-century that emissions regulations have become a large design
factor. The United State's Clean Air Act (CAA) passed in 1970 was the first step in legislative regulation of engine emissions. In response to the health risks and the
increasing vehicle population, the EPA has continually been lowering the emissions standards. The latest set of national standards, Tier 2, will limit the amount of NOx produced by new passenger vehicles to 0.07 grams/mile by the year 2007. CO emissions standards will be required to be 4.2 g/mile by 2007. The non-methane organic
compounds must be less than 0.09 g/mile. These standards are sales-weighted fleet averages, and there is a proposed system in place for manufacturers to receive credit if their fleet average is less than the Tier 2 standard and be able to bank this extra credit in case the next model years do not meet the standards. Phase-in steps are in place so that the emissions standards are gradually reduced to the Tier 2 levels from the current levels [2].
Figure 1.1 shows the history of emissions standards for NOx and how the standards have seen a 98% reduction in allowable NOx emissions levels [3]. The allowable levels of HC and CO follow similar trends.
History of NOx reduction
3.5 3.1 3 0, 2 0 z S1.5 0 0.5 2 0.6 0.07 1975 1977 1981 1994 1994 2007 Year
Figure 1.1: History of NOx Emissions [1]
From Figure 1.1, it is obviously important that steps be taken to reduce emissions to meet the EPA standards. Modem engine designers must design the engine in such a way that it produces low emissions, but even the emissions from advanced engine designs
are not at low enough levels to pass legal requirements. An additional measure must be added to the engine to complete the emissions-reducing task.
Introduced in the late 1970s, the catalytic converter (or catalyst) treats the engine exhaust to reduce the pollutants by approximately a factor of ten. This treatment is effective, provided that the engine is run with a near stoichiometric air/fuel ratio. Located between the exhaust port and the muffler in the exhaust system of a spark ignition engine, a fresh catalyst removes 96-98% of the pollutants that it encounters. However, as the car is driven over its life cycle, the catalyst efficiency deteriorates. The effects from this aging are important to quantify, as the effect of aging affects the manufacturer's ability to meet the strict emissions requirements. To meet these requirements, researchers are interested in quantifying as well as understanding qualitatively the effects of aging of the catalyst.
1.3: TECHNICAL BACKGROUND
1-.3.1:
Engine Emissions
As mentioned earlier, the three main pollutants emitted from spark-ignition engines are: carbon monoxide (CO), oxides of nitrogen (NOx), and hydrocarbon particles
(HG). If theoretical chemistry held, the following equation would hold and no pollutants
would be formed from the combustion process [4]:
ab (a+b 2) -b Ha+bN
CHb +<a + + 3.773N2
)->
aCO, + 3.773Ka +- 1.However, actual combustion resembles more of the following equation [4]:
CaHb + a+ (0,+3.773N2
)-
xcfHCmHn + XcOCO +4 )1.2
XCOCO,+XHOHO+ XN23.77 a +bjN, + XH H, +X,0,+
4
XNONO+ XNONO.
As may be seen from equation 1.2. pollutants are formed in addition to the fully oxidized fuel products of equation 1.1. The reasons of the three pollutants of concern form will be discussed next.
Carbon monoxide formation is mainly a function of the air/fuel ratio; a fuel rich mixture leads to more CO formation. The spark-ignition engine is typically run near stoichiometric (meaning there is the exact amount of air present to completely oxidize the fuel), but at full load, the engine is run fuel rich (there is less air present than is needed to
completely oxidize the fuel) to ensure appropriate engine response to driver input. From the stoichiometric point to a X of 0.8, CO increases from approximately 0.5 volume percent to 8 volume percent. CO emissions are not considered important in compression ignition engines because these engines are typically run lean, and thus are not in the CO formation regime [4].
The oxides of nitrogen in a spark ignition engine are typically NO and NO2,
although the amount of NO2 formed is typically negligible compared to the amount of
NO formed. NO2 forms at lower temperatures than are present during combustion events
in a typical engine. NO formation is primarily a temperature driven phenomenon, with higher in-cylinder temperature leading to a higher concentration of NO. Engine variables that affect NO formation are spark timing, amount of dilution in the charge, and air-fuel ratio. NO emissions peak around an air/fuel ratio of 16.5, and decrease as the mixture is leaned or enriched [4].
Hydrocarbons are the result of partially oxidized fuel particles. Current
understanding on the presence of hydrocarbons in the exhaust is that they result from four main contributions. The first contribution is the crevices in the combustion chamber; during high-pressure compression in the cycle, the fuel molecules are pushed into the crevice regions and therefore cannot be fully burned. Absorption/desorption from the hydrocarbon components of the engine oil also occurs. The third cause is incomplete combustion, and the fourth cause is engine deposits. These all factor into the presence of hydrocarbons in the exhaust [4].
1.3.2: Normal Catalyst Function
Along with hydrocarbons, NOx, and CO, the engine exhaust exiting the manifold
also contains water (H20), carbon dioxide (CO2), hydrogen (H2), and oxygen (02). The modern three-way catalyst simultaneously oxidizes the CO and HC, and reduces the NOx. The oxidation reactions are [5]:
CyHn + (1+n/4)0 2 4 yCO2 + n/2 H20 1.3
CO + 102 CO2 1.4
CO+H 20 4 C0 2+ H2 1.5
The reduction reactions that occur are [5]:
NO + CO - N2+CO2 1.6
NO+H 2 4 /N 2 + H20 1.7
(2 + n/2) NO + CyHn 4 (1+ n/4) N2 + yCO2 + n/2 H20 1.8
The reason that the TWC performs best when run near stoichiometric may be seen from the reactions; the catalyst needs the three pollutants present in order to react with each other and form the desired species.
Another function that has been added into modem catalysts is the capability of oxygen storage. The oxygen storage is achieved with the addition of ceria (CeO2), which
has the additional benefit of strengthening the structure of the catalyst. A concentration of 30 % was found to maximize aged catalyst performance [6]. The ceria reactions are
performed as follows [5]:
During fuel-rich conditions:
CeO2 + CO 4 Ce2O3 + CO2 1.9
During fuel lean conditions:
Ce203 + 02 - CeO2 1.10
Thus, when the engine is running in a slightly lean condition, the catalyst can store oxygen on the ceria, and then use this oxygen during the rich conditions to oxidize the
CO and HC. Ceria also has another benefit: it is a steam-reforming catalyst. Ceria
promotes the reactions of CO and HC with H20 to form H2. The H2 formed from this
reaction then reduces a portion of the NOx to N2 [5].
Engine controllers take advantage of the oxygen storage of the catalyst by using closed-loop feedback control. Typically oxygen sensors are mounted upstream and downstream of the catalyst. The upstream oxygen sensor is used for the engine feedback. This sensor determines whether the engine is running rich or lean and communicates this back to the engine control computer. The engine control computer then uses closed loop control to adjust the fueling to the proper levels. In practice, the A/F value is modulated
around stoichiometric to take advantage of the oxygen storage capacity of the catalyst. Then the conversion efficiency window for the three pollutants becomes wider with respect to the mean value of the A/F modulation. This larger control window allows the performance of the catalytic converter to be less susceptible to control errors and allows for efficient use of the precious metal. Perturbations of ± 0.5 A/F and a frequency of
approximately 1.5 Hz yield the best use of the precious metal loading and lead to a higher catalyst efficiency [4,7,8].
1.3.3: Catalyst Deterioration
As the catalytic converter ages, its conversion efficiency decreases. The three main sources of deactivation are: thermal deactivation, catalyst poisoning, and less frequently, wash coat loss. Thermal deactivation occurs with sintering of the noble metal sites where the reactions actually take place. Sintering reduces the number of active sites, thus physically reducing the exposed catalyst area. Catalyst poisoning refers to the
chemical deactivation of the sites by chemicals present in the exhaust. Poisons that affect the catalyst include sulfur, phosphorus, halogenides, and metals (such as zinc). It is also reported that the poisoning effect is accelerated by sintering [9].
Fuel sulfur causes SO2 to form during stoichiometric and rich combustion. The
S02 bonds to the precious metal sites in the catalyst and blocks reactions from occurring at that site. The orders of sensitivity of the precious metals used in the catalyst are palladium, platinum, and rhodium, listed in order of decreasing sensitivity. Under stoichiometric and lean conditions, sulfur decreases the oxygen storage of the catalyst by reacting with the ceria and forming Ce2(SO4)3, thus effectively blocking the ceria from
being used for oxygen storage. The reversibility of sulfur poisoning is something that depends on catalyst formulation, and must be done at high temperature (> 700 C) with varying rich/lean excursions to decompose sulfur from the catalyst surface [10]. Most of the sulfur effects are reversible, but some are irreversible. Studies have found that an 18 to 96 % reversibility of the sulfur effects, depending on the driving cycle used and the pollutant considered for comparison [I1].
1.4: OBJECTIVE
The objective of this work is to understand the engine and catalyst system
behavior. It is desired to comprehend what governs the effectiveness of the catalyst when there are substantial A/F excursions such as imperfectly compensated throttle transients. Also desired is to examine in depth what happens to the catalyst as it ages and how the engine control may be changed to improve catalyst efficiency. This study endeavors to take a systems approach to the engine and catalyst combination, seeing ways that the two interact with one another. Fast-response emissions diagnostics allow further insight so that rapid step changes used to perturb the system can be tracked through the
CHAPTER 2: EXPERIMENTAL SETUP
2.1: INTRODUCTION
The setup used an Original Equipment Manufacturer (OEM) engine with as few modifications as possible, making the experiment applicable to vehicles currently in production. A production 1998 DaimlerChrysler minivan engine was used, with 2001 model year (MY) catalysts attached to the exhaust system. Fast response instruments were used to measure HC and NOx, and dual oxygen sensors were located upstream and downstream of the catalyst to determine A/F ratio and measure oxygen storage. Fast response thermocouples located in the catalytic converter provided a measure of temperature profiles.
2.2: EXPERIMENTAL SETUP
2.2.1: Engine and Dynamometer Control
The engine used for this set of experiments is a 4-cylinder DaimlerChrysler engine commercially used in the Voyager or Caravan minivan. The engine control computer is as provided in these vehicles, with no modifications. Table 2.1 shows other pertinent specifications of the engine [12].
Type In-Line Overhead Valve Dual Overhead Cam
Displacement 2.4L
Valves per Cylinder 4
Bore 87.5 mm (3.445 in)
Stroke 1OI mm (1976 in)
Compression Ratio 9.4:1
Firing Order -'1,3A2
Intake Valve Close 51 ABDC
Intake Valve Open 10 BTDC
Exhaust Valve Close 80ATDC
Exhaust Valve Ope 52 0BBDC
This engine represents a typical modem spark-ignition engine, as it has a centrally located spark plug in a pent-roof shaped combustion chamber.
To give control over the air/fuel ratio, a breakout box was installed in the fuel injection wiring. The schematic for this is shown in Figure 2.1. As may be seen in Figure 2.1, the breakout box intercepts the signal from the engine control computer
(ECU) to the injectors. The breakout box used a 555 chip to trigger its own voltage
signal. The pulse width of this signal is dependant on the input of a potentiometer. Reducing the voltage supplied to the breakout box caused the engine to run lean, as the pulse width was shortened, and increasing the voltage caused the pulse width to be lengthened, leading to rich operation. When the breakout box was being used, the engine was run open loop, meaning that the upstream OEM lambda sensor was disconnected from the engine; i.e.: there is no modulation in the air/fuel ratio.
For the X transitions (discussed in Chapter 5), two potentiometers were used with a switch that toggled control between the two. The air/fuel ratio was adjusted by using the potentiometers to obtain the desired reading on the pre-catalyst X sensor. When the desired ratio was reached, the switch was used to cause the transition from one air/fuel ratio to the other.
The dynamometer used with this engine is the absorbing only type; the engine is started as it would be in actual use with a starter motor connected to a 12-volt battery. The dynamometer is from Froude Consine Limited, model AG80, capable of absorbing
107 BHP. Controlling this dynamometer is a Digalog Series 1000A Controller, the
specifications of which are located in Table 2.2 [13]:
RPM Regulation +/- 5 from 100 to.10,000 RPM
RPM Response Engine response time
Load/Curent-Regulation 0A%%2 .
Load/Current Response Instantaneous
Table 2.2: Dynamometer controller specifications
The dynamometer can be used to hold the engine at a constant speed or at a constant load.
For the experiments detailed in the following pages, the engine was held at a constant RPM level and adjusting the intake pressure of the engine varied the load.
Intake pressure control is achieved by using a Pacific Scientific Powermax II stepper motor coupled to a Pacific Scientific 5240 Stepper Motor Indexer/Driver. The Indexer/Driver accepts commands from a 486 computer running MSDOS via a serial cable. Appendix A shows the computer code used in the various experiments. Computer control allowed precision programming of the controller, giving repeatability to the
transient throttle experiments.
2.2.2 Catalytic Converters
The catalysts used in this experiment were 2001 model year catalysts provided by DaimlerChrysler Corporation. They fit the category of Ultra Low Emissions Vehicle
(ULEV), which the EPA classifies as emitting less than 2.1 grams/mile of CO, 0.3
grams/mile of NOx, and 0.011 grams/mile of HCHO for a 10 year old/100,000 mile passenger car [14]. Coming makes the substrate of the catalyst, Johnson-Mathey applies the wash coat, and finally Arvin packages the catalyst in the final state. The catalysts contain two bricks, each having a volume of 1.23 liters. The front brick has a palladium wash coat, and the rear brick has a platinum/rhodium wash coat. Three catalysts of varying ages were used in the test matrix for these experiments, as shown in Table 2.3.
Equivalent Catalyst Age (miles) Aging Time (hours)
4,000 14
50,000 178
150,000 534
Table 2.3: Catalyst Ages and Aging Time
The catalysts were dyno-aged using a fuel sulfur level of 30 ppm. The aging process used was a DaimlerChrysler proprietary accelerated aging process that DaimlerChrysler asserts will give equivalent numbers to the actual on-vehicle catalyst aging process.
2.2.3: Fuel Used
The fuel used throughout these experiments is California P-II Certification Fuel. Some pertinent properties of the fuel are 28.2 ppm sulfur, a research octane number of 96.5 and a motor octane number of 87.8. A complete listing of the specifications may be found in Appendix B [15].
2.2.4: Oil Used
The oil used in these experiments is an additional consideration, as some of the sulfur content in the oil will find its way into the exhausted gaseous mixture. Testing of the oil at ExxonMobil revealed the oil to contain 3500 ppm sulfur.
2.3 DIAGNOSTICS
2.3.1 Data Acquisition
Data was acquired using a Labview PCI-6025E internal multifunction input/output board, a National Instruments BNC-2090 connector board, and a custom written Labview data acquisition program. The specifications of the PCI-6025E are shown below in Table 2.4.
Analog Inputs 16 single ended/ 8 differentiat
Resolution 12 bits
Maximum sampling rate 200 Kb/s
Input Range +- 10 V
Analog Outputs 2.
Analog Output Rate 10 Kb/s
Analog Output Range +/:f 10 \T
Digital 1/0 32
Counter/Timers 2,24 bit
Table 2.4: PCI-6025E Specifications
2.3.2 Air/Fuel Ratio Measurement and Theory
The relative air/fuel ratio, X, is defined as:mf mf 's'"i'h
(2.1)
This is a useful measure to track the composition of the gas stream. The ratio tracks where the gas stream is in reference to the stoichiometric air/fuel ratio. There are two types of sensors used to measure this ratio: the switching type and the Universal Exhaust Gas Oxygen Sensor (UEGO). The switching sensor is comprised of a solid electrolyte through which current is carried by oxygen ions. One side of the sensor is exposed to the
exposed to the atmosphere having oxygen partial pressure p". The voltage output from this sensor is obtained through the Nernst equation:
RT p
V,1 = RT n -- 2.2
4F p2
This type of sensor is referred to as the switching type of sensor because the partial pressure of oxygen switches from the order of 10-10 when rich to 103 Pascals when lean
[4].
The UEGO, on the other hand, is composed of three solid zirconia substrates, the first cell being a pumping cell, the second being the galvanic cell, and the third being the oxygen reference cavity. A small constant pumping current is supplied, pumping oxygen from the pumping cell to the sampling cell. In lean environments, the output of the sensor is
[16]:
4FDS
Ip = (p'-p)23
RTL
In rich environments, however, the oxygen supplied by the pumping cell is the oxygen required to oxidize the CO, H2, and hydrocarbons present in the exhaust stream. The
pumping current is then [16]:
2FS
Ip = (DH2H2 +Dc PcO +DHC PHC 2.4
RTL
The sensors used in this experiment were a Horiba MEXA-1 1OX and a NTK MO-1000. Both are the UEGO type. The specifications for the Horiba are shown below in Table
2.5.
Measurement range A/F: 10.00-30.00 A/F
X: 0.50-2.00 02: 0-25% 02
Accuracy + 0.3 A/F when 12.5 A/F
± 0.1 A/F when 14.7 A/F
± 0.5 A/F when 23.0 A/F
Recorder Output 0-1 V DC
Exhaust Gas Temp -7->900 C
-I'll. - - - I
2.3.3
Hydrocarbon Measurement and Theory
Typically, hydrocarbons have the structure of CmHn, and result from partially oxidized fuel or lubricant sources (as discussed in Section 1.3.1). The industry standard for measuring hydrocarbons is Flame Ionization Detection (FID). In this process, an exhaust sample is drawn into a sample chamber via a vacuum pump. The sample stream is held at a constant flow rate by the use of a constant differential pressure chamber. A hydrogen flame is used to combust a sample stream, which produces ionic hydrocarbons as shown in the following reaction scheme:
CH+O-CHO+ +e~
CHO+ + H2O - H3O +CO 2.5
H3O+ +e~ - 2H +OH
The second two equations listed above are formed because of the large amount of water present in the sample stream. All of these electron charges are then gathered to an electrode held at 150-200 volts negatively biased to the burner, and a current is produced which is proportional to the hydrocarbon concentration [17].
The FID used for the experimental results presented later is a Cambustion HFR400 Fast FID. This piece of research equipment has a very small response time
when compared to typical FIDs, as the hydrogen flame is contained in the sampling head, whereas with typical FIDs, the sample has to travel through a long sample tube before reaching the hydrogen flame. The specifications for the equipment are shown below in Table 2.6 [18]: Number ofchannels 2 Measurement ranges 0-2000 to 0-1,000,000 ppm CI Response Time <4 ms" . Drift <± 2% Fullscale/hour Linearity <± 2% Fullscale (@ 150,000 ppm C1) Output 0-10 Volts
Table 2.6: Cambustion HFR400 Fast FID specifications
2.3.4 NO
Measurement and Theoiry
For the measurement of NO in the exhaust stream, a Cambustion fNOx400 Fast
sample of the exhaust stream is first drawn into the sampling chamber. A stream of ozone is then introduced into the reaction chamber, causing the following reaction:
NO + 03 - NO2* + 02 (2.6)
N0 2* represents the NO2 that is in an excited state. This molecule then reverts back to
the ground state, emitting radiation in the wavelength range to 600 to 3000 nm. This light is then recorded by a photo-detector, the light emission being proportional to the NO concentration [19].
The Cambustion equipment used in this experiment uses the same sampling methodology as the Fast FID; the measurement takes place in the head of the instrument directly behind the sampling probe, resulting in a low response time. As with the fast FID, a constant pressure chamber is used to keep the sample independent of the exhaust
stream flow rate. The specifications for the fast NO meter are shown below in Table 2.7 [20]:
Number of channels 2
Measurement ranges 0-10,000 ppm
Response Time
4
msRepeatability <± 1 % Fullscale
Zero Drift < 1 % Fullscale/hour
Span Drift <± 1 % Fullscale/hour
Linearity <± I 1%Fullscaleto 5,000 ppm,
< +±2% Fullscale to 10,000 ppm
Output 0-10 Volts, 47 Ohms
Table 2.7: Cambustion fNOx400 Fast CLD Specifications
2.3.5: Carbon Monoxide Measurement and Theory
The industry standard method for the measurement of CO is Non Dispersive InfraRed (NDIR). This measurement method involves a hot glow bar that emits infrared radiation simultaneously through a cell filled with N2 and a cell filled with the sample gas
(a chopper wheel is used between the glow bar and the cells). To eliminate the IR
emission of the hot gases, the sample gas is passed through a heat exchanger before going into the sample cell. Opposite the glow bar in line to receive the radiation passed through the two sample cells are two detection cells separated by a diaphragm. The IR that passed through the N2 cell had no interference, as N2 does not absorb any IR radiation,
with CO gas, and the radiation that passes through the sample cell causes an increase in temperature in the one CO cell. This temperature differential causes a pressure difference in the two cells, and a radio frequency detector converts the deflection of the diaphragm into a voltage output [21].
The NDIR instrument used in this series of experiments was a Rosemount Analytical Model 880A. The sampling requirements of this instrument requires that the sample gas be moisture free, so the exhaust gas was run through a desiccant before entering the sample chamber. The specifications for the 880A are shown below in Table
2.8 [22].
Operating Temperature 0 to45,C
Measurement ranges 0-10% CO
Response Time 30 seconds (measured)
Repeatability 1 % Fullscale
Noise 1 % Fullscale
Zero Drift < 1 % Fullscale/ 24 hours
Span Drift I %Fullscale/ 24hf'ours
Sample Pressure Max 10 psig
Sensitivity 1Ippa filhscale CO
Table 2.8: Rosemount Analytical Model 880A specifications
2.3.6: Temperature Measurement
The catalytic converters were provided from DaimlerChrysler with two additional ports for sampling: one which fell in the middle of the front palladium brick, and the other which fell between the two bricks. These ports were used to sample temperature, which was measured using Omega Type K exposed junction thermocouples.
2.3.7: Locations of Sampling Probes
Figure 2.2 shows a schematic of the engine/catalytic converter setup (not to scale). One difference between the experimental setup and a production engine is that a short extender was inserted between the exhaust flange and the catalyst so that pre-cat measurements could be made. On the schematic is labeled where the various
measurement probes were located. Table 2.9 shows the axial location of the pre-catalyst sensors measured from the exhaust flange to the centerline of the sampling probe or instrument.
Description Axial Distance From Exhaust Manifold
Flange (cm)
Upstream FastFID 7.62
Upstream Fast NOx meter 2.54
Upstream UEGO 5.08
Table 2.9: Axial Locations of Upstream Sensors
For the downstream sensor measurements, the axial distance of the sensor placement is presented as the distance from the catalyst flange, located immediately at the catalyst exit (see Figure 2.2). The distance is shown in Table 2.10:
Description Axial Distance From Catalytic
Converter Flange (cm)
Downstream Fast FID 11.43
Downstream Fast NOx meter 5.08
Downstream UEGO 9.53
Table 2.10: Axial Locations of Downstream Sensors
Finally, the thermocouple probe locations are shown in Table 2.11, measured from the exhaust manifold flange:
Description Axial Distance From Exhaust Manifold
Flange (cm)
Mid-Brick CatalystTemperature 19.69
Between Brick Catalyst Temperature 31.12
Table 2.11 Axial Locations of Thermocouple Probes
For the radial position of the probes, the fast FID and fast NOx probes were put in the center of the exhaust plumbing to minimize wall effects and provide a true average
measure of the turbulent exhaust flow. The UEGOs were inserted using a standard flange mounting application, and so protruded -1.5 cm into the exhaust stream.
(A)'B
Engine ControI1
BreakoutBox(B
"Cominer .
Injector
Potentiometer
AII-
0 C.)Time
tiAt (B)
t2Controlled by the potentiometer
Figure 2.1: Schematic of X Control
L
At (A)
c3 0 Q tiTime
AUpstream HC, NO, Lambi Measureme ts
Downstream HC, NO, Lambda Measurements
---- I
CHAPTER 3: STEADY STATE RESULTS AND
DISCUSSION
3.1 INTRODUCTION
The experimental results presented in this chapter provide a framework for the results included in the following two chapters. First, the steady state catalyst efficiency with respect to HC and NOx are presented. These steady state values provide a reference for comparison with the transient performance of the catalytic converters. Also to be presented in this section are the values used for calculating the mass flow rate of the exhaust, which is later used in the calculation of oxygen storage.
The table below lists the three sets of experiments and what data were recorded for each of the experiments. This Chapter deals with the steady state measurements, Chapter 4 the transient tests, and Chapter 5 the oxygen storage tests.
Oxygen Storage Tests Pre-catalyst X, Post-catalyst X, Pre- and Post-Catalyst Hydrocarbon and NOx concentrations, Catalyst front brick temperature, Catalyst between brick temperature
Steady State Catalyst Efficiency Pre-catalyst}X, Post-c talyst X, Pre- and
Measurements tPo-at-aIyt Hydrocarbn O, and NOx
concentrations Catalyst front brick temperature, Catalyst between brick I temperature
3.2 STEADY STATE EMISSIONS AND CATALYST EFFICIENCY
3.2.1 Steady State Hydrocarbon Results
Using the fast FID, HC emissions were simultaneously measured before and after the catalytic converter. This set of tests was done with no engine air/fuel modulation; the engine was held at a constant air/fuel ratio. The air/fuel ratio was controlled using the control system described in Section 2.2.1. The value of the upstream UEGO was used to
set the air/fuel ratio. During the experiments, the output of the fast FID and the pre- and post catalyst X values were averaged over a time period of 20 seconds. The MATLAB code used to convert the fast FID signal to the emissions level is included in Appendix C. The calibration was done using a zero gas of N2 and span gases of 100 ppm propane, 700
ppm propane, and 1500 ppm propane before any data were recorded.
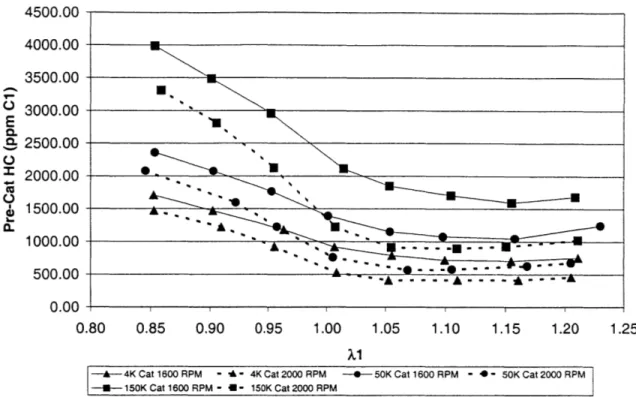
Figure 3.1 shows the pre-catalyst values of HC. As may be seen there is a variation of -2500 ppm between runs. It would be expected that there would be little difference between the various runs in the engine out emissions. However, this data was taken over a period of several days, and the instrumentation was recalibrated differently for each run. The fast FID is a sensitive instrument, and there were many fluctuations even at steady state operation. The efficiency values will still be representative, as they were taken simultaneously, thus eliminating the calibration and daily operating parameter differences.
The shape of the curve, however, is very consistent, being the highest at the richest value. At rich values, there is more fuel injected into each cylinder than is necessary for combustion, and this excess fuel is not completely oxidized. The HC emissions decrease as the mixture becomes progressively leaner. At stoichiometric and leaner, the curve is fairly flat, as these are the hydrocarbons that are trapped in the crevices of the cylinder, absorbed/desorbed in the oil, and detached cylinder deposits. These variables are constant through the varying air/fuel ratio.
Figure 3.2 shows the post-catalyst HC as a function of upstream lambda. Shown on this plot are the different catalyst values. The oldest catalyst (150K) is represented as squares, and shows the highest levels of breakthrough, as one would expect for the oldest catalyst. The 2000 RPM values, shown with the dotted line, are slightly less, most likely
due to the higher catalyst temperature that exists at the higher mass flow rate. The
middle-aged (50K) catalyst (represented as circles) HC breakthrough is lower than that of the 150K catalyst, with the same relationship between the lower and higher RPM values. The fresh catalyst (4K) has the lowest emissions. The 4K catalyst 2000 RPM and 1600 RPM curves are reversed from the order of the other catalyst ages, but these hydrocarbon values are in the low range of the fast FIID's sensitivity and so the error in this region would explain the switch in the curves.
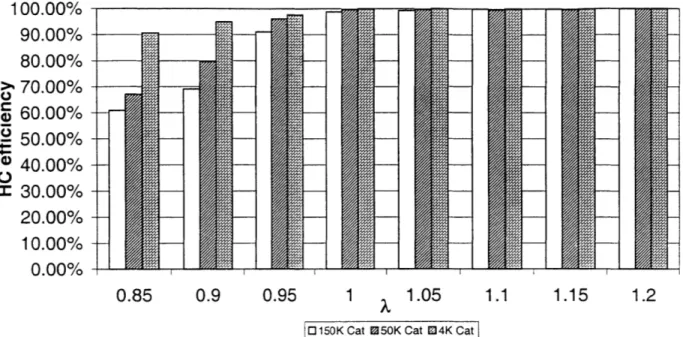
Figure 3.3 shows the catalyst efficiency with respect to HC at a speed of 1600 RPM. The efficiencies all follow the same trend; richer engine values have a lower efficiency due to the large amount of hydrocarbons produced and the lack of oxygen to oxidize them. The 150K catalyst, shown with the white bars, ranges from 3% lower efficiency at stoichiometric to 33% lower efficiency at X=0.85 that that of the 4K catalyst (shown in the bars with the brick pattern). The 50K catalyst efficiency (the bars
containing the diagonal pattern) falls between the 4K and 150K catalyst.
Figure 3.4 shows the hydrocarbon efficiency curves for the different catalysts at 2000 RPM. All of the HC efficiencies for this operating point are higher due to the increased temperature (the temperature curves will be shown later). The catalysts are represented as before with the same patterns indicating the same aged catalyst as in the plot for 1600 RPM.
3.2.2 Steady State Oxide of Nitrogen Results
The oxides of nitrogen were measured in the same manner as the hydrocarbons. The fast NOx meter was used, sampling for a time period of 20 seconds, converting the voltage output to NOx concentration, and then averaging the pre- and post-catalyst values. For calibration, 100 ppm NOx, 1000 ppm NOx, and 3000 ppm NOx gases were used, along with nitrogen as a zero gas. The MATLAB code used is included in
Appendix C (HC, NOx, and catalyst temperature were all measured simultaneously, so the same code was used to analyze the data).
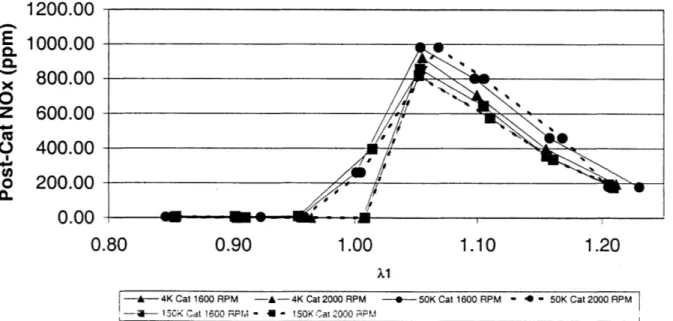
Figure 3.5 shows the variation in the upstream NOx measurements as a function of the upstream UEGO sensor value. These values are less spread out than the engine out hydrocarbons, only ranging a maximum of 250 ppm over the set of experiments. This
variation is simply due to the small variations in the engine operating conditions. The shape of the curve has the NOx peaking at a stoichiometric. NOx formation, as
mentioned in Section 1.3.1, is a function of temperature, with higher temperature leading to more NOx being formed. The highest combustion temperature occurs at
stoichiometric, as this is where the most energy release occurs. As the mixture is
enriched or leaned out, the NOx formation drops due to the temperature drop that occurs in both directions.
A comparison of the post catalyst values is shown in Figure 3.6. At rich values of
air/fuel ratio, the NOx breakthrough is essentially zero, as the CO produced during rich combustion is abundant enough to react with the majority of the NOx in the catalytic converter. The values of the NOx being so low in the rich regime make the measurement a difficult one, as there is uncertainty in the NOx meter at very low values of NOx (< 30 ppm). The NOx breakthrough may not be truly zero as shown here, but instead a very low number. At values of air/fuel ratio greater than stoichiometric, the post-catalyst NOx curve follows the pre-catalyst NOx curve, as the reduction of NOx in a lean environment is not possible under these circumstances. At stoichiometric, the 150K catalyst
(represented using the squares) shows -50% more breakthrough than that of the 50K catalyst (shown by the circles), and the 4K catalyst has no breakthrough.
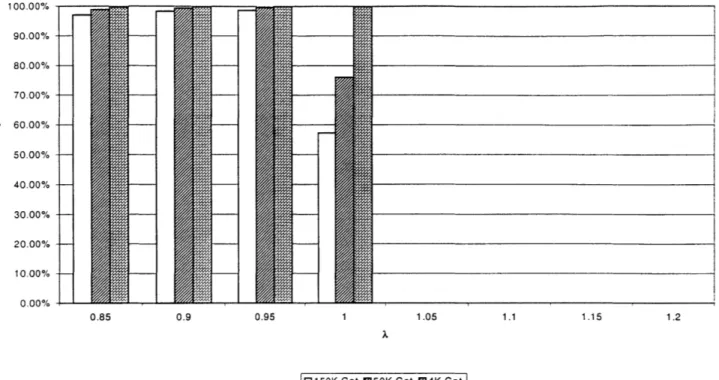
The efficiencies of the catalysts are compared in Figure 3.7. It may be seen that the 150K catalyst shows an efficiency decrease even in the rich points of the spectrum, even though there is not much NOx produced in the combustion process. This implies that there is a decrease in the active catalytic material, as at those rich points more CO is present than is necessary to reduce the NOx. The lean points again show that under these conditions the NOx cannot be reduced, with the efficiency dropping to zero independent of the catalyst age. Figure 3.8 shows similar results for 2000 RPM.
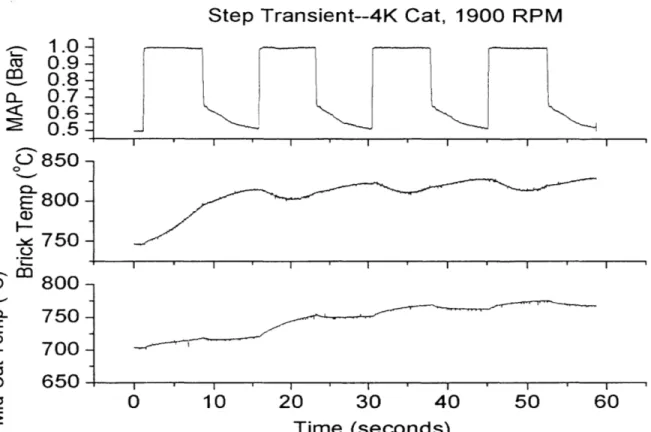
3.2.3 Steady State Catalyst Temperature Trends
The temperature of the catalytic converter is an excellent measure of the catalytic activity that is occurring inside. The brick temperature reflects the heat release produced