Publisher’s version / Version de l'éditeur:
Journal of Building Performance Simulation, pp. 1-14, 2011-04-12
READ THESE TERMS AND CONDITIONS CAREFULLY BEFORE USING THIS WEBSITE.
https://nrc-publications.canada.ca/eng/copyright
Vous avez des questions? Nous pouvons vous aider. Pour communiquer directement avec un auteur, consultez la première page de la revue dans laquelle son article a été publié afin de trouver ses coordonnées. Si vous n’arrivez pas à les repérer, communiquez avec nous à [email protected].
Questions? Contact the NRC Publications Archive team at
[email protected]. If you wish to email the authors directly, please see the first page of the publication for their contact information.
NRC Publications Archive
Archives des publications du CNRC
This publication could be one of several versions: author’s original, accepted manuscript or the publisher’s version. / La version de cette publication peut être l’une des suivantes : la version prépublication de l’auteur, la version acceptée du manuscrit ou la version de l’éditeur.
For the publisher’s version, please access the DOI link below./ Pour consulter la version de l’éditeur, utilisez le lien DOI ci-dessous.
https://doi.org/10.1080/19401493.2011.558632
Access and use of this website and the material on it are subject to the Terms and Conditions set forth at Energy performance of the Central Sunlighting System
Laouadi, A.; Coffey, B.
https://publications-cnrc.canada.ca/fra/droits
L’accès à ce site Web et l’utilisation de son contenu sont assujettis aux conditions présentées dans le site LISEZ CES CONDITIONS ATTENTIVEMENT AVANT D’UTILISER CE SITE WEB.
NRC Publications Record / Notice d'Archives des publications de CNRC:
https://nrc-publications.canada.ca/eng/view/object/?id=9535ca60-61b8-4b57-a991-17cb416a19a7 https://publications-cnrc.canada.ca/fra/voir/objet/?id=9535ca60-61b8-4b57-a991-17cb416a19a7
Ene rgy pe rfor m a nc e of t he Ce nt ra l
Sunlight ing Syst e m
N R C C - 5 3 6 1 6
L a o u a d i , A . ; C o f f e y , B .
2 0 1 1 - 0 1 - 3 1
A version of this document is published in / Une version de ce document se trouve dans:
Journal of Building Performance Simulation, pp.1-14, April, 2011
http://dx.doi.org/10.1080/19401493.2011.558632
http://www.nrc-cnrc.gc.ca/irc
The material in this document is covered by the provisions of the Copyright Act, by Canadian laws, policies, regulations and international agreements. Such provisions serve to identify the information source and, in specific instances, to prohibit reproduction of materials without written permission. For more information visit http://laws.justice.gc.ca/en/showtdm/cs/C-42
Les renseignements dans ce document sont protégés par la Loi sur le droit d'auteur, par les lois, les politiques et les règlements du Canada et des accords internationaux. Ces dispositions permettent d'identifier la source de l'information et, dans certains cas, d'interdire la copie de documents sans permission écrite. Pour obtenir de plus amples renseignements : http://lois.justice.gc.ca/fr/showtdm/cs/C-42
THE ENERGY PERFORMANCE OF THE CENTRAL SUNLIGHTING SYSTEM
A. Laouadia, and B. Coffeyb
aInstitute for Research in Construction - National Research Council of Canada, 1200 Bldg. M-24, Montreal Road, Ottawa K1A 0R6, Canada
bDepartment of Architecture - University of California, Berkeley, 232 Wurster Hall #1800, Berkeley, CA 94720-1800
ABSTRACT
This paper presents a simulation study to predict the energy performance of the Central Sunlighting System (CSS) installed in open plan offices. Several simulation tools are combined to conduct the simulations. SkyVision calculates the daylight luminous flux, and lighting and solar heat gains of the CSS. A set of coefficients pre-calculated using Radiance relates the desktop illuminances to the CSS luminous fluxes. DaySim is used to compute the daylight illuminance from the perimeter windows. ESP-r is used to compute the heating and cooling energy use of the office spaces. The results show that the CSS may save a significant amount of energy in North American climates. Energy savings from the combination of daylighting from windows and the CSS for typical, four-cubicle, open plan offices range from 44% to 57% for lighting, 8% for cooling, and from 14% to 23% for the total (lighting, cooling, and heating) energy.
INTRODUCTION
Daylighting is an important design aspect of sustainable buildings to reduce lighting energy use. In Canadian office buildings, artificial lighting makes up about 22% of the total electricity use (NRCan, 2010). Windows and skylights have been used in almost all types of buildings to reduce lighting energy use at the perimeter and under roof spaces. There are, however, very limited daylighting systems to illuminate the core spaces of buildings. The Central Sunlighting System (CSS) is a promising daylighting system for collecting and distributing sunbeam light to core building interiors. The CSS has gone through extensive design optimisation and testing, and is nearing the commercialisation stage. Predictions of its effects on the building energy performance for lighting, heating, and cooling in various climates have not yet been addressed. Those effects are necessary to help direct further development and implementation of the technology.
Core daylighting systems employ various technologies to collect, concentrate, transport, and distribute daylight (sky and sunbeam light) from the building’s exterior envelope to target areas in interior spaces of buildings. They may be categorized into two types: vertical and horizontal systems. Vertical systems collect daylight at the roof level using static or tracking optical components (such as parabolic mirrors or heliostats) and transport the daylight in vertical hollow light guides passing through building floors. Several installations have been constructed around the world (Aizenberg, 2010; Kim and Kim, 2010; Rosemann and Kaase, 2005), but the high costs of these systems have limited their market penetration. Horizontal systems, on the other hand, are mounted on the building façades, and employ horizontal hollow light guides. Several studies and demonstrations of this type of systems have been carried out, and have showed that sufficient illuminance may be achieved indoors (Callow and Shao, 2003, Greenup and Edmonds, 2004, Schlegel et al., 2004, Tsangrassoulis et al., 2005; Kwok and Chung, 2008; Hien and Chirarattananon, 2009). Capital costs of horizontal systems have also been relatively high compared to their energy savings (Rosemann et al., 2007). One of the most promising
horizontal systems is the Central Sunlighting System, which was formally known as the Solar Canopy System (Rosemann et al., 2008). This system was designed to integrate daylighting with electrical lighting in one system to save energy, and it is
claimed that the potential energy savings of the system can pay for the additional installation capital costs over an acceptable period of time (Rosemann et al., 2007). The developers of the CSS have carried out various tests to evaluate its lighting energy performance. A CSS prototype was built and installed in a portable mock-up facility. The facility was designed to mimic a typical open plan office space, with one row of cubicles served by a perimeter window on the south-facing wall. Illuminance measurements were taken at several points on the work plane under sunny and cloudy sky conditions on various days of the year. The performance of the system was evaluated with the absence or presence of the perimeter window. When the window was the sole source of daylighting (no contribution from the CSS), the measurement results showed that the average illuminance at the work plane fell below the recommended illuminance for office spaces (500 lx) at a distance roughly 3m from the window. When the window was obstructed so that the CSS became the sole source of daylighting, the results showed that the average illuminance on the work plane was greater than 700 lx on typical sunny days (Whitehead et al., 2007). The previous field measurement was used to help optimise the operation and the performance of the system, and led to a fabrication of a second prototype. At
present, the new prototype is being demonstrated in the field at the British Columbia Institute of Technology (BCIT) in Burnaby, BC (Whitehead, 2009). Five CSS
modules were built and installed at the south wall of an existing open plan office building. The lighting energy use and indoor illuminance were monitored during the measurement period. The preliminary results showed that the CSS was capable of reducing the electrical lighting energy use in the test area by more than 25%.
OBJECTIVES
The aim of the research reported in this paper is to evaluate the energy performance of a typical office building equipped with the CSS under various North American climatic conditions. The specific objectives are:
• To develop a simulation model to analyse the lighting and thermal energy performance of the CSS integrated in a typical open plan office building;
• To compare the annual simulation results with the CSS (in both the presence and absence of windows) to base case results for various North American climates.
DESCRIPTION OF THE CSS
The CSS consists of three principal components: (1) an exterior enclosure, which houses the necessary optical components to collect, re-direct and concentrate
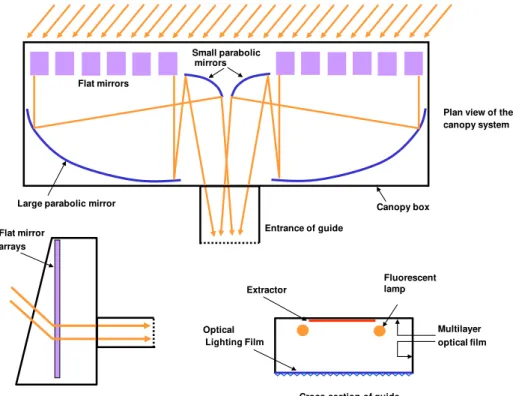
incident sunlight; (2) a light guide system to transport the collected sunlight deep into building interiors and distribute it to individual space areas requiring illumination; and (3) an electrical lighting system to complement sunlight for indoor illumination. Figure 1 shows the enclosure and the light guide of a previous CSS prototype. The enclosure is a sealed unit with a transparent front cover and opaque walls. It is composed of three sections: a left, right and middle section. The right and left
sections house an array of flat mirrors that track the sun’s path and a large redirecting parabolic mirror. The two mirror arrays are controlled using a time clock-based
controller, which actuates an electric motor that drives the mirror arrays to track the sun movement in the sky. The vertical spacing between the mirrors is set such that the self-shading effect of mirrors is optimized for most sun positions. The sunlight beam incident on the mirror arrays is redirected horizontally to the large parabolic mirrors. The latter redirect and concentrate the collected sunlight onto two small parabolic mirrors located in the middle section of the enclosure. The small parabolic mirrors redirect the concentrated sunlight onto the entrance port of the light guide through an angular cone whose center is aligned with the guide’s center and its half angle is optimized to transport light deep into the guide far end. For optimum
operation, the cone half angle should not exceed the acceptance angle of the guide ceiling diffuser, which is about 27.6° off the guide axis (3M, 2000a). The cone half angle in the vertical direction of previous CSS prototypes was estimated to be 20° (Mossman, 2009). Figure 2 shows a schematic description of the CSS and its optical components.
The light guide system is a hollow rectangular tube, whose front surface is fitted with a double anti-reflective glass window, and its end surface is fitted with an opaque mirror. The top, side and end inner surfaces of the guide are fitted with a highly reflective (visible reflectance > 98%) multi-layer optical film. The bottom surface is fitted with a prismatic polycarbonate thin film commercially known as Optical Lighting Film (OLF). The OLF (3M, 2000) reflects light by total internal reflection if the
incident rays are within its acceptance angle, which depends on the index of refraction of the polycarbonate material. Any rays incident onto the OLF out of the
acceptance cone will be partially transmitted through the film to the indoor space. The top inner surface of the guide includes a light extraction layer with variable width to control the amount of the transmitted lighting flux along the guide length. The extractor is made up of a thin diffuse film with a visible reflectance of 94% (3M, 2000b) to scatter incident light so that it can be transmitted through OLF.
The electrical system component includes tubular fluorescent electric lamps (usually T5), mounted at the top inner surface of the guide along its length. The lamps are driven by dimmable electronic ballasts and can be independently and automatically controlled based on the outdoor availability of sunlight. The lamps are controlled to supplement sunlight to maintain a given illuminance level on the work plan.
Table 1 summarises the characteristics of the simulated CSS and its optical and thermal performance indices.
DESCRIPTION OF THE TYPICAL OFFICE SPACE
The office space characteristics used in this study are based on those determined to be “typical” in a previous study (Reinhart, 2002). The geometry consists of an open-plan office space of an intermediate building floor with a depth of four cubicles to match the standard length of the CSS light guide. Windows on the south-facing facades are used to supply daylight to the perimeter work spaces. Two types of windows are used according to the prevailing climate at the building site. For cold climates requiring heating and cooling, a double glass window with
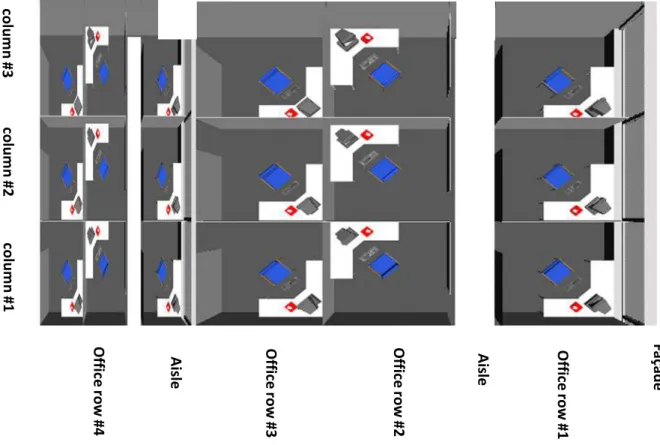
spectrally-selective low-e coating is used with the following characteristics: Light Transmittance (LT) = 70%, Solar Heat Gain Coefficient (SHGC) = 50%, and U-Factor = 1.35 W/m2K. For hot climates requiring cooling only, a double glass window with absorptive low-e coating is used with the following characteristics: LT = 35%, SHGC = 20% and U-Factor = 1.45 W/m2K. Figure 3 shows typical cubicle layouts in an office space. The dimensions and material characteristics of the office space are taken from Reinhart (2002), and summarized in Table 2.
The office space is assumed occupied from 8AM to 5PM during weekdays only. The indoor temperature set points are fixed at 21ºC for heating and 24ºC for cooling irrespective of the building occupancy schedule.
SIMULATION METHODOLOGY
The simulation approach used a combination of several simulation programs to compute the annual lighting, heating and cooling energy use of the CSS in office spaces. Figure 4 shows the flow of the input and output data for each simulation program. Details on the simulation methodology follow.
ASSUMPTIONS
• The lighting fixtures serving each cubicle space are controlled to supplement daylight using illuminance sensors placed on the desktop surface;
• The lighting conditions in each cubicle space are influenced only by the fixtures of the cubicle under consideration and its closest neighbouring cubicles;
• Daylight through the perimeter windows extends only to the three nearest cubicle spaces (Reinhart, 2002);
• Occupant behaviour and glare-based lighting controls are not taken into account. • The simulation time step is fixed at one hour to reduce excessive calculation time,
and comply with the limitations of some of the coupled simulation programs in generating the sub-hourly sky conditions from standard hourly weather files. Sub-hourly fluctuations in the sky conditions, particularly for partly-cloudy skies, are therefore not accounted for.
LIGHTING SIMULATION APPROACH
This model geometry of Figure 3 was implemented in the Ecotect software tool (AutoDesk, 2010) to facilitate the quick settings of the model inputs such as the geometry dimensions, and the characteristics of the interior surfaces and electrical lighting system. The Ecotect model was then exported and properly edited to conduct a detailed lighting simulation using Radiance. The CSS light guide is simulated as a series of discrete 0.6m x 1.2m (2 ft x 4 ft) sections mimicking the dimensions of the integrated lighting fixtures. Each cubicle space is served with three lighting fixtures with a typical intensity distribution of a linear electric fluorescent source with prismatic ceiling diffuser. Because of the geometrical symmetry of the space, only three columns of cubicles are used for the lighting simulation, with the results collected only for the central cubicle column. Figure 5 shows a screenshot of the as-simulated model.
The illuminance distribution on the desktop surfaces of each cubicle space is composed of three components: (1) the daylight contribution through the perimeter windows, (2) the daylight contribution through the CSS, and (3) the artificial lighting contribution of the fixtures integrated in the light guide of the CSS. Given the
complex geometry of the CSS, the direct use of ray-tracing software to calculate the desktop illuminances for every hour in a year based on the outdoor daylight
conditions is not practical due to the prohibitive calculation time. In this study, various approaches are used to reduce the simulation time.
For the daylight contribution through the perimeter windows, the concept of the daylighting coefficient (Tregenza and Waters, 1983) is used to calculate the illuminance at given points on the desktop surfaces. The DaySim software (NRC, 2009) is used to compute the daylighting coefficient sets and the hourly desktop illuminances using the weather file data at the building site.
For the daylight contribution through the CSS, the approach is split into two parts. The recently developed optical model for the CSS (Laouadi, 2010), which was implemented in a new in-house version of SkyVision (NRC, 2010), is used to calculate the hourly daylight flux outputs along the light guide length using the weather file data at the building site under consideration. The optical model was validated using detailed ray-tracing techniques and field measurement (more details may be found in Laouadi, 2010). The validation results show that the model
predictions are in good agreement with the ray tracing and measurement results. The desktop illuminances are then calculated using coefficients relating the guide
luminous output fluxes to the desktop illuminances. These coefficients are pre-calculated using Radiance (Ward and Shakespeare, 1998) as explained in the
subsection below. The artificial light contribution is calculated using the same desktop illuminance coefficients. The electric luminous output fluxes to maintain the
recommended desktop illuminances are obtained by solving a matrix of equations as described below.
Desktop illuminance calculation
The Radiance tool is used to calculate the desktop illuminances. To approximate the shape of the two-dimensional light distribution (perpendicular to the guide axis) of both natural and artificial light from the guide, the photometric intensity distribution of a standard linear prismatic lighting fixture with two 32W T5 fluorescent bulbs was
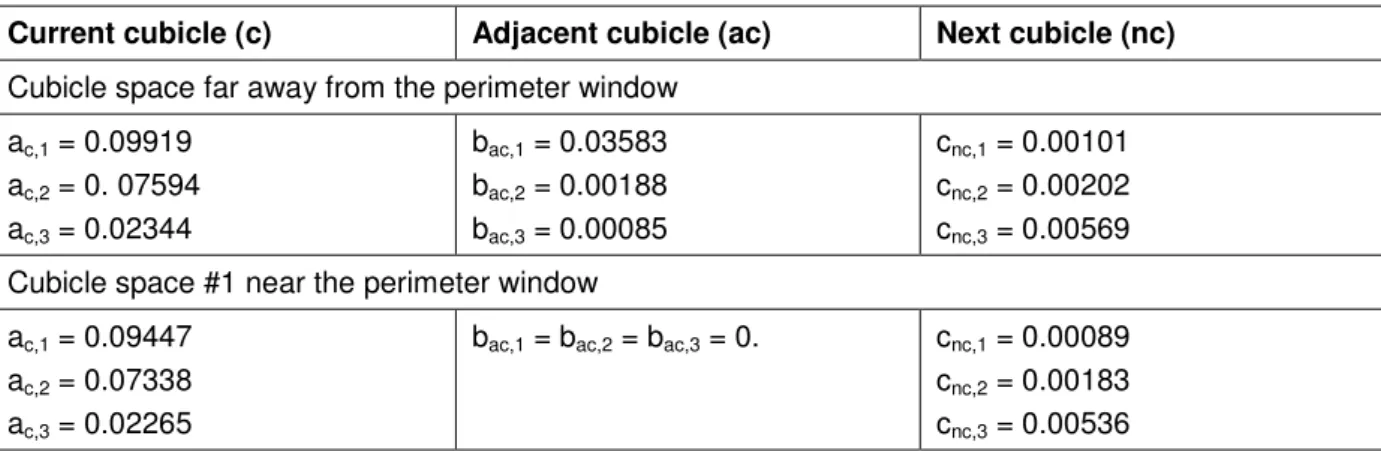
used in the simulation. Based on the superposition principle and a constant lighting intensity distribution profile, the desktop illuminance varies linearly with the luminous output fluxes from the guide sections. One row of the luminous fixtures (parallel to the window façade) is illuminated at a time to determine the ratios between the flux from each row fixture and the average illuminance at the desktop surface of a cubicle. Figure 6 shows the Radiance rendering of the office space when only one lighting fixture of each cubicle of the fourth row is illuminated (fixture #1 of all column cubicles #4 of Figure 7). The coefficients in equation (1) are generated for cubicle spaces immediate to and far away from the perimeter window. Table 3 summarises the calculated values of the coefficients (a, b, c). It should be noted that those
coefficients include the effect of other neighbouring column cubicles of the same row. The illuminance values (Ec, or Ec,win) in equation (1) are calculated at three points on the desktop surface (left, right, and middle) and then averaged out.
Figure 7 shows a schematic layout of a column of cubicles running from the window wall to the core space. The average desktop illuminance of a given cubicle space (with index c) is expressed as follows:
(
)
(
)
(
)
{
}
∑
= + ⋅ + + ⋅ + + ⋅ + ⋅ = 3 1 i i nc i nc i nc i ac i ac i ac i c i c i c win c c GF E a FE FG b FE FG c FE FG E , , , , , , , , , , (1) Where:ac,i : coefficient due to the illuminance contribution from the lighting fixture of index (i) of the cubicle under consideration (lx/lumens);
bac,i : coefficient due to the illuminance contribution from the lighting fixture of index (i) of the adjacent cubicle (see Figure 7) (lx/lumens);
cnc,i : coefficient due to the illuminance contribution from the lighting fixture of index (i) of the next neighbouring cubicle (see Figure 7) (lx/lumens);
GF : glazing factor equal to the ratio of the luminous transmittance of the actual window to the luminous transmittance of a reference window used to calculate the daylighting coefficient set;
Ec : desktop average illuminance of the cubicle under consideration (lx); Ec,win : desktop average illuminance of the cubicle under consideration due to
daylight contribution through the perimeter window (lx);
FEc,i : luminous flux of fixture (i) serving the cubicle space under consideration (lumens);
FEac,i : luminous flux of fixture (i) serving the adjacent cubicle space (lumens); FEnc,i : luminous flux of fixture (i) serving the next neighbouring cubicle space
(lumens);
FGc,i daylight luminous flux of the guide section housing the fixture of index (i) of the cubicle space under consideration (lumens);
FGac,i : daylight luminous flux of the guide section housing the fixture of index (i) of the adjacent cubicle space (lumens);
FGnc,i : daylight luminous flux of the guide section housing the fixture of index (i) of the next neighbouring cubicle space (lumens).
Equations (1) for a given column of (N) cubicle spaces form a linear system of equations with the electric luminous fluxes (FE) as unknown variables. The electric lighting is controlled to complement daylighting from the perimeter windows and the CSS. In an office space setting, the recommended desktop illuminance is set to Ec = 500 lx (IESNA, 2000). The corresponding electric luminous fluxes are obtained by solving the linear system of equations (1) using a suitable method such as the matrix inversion technique.
Lighting power and energy use
The lighting power consumed by a lighting fixture of given cubicle space is obtained from the calculated electric luminous flux as follows:
η ⋅ + = TL FE PFB PFci ci c,i , , (2) Where:
PFc,i : electric power consumed by the lighting fixture of index (i) of the cubicle space under consideration (W).
PFBc,i : electric power consumed by the ballast of the lighting fixture of index (i) of the cubicle space under consideration (W).
TL : transmission loss factor of the fixture flux through the ceiling diffuser.
η : luminous efficacy of the lighting fixture (not including the ballast) (lumen/W). The total electric power (Ps) consumed by a column of cubicle spaces (N) is the sum of the powers consumed by the cubical fixtures.
∑∑
= = = N c i i c s PF P 1 3 1 , (3)The annual lighting energy use of the office space is obtained by integrating the power delivered to the cubicle spaces during the occupancy hours of each working day of the year.
THERMAL SIMULATION APPROACH
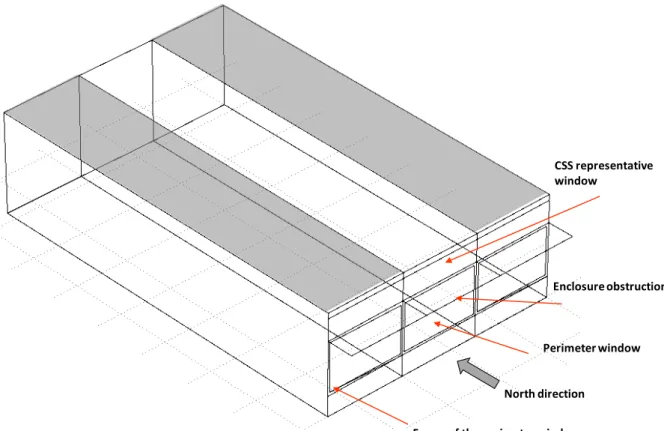
ESP-r (ESRU, 2008) is used to calculate the thermal conditions in the office spaces, and the annual heating and cooling energy use. The thermal simulation model uses one thermal zone consisting of an internal column of cubicles. The thermal zone is bounded by an external south-facing wall, and internal surfaces (side and back walls, floor, and roof) facing similar environment conditions. Typical office constructions are assigned to the zone surfaces (whose U-factors are listed in Table 2). The CSS is simulated as a triple glazed window system, whose glazing panes stand for the exterior enclosure, mirrors, and light guide. The surface area of the simulated
window is set equal to the mirror collection surface area of the CSS, which is 2.4 m2. Details on how to compute the collection surface area of the CSS is found in Laouadi (2010). The new in-house version of SkyVision is used to generate the required optical and thermal input data for ESP-r to run a simulation, such as the solar transmittance and layer absorptances at five incidence angles, and thermal
resistances of the cavity air spaces. Table 4 provides details on the solar optical and thermal input data required for the ESP-r simulation. Figure 8 shows the thermal zone as simulated.
The internal heat gains of the space during the occupancy hours on weekdays (weekends are not occupied) are as follows (ASHRAE, 2009): computers (95 W), occupants (75 W sensible and 55 W latent per cubicle, or occupant). The electric lighting heat gains are calculated using equation (3) to maintain the recommended desktop average illuminance of 500 lx.
BASE CASE BUILDING
The energy performance of the design building equipped with the CSS is compared with that of a base case (reference) building without the CSS. Since the CSS is used to provide daylight to core spaces, which require constant artificial lighting, the
lighting system of the base case building is not controlled and is always switched on during the occupancy hours on weekdays. The corresponding lighting power to maintain a desktop average illuminance of 500 lux (calculated using equation (3)) is
found to be 105 W per cubicle. The remaining characteristics of the base case building such as construction details, internal heat gains not related to the electrical lighting, and indoor temperature controls are kept identical to the design building with the CSS.
RESULTS AND DISCUSSION
The energy performance of the CSS was calculated at eight building sites: Winnipeg, MB ), Vancouver, BC, Ottawa, ON, Chicago, IL, New York City, Sacramento, CA, Los Angeles, CA, and Phoenix, AZ. Table 5 summarises the annual bright sunshines hours, and the summer/winter daily maximum CSS operating hours for south-facing building applications. More details on the monthly averages of sunshine hours in those cities may be found in Wikipedia (2010). These cities were selected to
represent sunny areas in North America for possible future field CSS demonstrations. The Los Angeles and Phoenix simulations use the second window type described in the fourth section (LT = 35%, SHGC = 20%), and all the rest use the first window type (LT = 70%, SHGC = 50%). The following results are obtained.
LIGHTING ENERGY USE
Figures 9 and 10 show the lighting energy use per floor surface area for an office space with a depth of four cubicles (guide length = 14.4 m) and six cubicles (guide length = 21.6 m), respectively. The use of CSS in buildings may save a significant amount of the lighting energy.
The lighting energy savings followed the profile of the annual sunshine hours in the northern Canadian and the southern USA cities. For the Canadian cities, the lighting energy savings of the office spaces with a depth of four cubicles varied from 44% (Vancouver) to 51% (Winnipeg) when the indoor lighting is controlled based on daylight from the perimeter windows (without blinds) and the CSS. The lighting energy savings in the case with the CSS only (with the absence of the perimeter windows) ranged from 31% to 40%. For the office spaces with a depth of six
cubicles, the lighting energy savings are lower because the space is deeper, but uses the same luminous flux of the CSS’s light guide. The lighting energy savings range from 33% to 40% when both the perimeter windows and CSS are accounted for, and from 24% to 31% when the CSS is used in the absence of windows.
For the USA cities under cold or hot climates, the lighting energy savings from both the perimeter windows and CSS varied from 48% (Chicago) to 58% (Phoenix) for office spaces with a depth of four cubicles, and from 36% to 45% for office spaces with a depth of six cubicles. The lighting energy savings from the CSS only (in the absence of windows) varied from 35% to 48% for the four cubicle spaces, and from 26% to 39% for the six cubicle spaces.
It should be noted the obtained lighting energy savings are for a CSS which was optimized for operation under the climate conditions of British Columbia (Canada) where it is being demonstrated in the field. For the southern latitudes of USA, the lighting energy savings would be even higher if the CSS is optimized for those locations. As a matter of fact, the lighting energy savings of the CSS depend on many factors such as the CSS light transmittance at the building site, the annual bright sunshine hours (number of hours in a year where the sunbeam light is
present), and the daily maximum CSS operating hours (which correspond to the sun up in the sky and in the south-east or west quadrant for south facing building
applications). The higher the CSS light transmittance and annual sunshine hours within the daily CSS operating hours, the higher the lighting energy savings. The selected cities presented a mixture of high and low values of such parameters. For example, the lighting energy savings in Winnipeg (with high sunshine hours, and longest summer and shortest winter daily operating hours) are higher than those in the USA cities of Chicago and New York (with slightly higher annual sunshine hours, but lower transmittance and shorter summer and longer winter daily operating hours). Furthermore, the lighting energy savings in Winnipeg are slightly lower than those of the USA southern cities (Sacramento, Los Angeles, and Phoenix) despite their high sunshines hours. This is due to the fact the CSS light transmittance and daily operating hours in the USA southern cities are significantly lower than those in Winnipeg, particularly in summer days (see Table 5).
For comparison with office spaces with perimeter windows only, the same model was used to calculate the lighting energy savings in the selected cities using the same daylighting control (considering the ideal case without blinds or glare control). The lighting energy savings were found to range from 23% (Vancouver) to 26%
(Sacramento) for the four cubicle spaces, and from 15% to 17% for the six cubicle spaces. These results are comparable to those found in the literature. For example,
the lighting energy savings in the study by Reinhart (2002) for the New York City, with similar geometries and roughly similar parameter values as those used in this study (except that Reinhart used an occupancy schedule from 8 AM to 6 PM), show approximately 30% savings for a four-cubicle deep office space when the blinds are always open (drawn up). It should be noted that the actual savings from perimeter window daylighting are usually significantly lower than these values because of blind usage and glare control. The study by Reinhart (2002) suggests approximately 21% savings with automated blinds, 18% savings with manual blinds, and 12% savings with venetian blinds always closed at 45o to avoid any potential disability glare due to direct sunbeam light reaching occupant’s eyes or desktop computer screens. This decrease in lighting energy savings because of disability glare does not apply to the CSS since the latter diffuses sunbeam light along the depth of the office spaces (note that discomfort glare due to excessive light source luminances may apply to both perimeter windows and CSS).
THERMAL ENERGY USE
Figures 11 to 13 show the heating, cooling and total energy use per floor surface area of office spaces with a depth of four cubicles, respectively. The combination of the perimeter windows and the CSS to reduce the lighting energy use resulted in slightly higher heating energy use, but significantly lower energy use for cooling, and total energy. This is due to the fact the heat gains from the electric lighting are lower for the design building with windows and CSS than for a reference building without a CSS and no control for the indoor lighting. Furthermore, the exterior enclosure of the CSS acted as a shading obstruction to the perimeter windows, particularly at
relatively medium to high sun altitude angles, resulting in lower solar gains to the space through the perimeter window. For the Canadian cities, the increase in the heating energy use is about 3% as compared with the reference building. The energy savings for cooling are about 8%. Overall, the total energy savings varied from 14% (Winnipeg) to 19% (Vancouver). A similar trend is found for the USA cities under cold and hot climates. The increase in the heating energy use is about 4%. The energy savings for cooling are about 7%, and that for the total energy vary from 16% to 23%.
CONCLUSIONS
This paper presented a simulation study to predict the energy performance of the CSS installed in typical open plan office spaces with south facing perimeter windows in the selected North American climates. A computationally efficient methodology was developed to conduct the annual simulations, in which several simulation tools are combined. Ecotect tools was used to quickly generate the geometry of the office space, and then exported and properly edited to conduct the lighting simulation using Radiance and DaySim tools. The lighting simulation of the CSS is divided into two parts: SkyVision algorithms derived from ray-tracing techniques (which were
previously validated using measurement and computer simulations) were used to calculate the daylight luminous flux exiting the bottom of the guide as a function of the sunbeam luminous flux incident on the façade. A set of coefficients
pre-calculated using Radiance related the desktop illuminances to the luminous output fluxes along the length of the CSS’s guide. The daylighting coefficient method was used, through the DaySim tool with the same Radiance model, to compute the daylight illuminance on the desktop surface from the perimeter windows. The ESP-r tool was used to compute the annual heating and cooling energy use of the office spaces. SkyVision generated the hourly electric lighting heat gains to the space, and the necessary optical and thermal input data for ESP-r simulations. It should be noted that the coupling of those software tools is not an easy task. It required expert users who know the strengths and limitations of each software tool.
The results showed that the CSS may save a significant amount of energy for lighting, cooling and total (lighting, heating and cooling) energy under cold or hot climates in North American cities. The CSS resulted, however, in slightly higher energy use for heating due to a reduction in the lighting heat gains to the space. The combination of perimeter windows and the CSS, with a standard length guide to accommodate an office space with a depth of four cubicles, may result in lighting energy savings ranging from 44% to 57% as compared with a reference building without lighting controls. In the case of the CSS alone (in the absence of windows), the lighting energy savings were found to be about 33% to 45%, depending on the building site location and prevailing climate. The savings in the lighting energy use resulted in reduced cooling energy use, which were about 8%. The total energy use for lighting, heating and cooling was, consequently, reduced from 14% to 23%.
FUTURE WORK
The relative energy benefits of the CSS as compared with perimeter windows in office spaces without the CSS depend on many factors, among which the types of lighting control strategies. Future work should consider office spaces with the following:
• Perimeter windows incorporating motorized or manually-controlled shading devices.
• Combinations of glare, occupancy and illuminance-based lighting controls in the perimeter offices, and occupancy-based lighting controls in the core spaces.
ACKNOWLDGEMENTS
This work was funded by the Institute for Research in Construction of the National Research Council Canada (NRC-IRC), and the Panel on Energy Research and Development (PERD) administered by Natural Resources Canada. The authors are very thankful for their contribution. The authors would also like to thank Dr. Lorne Whitehead and Dr. Michele Mossman from the University of British Columbia (Canada) for providing detailed information on the construction and function of the CSS.
REFERENCES
3M. 2000a. 2301 Optical Lighting Film. Technical Specification. Minnesota: 3M. 3M. 2000b. Light Enhancement Film 3635-100. Product Bulletin. Minnesota: 3M. Aizenberg, J. B. 2010. Outcome of research, developments, production and
application of extended hollow light guides (1964-2009). Proceedings of the CIE 2010“Lighting Quality and Energy Efficiency”; Vienna, Austria. 332-335.
ASHRAE. 2009. Handbook of fundamentals. American Society of Heating, Refrigerating, and Air-conditioning Engineers. Atlanta.
AutoDesk. 2010. URL: http://usa.autodesk.com/ [Accessed January, 2010]. Callow, J. M., Shao, L., 2003. Air-clad optical rod daylighting system. Lighting Reseach and Technology; 35: 31-38.
ESRU. 2008. ESP-r version 11.3 Energy Systems Research Unit. University of Strathclyde. Glasgow. URL: http://www.esru.strath.ac.uk/
Greenup, P. J., Edmonds. I. A. 2004. Test room measurements and computer
simulations of the micro-light guiding shade daylight redirecting device. Solar Energy; 76: 99-109.
Hien, V.D., and Chirarattananon S. 2009. An experimntal study of a façade mounted light pipe. Lighting Research and Technology; 41: 123-142.IESNA. 2000. Lighting Handbook. Reference and Application Volume. New york: Illuminating Engineering Society of North America.
IESNA. 2000. Lighting Handbook, Reference And Application Volume. New York: Illuminating Engineering Society of North America.
Kim, J.T., and Kim G. 2010. Overview and new developments in optical daylighting systems for building a healthy environment. Building and Environment; 45: 256-269. Kwok, C.M., and Chung T.M. 2008. Computer simulation study of a horizontal light pipe integrated with laser cut panels in a dense urban environment. Lighting
Research and Technology; 40: 287-305.
Laouadi A. 2010. The Central Sunlighting System: Development and Validation of an Optical Prediction Model. Journal of Building Performance Simulation; in-press. Mossman M. 2009. Private communication.
NRC. 2009. DaySim. National Research Council of Canada: www.daysim.com. NRC. 2010. SkyVision v1.2.1 National Research Council of Canada. Availaable for free download from : http://irc.nrc-cnrc.gc.ca/ie/light/skyvision/ [Accessed January 2010].
NRCan, 2010. National Energy Use Database. Office of Energy Efficiency. URL:
http://oee.nrcan-rncan.gc.ca/corporate/statistics/neud/dpa/comprehensive_tables/.
Reinhart, C.F. 2002. Effects of office design on the annual daylight availability – a simulation study. Conference Proceedings of the ACEEE Summer Study on Energy Efficient Buildings, Pacific Grove, California, USA; 1-12.
Rosemann A. and Kaase H. 2005. Lightpipe applications for daylighting systems. Solar Energy; 78(6): 772-780.
Rosemann A., Mossman M., Whitehead L. 2008. Development of a cost effective solar illumination system to bring natural light into the building core. Solar Energy; 82: 302-310.
Rosemann A., Cox G., Upward A., Friedel P., Mossman M., Whitehead L. 2007. Efficient Dual-Function Solar/Electric Light Guide to Enable Cost-Effective Core Daylighting. LEUKOS; 3(4): 265-269.
Schlegel, G. O., Burkholder, F. W., Klein, S. A., Beckman W. A., Wood, B. D., Muhs, J. D. 2004. Analysis of a full spectrum hybrid lighting system. Solar Energy; 76: 359– 368.
Tsangrassoulis, A., Doulos, L., Santamouris, M., Fontoynont, M., Maamari, F., Wilson, M., Jacobs, A., Solomon, J., Zimmermann, A., Pohl, W., Mihalakakou, G. 2005. On the energy efficiency of a prototype hybrid daylighting system. Solar Energy; 79: 56–64.
Tregenza P.R. and Waters I.M. 1983. “Daylight Coefficient”. LR&T. 15(2), 65-71. Ward G, Shakespeare R. 1998. “Rendering with RADIANCE. The Art and Science of Lighting Visualization.” Morgan Kaufmann Publishers. San Francisco, California. Whitehead L. 2009. Solar Canopy Demonstration Project – BCIT Phase I. Internal Report. University of British Columbia, BC, Canada.
Whitehead, L., Upward A., Friedel P., Rosemann A., Mossman, M. 2007, A Cost-effective approach to core daylighting. Proceedings of the 2nd Canadian Solar Buildings Conference, Calgary; 1-5.
Wikipedia. 2010. URL: http://irc.nrc-cnrc.gc.ca/ie/light/skyvision/ [Accessed November, 2010].
Table 1 Physical characteristics of the simulated CSS and its calculated performance indices (Laouadi, 2010). Note that the LI, LT, ST and SHGC are calculated when the sun is due south at an altitude angle of 45º. LI is the ratio of the average luminance exiting the guide to the sky zenith luminance. The U-factor is the ratio of heat losses per unit surface area to the temperature differential between the outdoor environment at -18ºC and the indoor
enironment at 21ºC. The SHGC is the ratio of the total solar heat gains to the indoor space to the solar radiation flux incident on the CSS
Physical characteristics Performance indices
Enclosure front cover sheet: 6 mm clear plexiglass Enclosure depth = 1 m
Number of flat mirrors = 84
Mirror width x depth x spacing = 17 cm x 19 cm x 16.8 cm Visible (solar) reflectance of mirrors = 98% (65%).
Visible/solar reflectance of light guide = 98%. Visible/solar reflectance of extractor film = 94% Guide OLF diffuser: 0.5 mm prismatic acrylic sheet Guide front opening window: 6mm double anti-reflective glass with 12.7 mm air space.
Guide cross-section wdth x height = 0.2 m x 0.6 m Guide length = 14.4 m
Lighting fixture: two 28 W T5 fluorescent bulbs. Average rated lamp lumen = 2750 lm (η = 98%)
Fixture ballast consumption: 8 W.
Diffuser transmission loss factor TL = 85%
Luminance Index, LI = 14% (under clear sky conditions)
Light Transmittance, LT = 25% Solar Transmittance, ST = 5% Solar Heat Gain Coefficient, SHGC = 12%
U-factor = 0.1 W/m2K, based on an exchange surface area of 2.4 m2
Table 2 Dimensions and material reflectances of the indoor space and cubicles
Cubicle length (equal width ) 3.0 m (120”)
Partition height 1.63 m (64”)
Aisle width 1.2 m (48”)
Ceiling height 2.70 m (108”)
Ceiling plenum height 1 m (39.4’’)
Desk length x width x height 1.83 m x 0.91 m x 0.91 m (72” x 36” x 36”)
Computer width (cube) 0.46 m (18”)
Partition door width 0.91 m (36”)
Window rough opening width x height 3.0 m x 1.95 m (120’’ x 78.5”)
Window sill height 0.75 m (29.5”)
Window frame width (top and bottom) 0.10 m (3.9”)
Window frame width (sides) 0.08 m (3.1”)
Reflectance of ceiling, floor and walls 70%, 20%, 50%
Reflectance of partitions and desk 50%
U-factor of exterior walls 0.36 W/m2K
U-factor of perimeter window frames (ASHRAE, 2009)
9.26 W/m2K
Air infiltration rate (ASHRAE, 2009) 0.35 ACH
Table 3 Calculated values of the coefficients (a, b, c). Cubicle fixtures are numbered in increasing order starting from the shared partition (see Figure 7)
Current cubicle (c) Adjacent cubicle (ac) Next cubicle (nc)
Cubicle space far away from the perimeter window ac,1 = 0.09919 ac,2 = 0. 07594 ac,3 = 0.02344 bac,1 = 0.03583 bac,2 = 0.00188 bac,3 = 0.00085 cnc,1 = 0.00101 cnc,2 = 0.00202 cnc,3 = 0.00569 Cubicle space #1 near the perimeter window
ac,1 = 0.09447 ac,2 = 0.07338 ac,3 = 0.02265
bac,1 = bac,2 = bac,3 = 0. cnc,1 = 0.00089 cnc,2 = 0.00183 cnc,3 = 0.00536
Table 4 Solar optical and thermal input data of the simulated CSS as generated by SkyVision for ESP-r. The thermal resistances of the two air spaces are 0.23 m2K/W and 9.6 m2K/W Incidence angle 0º 40º 55º 70º 80º Transmittance 0% 4.4% 7.4% 6.6% 4% Absorptance of exterior cover 15.4% 16.7% 17.6% 18% 17% Absorptance of all mirrors 0% 26% 45% 40% 24% Absorptance of guide and its front window
0% 5% 7% 7.3% 4.3%
Table 5 Annual bright sunshine hours (data taken from Wikipedia, 2010), and daily maximum CSS operating hours for the summer and winter solstices. The daily maximum CSS operating hours are defined as the number of hours in a day where the sun is up in the sky and in the south-east or west quadrant for south facing CSS applications.
City Bright sunshine hours Maximum CSS operating hours (June, 21) Maximum CSS operating hours (December, 21) Winnipeg (latitude = 49.9ºN) 2377 9.00 7.67 Vancouver (49.18ºN) 1928 8.83 7.67 Ottawa (45.32ºN) 2060 8.50 8.33 Chicago (42ºN) 2512 8.00 8.66 New York (40.65ºN) 2540 7.83 8.83 Sacramento (38.67ºN) 3614 7.50 9.16 Los Angeles (33.93ºN) 3265 6.50 9.66 Phoenix (33.43ºN) 3876 6.33 9.50
Figure 1. The exterior enclosure (left picture) and the light guide as seen from indoors (right picture) of a previous CSS prototype
Figure 2 Schematic descriptions of the CSS and its components.
Small parabolic mirrors
Large parabolic mirror Flat mirrors Entrance of guide Canopy box Multilayer optical film Extractor Fluorescent lamp Optical Lighting Film Cross-section of guide Flat mirror arrays
Side view of the canopy system
Plan view of the canopy system
Figure 3. Schematic description of an open plan office space with a depth of four cubicles co lum n # 1 co lum n # 2 co lum n # 3 O ffi ce ro w #1 O ffi ce row #2 O ffi ce row #3 O ffi ce row #4 A is le A is le Faç ad e
Figure 4. Flow of the input and output data for each simulation program
Figure 5 Screenshot of the lighting simulation model of the open-plan office space with three columns and six rows of cubicles (the geometry was generated by the Autodesk Ecotect software).
Ecotect
Geometry preparation
Radiance
Calculation of coefficient (a, b, c) (Table 3)
DaySim
Calculation of desktop illuminance from perimeter windows using the daylight coefficient method
SkyVision
Calculation of hourly lighting power (equation 3), annual lighting energy use, and hourly lighting heat gains for ESP-r . Generation of the optical and thermal inputs for ESP-r (Table 4)
ESP-r
Calculation of the annual heating and cooling energy use.
Figure 6 Radiance’s rendering of the office space when only one lighting fixture of each of the fourth row cubicles is illuminated.
Figure 7. General numbering convention of cubicles and lighting fixtures in a series of a cubicle column 1 2 4 3 5 7 8 6 ais le window Lighting fixtures Light guide Next cubicle Current cubicle Adjacent cubicle
3 2 1 1 2 3 4 5 6
Figure 8 Thermal model of the office cubicle space (central zone). The horizontal plate above the perimeter window simulates the obstruction as caused by the exterior enclosure of the CSS. The CSS is simulated as a window above the obstruction plate. North direction Perimeter window CSS representative window Enclosure obstruction
Figure 9 Lighting energy use for an office space with a depth of four cubicles (guide length = 14.4 m) 0 5 10 15 20 25
Reference Winnipeg Vancouver Ottawa Chicago New York Sacramento Los Angeles Phoenix
Li g ht ing E ne rg y U se ( K W h/ m 2 )
Figure 10 Lighting energy use for an office space with a depth of six cubicles (guide length = 21.6 m) 0 5 10 15 20 25
Reference Winnipeg Vancouver Ottawa Chicago New York Sacramento Los Angeles Phoenix
Li g ht ing E ne rg y U se ( K W h/ m 2 )
Figure 11 Heating energy use for an office space with a depth of four cubicles -5 10 15 20 25 30 35 40
Winnipeg Vancouver Ottawa Chicago New York Sacramento Los Angeles Phoenix
H e a ti ng E ne rg y U se ( K W h/ m 2)
Reference (no daylighting control)
Figure 12 Cooling energy use for an office space with a depth of four cubicles -10 20 30 40 50 60 70 80 90 100
Winnipeg Vancouver Ottawa Chicago New York Sacramento Los Angeles Phoenix
C ool in g E n e rg y U se ( K W h /m 2)
Reference (no daylighting control)
Figure 13 Total (lighting, heating, and cooling) energy use for an office space with a depth of four cubicles
-20 40 60 80 100 120
Winnipeg Vancouver Ottawa Chicago New York Sacramento Los Angeles Phoenix
To ta l E n e rg y U se ( K W h /m 2)
Reference (no daylighting control)