HAL Id: hal-00716121
https://hal-enpc.archives-ouvertes.fr/hal-00716121
Submitted on 3 Nov 2016HAL is a multi-disciplinary open access
archive for the deposit and dissemination of sci-entific research documents, whether they are pub-lished or not. The documents may come from teaching and research institutions in France or abroad, or from public or private research centers.
L’archive ouverte pluridisciplinaire HAL, est destinée au dépôt et à la diffusion de documents scientifiques de niveau recherche, publiés ou non, émanant des établissements d’enseignement et de recherche français ou étrangers, des laboratoires publics ou privés.
Distributed under a Creative Commons Attribution| 4.0 International License
Trade-offs and synergies in urban climate policies
Vincent Viguie, Stéphane Hallegatte
To cite this version:
Vincent Viguie, Stéphane Hallegatte. Trade-offs and synergies in urban climate policies. Nature Climate Change, Nature Publishing Group, 2012, 2 (5), pp.334-337. �10.1038/NCLIMATE1434�. �hal-00716121�
1
Trade-Offs and Synergies in Urban Climate Policies
Vincent Viguié1,*and Stéphane Hallegatte2,3
Cities are at the forefront of climate policies.1-6 However, urban climate policies are not implemented in a vacuum; they interact with other policy goals, such as economic competitiveness or social issues. These interactions can lead to trade-offs and implementation obstacles, or to synergies.7,8 Little analysis investigating these interactions exists, in part because it requires a broad interdisciplinary approach. Using a novel integrated city model, we provide a first quantification of these trade-offs and synergies, going beyond the qualitative statements that have been published so far. We undertake a multicriteria analysis of three urban policies: a greenbelt policy, a zoning policy to reduce flood risk, and a transportation subsidy. Each of these policies appears to be undesirable because it has negative consequences with respect to at least one policy goal; however, in a policy mix, the consequences of each policy are not simply additive. This nonlinearity permits building policy combinations that are win-win strategies. In particular, flood zoning and greenbelt policies are unlikely to be accepted if they are not combined with transportation policies. Our results show that stand-alone adaptation and mitigation policies are unlikely to be politically acceptable and emphasize the need to mainstream climate policy within urban planning.
Urban policies have multiple goals, such as enhancing the quality of life and the city’s economic competitiveness by means of affordable housing and office space, amenities, and efficient public services. Urban policies also have social objectives aimed at poverty and social segregation issues, safety and security, and public health. They have environmental goals as well, such as reducing air and water pollution and preserving natural areas. In addition to this long list of goals, urban policies now face new challenges from climate change, including adaptation and mitigation needs.1–6
Adaptation and emission reduction policies rely on the same tools, giving rise to both synergies and conflicts.7,8 Synergies and conflicts with other policy goals also exist, and environmental policies can result in positive feedback with respect to economic and social issues. A decrease in car congestion increases residents’ quality of life, enhances economic competitiveness, reduces accessibility inequalities among neighborhoods, and decreases air pollution and GHG emissions. Conversely, while enlarging parks and introducing more vegetation in cities can be a useful way to adapt cities to higher temperatures and can improve the quality of life, such actions may also reduce population density and lead to increased GHG
1
Centre International de Recherche sur l'environnement et le Développement, Paris, Site du jardin tropical, 45bis, Avenue de la Belle Gabrielle, F-94736 Nogent-sur-Marne, France.
2
World Bank, 1818 H Street, NW, Washington, DC 20433, United States.
3
Ecole Nationale de la Météorologie, 42, avenue Gaspard Coriolis, F-31057 Toulouse Cedex 1, France. * To whom correspondence should be addressed; E-mail: [email protected].
2
emissions from transportation. These effects can vary by community or location, for example, impact in the suburbs versus that in the city center, leading to unintended redistributions of wealth or amenities that may or may not be consistent with policy goals.
In this context, a pertinent tool is integrated city models (ICMs).9 ICMs are highly simplified representations of reality that describe the most important drivers of city change over time and can assess the consequences of various policy choices. ICMs are not supposed to forecast the future of a city, but they can provide decision makers and stakeholders with useful information and can help them understand the main mechanisms and linkages at work. We utilize a multicriteria analysis to capture the synergies and trade-offs with respect to urban climate policies aimed at mitigation and adaptation using a simple ICM, NEDUM-2D (see Methods). Our analysis focuses on Paris, but its qualitative conclusions are generic and likely to be valid for many cities.
In this analysis, we assess urban policies with respect to five policy goals: climate change mitigation, climate change adaptation and disaster risk reduction, natural area and biodiversity protection, housing affordability, and policy neutrality. These goals can be translated into quantitative indicators in many ways. As an illustration, we suggest five possible and relevant ones that our ICM can measure and model. Indicator choice is a crucial issue that depends on the objectives for a given policy and on decision makers’ priorities. Moreover, for all practical purposes, indicators (and their weights in the decision process) should be chosen in collaboration with stakeholders and policy makers.10
The indicators we utilize do not encompass all possible policy impacts on the five policy goals, but are informative for the policies we will be considering (See Section 1 of Supplementary Information), and each can be directly measured:
• Climate change mitigation: Urban policies can influence GHG emissions resulting from transport, heating, and air conditioning. Here we focus on transportation emissions. Our proposed indicator, the average distance traveled by car for commuting, is a simple proxy for GHG emissions in the absence of comprehensive modeling of urban GHG emissions.
• Climate change adaptation and disaster risk reduction: In Paris, one of the main disaster risks is flooding, and climate change may increase this risk, even though models still disagree. We therefore use the population living in flood-prone areas as an indicator.
• Natural area and biodiversity protection: The transformation of natural areas into urbanized area has many environmental impacts, for example, on biodiversity and water and flood management. For this policy goal we use the total urbanized area as an indicator.
• Housing affordability: Access to housing plays an important role in the quality of life and the competitiveness of a city. Improving housing affordability can therefore be both a social and an economic objective. This is particularly crucial in most major cities and can be measured using either rents or average dwelling size. Here we use average dwelling size in the center of the urban area as an indicator.11
• Policy neutrality: Even if a policy has a positive impact as measured using aggregated indicators, it may have large unintended redistributive effects or particularly large negative effects on one category of residents or on one area of the city. Such redistributive effects often make implementation difficult or require corrective measures. To build a quantitative indicator for policy neutrality, we use the spatial distribution of returns on real estate investments in the
3
city and calculate the spatial Gini index of the profitability of real estate investments. A high value of this indicator means that the evolution of a city leads to large changes in relative land prices.
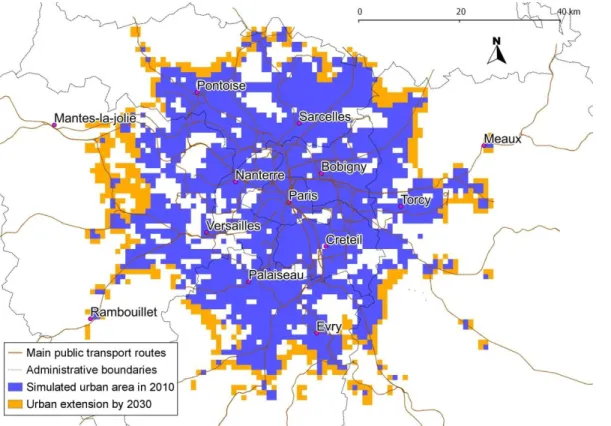
We consider three policies that aim at different targets, but have consequences on the aforementioned five goals: a greenbelt policy, a public transport subsidy, and a zoning policy to reduce the risk of flooding (see Section 3 of Supplementary Information). Using our NEDUM-2D model, we compare these policies to a do-nothing scenario, whereby urbanization is driven only by market forces and the external drivers: transport and energy costs, population, income etc. (see Section 4 of Supplementary Information). Figure 1 illustrates the do-nothing scenario. The model projects a significant extension of the urbanized area between 2010 and 2030 as a result of increased population and decreasing transportation costs relative to income.
4 Indicators Greenbelt Public transport subsidy Flood risk
zoning Policy mix
Do-nothing scenario
Change in average daily distance driven
in car (m) + 1,570 -440 + 2,550 -880 + 2,560 change in population in flood-prone
areas (thousands of households) +39,000 -4,000 -6,000 -8,000 + 6,000 Change in total urbanized area (km²) 0 + 690 + 470 0 + 480 Redistributive impacts (Gini index) + 0.093 + 0.271 + 0.201 + 0.146 + 0.203 Change in dwelling size in the center of
Paris (m²) + 0.17 + 1.73 + 0.79 + 0.95 + 0.82
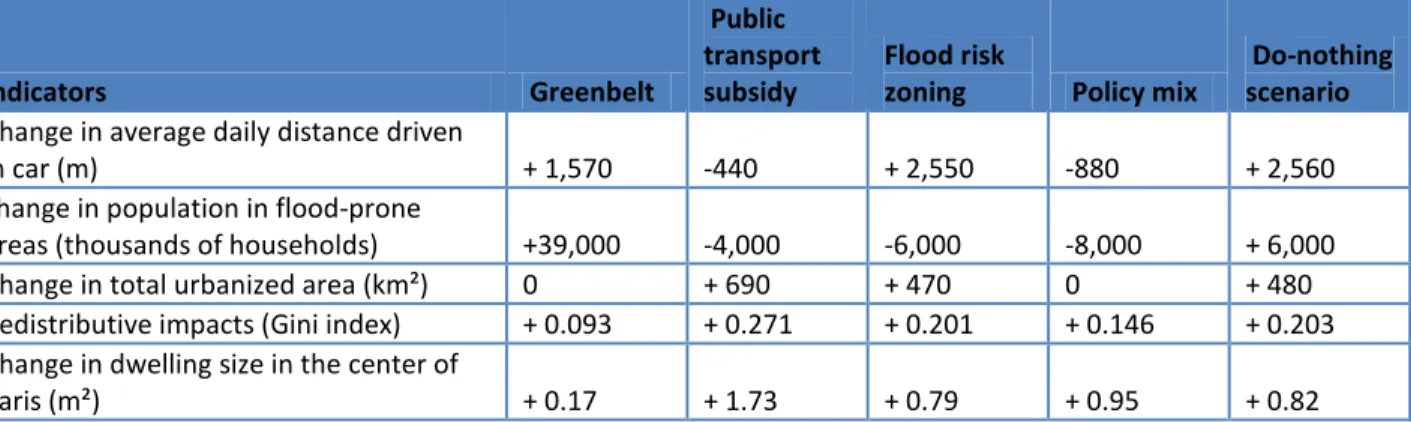
Table 1: Multicriteria analysis of urban policies on Paris in 2030 with respect to the five policy goals.
The first policy is a greenbelt policy whereby land use regulations prohibit building in areas that are not already densely inhabited. This policy aims at limiting urban sprawl and at protecting natural areas. With this policy, the urbanized area in 2030 is the same as in 2010, even though building and population densities are different. As table 1 shows, this policy also limits the increase in private vehicle usage, increases real estate prices, and reduces dwelling sizes by making land scarcer. This increased land scarcity leads more people to live in flood-prone areas, which has been empirically observed.12,13
The second policy is a public transport subsidy financed by a lump sum tax. We take the example of the recently proposed replacement of the differentiated public transport tariff— which increases with distance from the city center—by a single tariff for all destinations in the Paris urban area. Such a policy aims at promoting public transport, as well as decreasing the burden of transport costs on suburban households, which in Paris are, on average, poorer than those living in central Paris. The side effects of such a policy are to increase the incentive to live farther out in the suburbs, leading to an increase in the total urbanized area and to a decrease in real estate pressures in the city center.
The third policy is a zoning policy to reduce the risk of flooding. This policy prohibits new buildings in flood-prone areas. Such a policy reduces the available urban ground surface, thereby increasing land scarcity, and causes an increase in housing prices, leading to smaller dwelling sizes in the city center (as can be seen in Table 1).
Fig. 2 presents the results graphically for the three policies. The impact of each policy on each indicator has been assigned a score and is located along one of the five axes of the figure. The -100 percent score is in the middle of the figure; the +100 percent score is at the extremity of each axis. All scores are measured relative to the do-nothing scenario, which is assigned a 0 percent score. The +100 percent score goes to the preferred outcome among all considered policies.14 Each policy is thus ranked best when the corresponding colored area is biggest. For instance, Fig. 2 shows that a public transport subsidy improves the situation compared with the do-nothing scenario for three policy goals (climate change mitigation, housing affordability, and adaptation and disaster risk reduction), and makes it worse with respect to two policy goals (natural area and biodiversity protection and ease of implementation).
5
different policy goals when compared with the do-nothing scenario. Each policy thus appears to be undesirable because it has negative consequences with respect to at least one policy goal. This result can explain, for instance, why it is so difficult to implement efficient flood zoning or greenbelt policies at local scale, even when it is required by national law. 15 Indeed, negative side-effects on housing availability and on development opportunities understandably create political resistance.
Fig. 2. Consequences of a greenbelt policy, a public transport subsidy, and a zoning policy to reduce the risk of flooding compared with the do-nothing scenario. Axes orientation is such that directions towards the exterior of the radar plot represent positive outcomes.
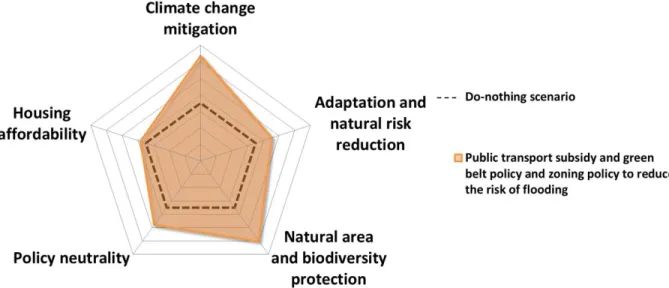
However, as Fig. 3 shows, a policy mix that includes the three policies can mitigate the adverse consequences of each individual policy. For instance, public transport subsidies decrease the real estate pressures caused by a greenbelt or a flood-zoning policy. Flood zoning also prevents the greenbelt from increasing the population at risk of floods. When all three policies are applied together, the situation is improved as measured along all policy goals compared with the do nothing scenario. In particular, these results suggest that flood zoning and greenbelt policies need to be combined with transportation policies to gain real political momentum and effectiveness.
6
Fig. 3. Consequences of a policy mix including all three policies. Axes orientation is such that directions towards the exterior of the radar plot represent positive outcomes.
Note that in a policy mix, the consequences of each policy are not simply additive. For instance, when all three policies are implemented, the decrease in population in flood-prone areas is smaller than the sum of the variation caused by each policy taken separately. This nonlinearity and the complexity of policy interactions explain why it is useful to analyze various urban policies together, in a consistent framework.
Our analysis shows that building win-win solutions by combining policies is possible, and leads to more efficient outcomes than a set of policies developed independently. Climate goals can thus be reached more efficiently, and with higher social acceptability, if they are implemented through their taking into account into existing strategic urban planning, rather than by creating new independent climate-specific plans. Such “mainstreaming” of climate objectives with other policy goals is found to help design better policies in our model, confirming previous findings in other domains.16-18
Obviously, it does not mean that win-win strategies are always available. In some cases, trade-offs will remain unavoidable, and urban decision-makers will need to make tough choices. This can be done by associating different weights to our indicators – through a process of stakeholder engagement – and by maximizing the resulting weighted sum of indicators. But our analysis shows that a mainstreamed approach can allow for the design of policies that are robust to differences in the weights of different indicators, since they improve all indicators. Such policies are particularly easy to implement, because they are more likely to appear desirable to all stakeholders, in spite of their different priorities, objectives, and world views.
METHODS
We use the NEDUM-2D model to simulate the evolution of the Paris urban area between 2010 and 2030. This model is an extension of the model described in previous papers,18,19 which is
7
based on classical economic theory.20–22 This theory explains the spatial distribution of land and real estate values, dwelling sizes, population density, and building height and density.
Our approach aims at bridging the gap between high complexity “land use-transport interaction” models,23 and theoretical urban-economics models. To do so, we propose a model that is fully based on “microeconomic foundations” describing economic agent behaviors (like theoretical models), but that can be calibrated on realistic transportation networks and include precise land-use regulations and natural land characteristics (e.g., rivers and other natural areas).
Two main mechanisms drive the model. First, households choose where they live and the size of their accommodation by assessing the trade-off between proximity to the city center and housing costs. Living close to the city center reduces transportation costs, but housing costs (per unit of area) are higher there. Theoretical extensions to account for decentralized production have been proposed, but are not included in this analysis. 24–26 Second, we assume that landowners combine land with capital to produce housing: they choose to build more or less housing (that is, larger or smaller buildings) at a specific location depending on local real estate prices and construction costs. We assume that households and landowners do not take into account flooding risk in their location and construction choices, as reflected by the current building rate in flood-prone areas in France,27 and as supported by behavioral economics research.28 Transportation costs include monetary costs such as the cost of gasoline and the cost of time. We assess them using the spatial structure of the Paris transportation networks (roads and public transport). See Section 3 of Supplementary Information for a full description of the model and its equations.
As described in sections 3.3 to 3.5 of Supplementary Information, a validation of the model over the 1960–2010 period shows that the model reproduces the available data on the city’s evolution fairly faithfully and captures its main determinants. It also reproduces the spatial distribution of dwelling size, population density, and rents in the urban area fairly well. These results suggest that this tool can be used to inform policy decisions.
The evolution of the Paris urban area depends on several external factors, including demographic, socioeconomic, cultural, and political changes (See Section 4 of Supplementary Information for a more precise description of the scenarios). Our conclusions are robust to changes in these values, as demonstrated by a sensitivity analysis (Section 5 of Supplementary Information).
The model can be used to test many different assumptions about the future development of transport infrastructure. For simplicity, we assume that it remains unchanged between 2010 and 2030 and that congestion on the roads and public transport remains constant, that is, we assume that future investments in the transportation network maintain the same level of service despite population growth (Section 4 of Supplementary Information).
1. Rosenzweig, C., Solecki, W., Hammer, S.A. & Mehrotra, S. Cities lead the way in climate-change action. Nature 467, 909–911 (2010).
2. Dodman, D. Blaming cities for climate change? An analysis of urban greenhouse gas emissions inventories. Environment and Urbanization 21, 185-201 (2009).
8
3. Hoornweg, D., Sugar, L. & Trejos Gomez, C.L. Cities and greenhouse gas emissions: moving forward. Environment and Urbanization 23, 1-21 (2011).
4. Dawson, R.J. et al. A blueprint for the integrated assessment of climate change in cities. (Tyndall Centre for Climate Change Research: 2007).
5. Revi, A. Climate change risk: an adaptation and mitigation agenda for Indian cities.
Environment and Urbanization 20, 207 (2008).
6. Hallegatte, S. & Corfee-Morlot, J. Understanding climate change impacts, vulnerability and adaptation at city scale: an introduction. Climatic Change 104, 1-12 (2010).
7. McEvoy, D., Lindley, S. & Handley, J. Adaptation and mitigation in urban areas: synergies and conflicts. Municipal Engineer 159, 185–191 (2006).
8. Hamin, E.M. & Gurran, N. Urban form and climate change: Balancing adaptation and mitigation in the U.S. and Australia. Habitat International 33, 238-245 (2009).
9. For an example, see Solecki, W.D. & Oliveri, C. Downscaling climate change scenarios in an urban land use change model. Journal of environmental management 72, 105–115 (2004).
10. Corfee-Morlot, J. et al. Cities, climate change and multilevel governance. OECD
Environment Working Papers 14, (2009).
11. An increase in average dwelling size can lead to an increase in residential GHG emissions, and this effect could be taken into account in our indicator for “climate change mitigation.” In this analysis, however, we did not include this effect, because it is mainly influenced by building norms and heating system regulations, much more than by the urban planning policies that are considered here. Ewing, R. & Rong, F. The impact of urban form on US residential energy use. Housing Policy Debate 19, 1–30 (2008)
12. Burby, R.J., Nelson, A.C., Parker, D. & Handmer, J. Urban Containment Policy and Exposure to Natural Hazards: Is There a Connection? Journal of Environmental Planning
and Management 44, 475–490 (2001).
13. Lall, S.V. & Deichmann, U. Density and Disasters. World Bank Research Working papers 1, 1–48 (2010).
14. Preferred outcome are a decrease in average distance traveled by car, in population living in flood-prone areas, in total urbanized area, in spatial Gini index, and an increase in average dwelling size.
15. Burby, R.J. Flood insurance and floodplain management: the US experience.
Environmental Hazards 3, 111–122 (2001).
16. Klein, R.J.T., Schipper, E.L.F. & Dessai, S. Integrating mitigation and adaptation into climate and development policy: three research questions. Environmental Science &
Policy 8, 579–588 (2005).
17. Füssel, H.M. Adaptation planning for climate change: concepts, assessment approaches, and key lessons. Sustainability Science 2, 265–275 (2007).
9
18. Kok, M. & De Coninck, H. Widening the scope of policies to address climate change: directions for mainstreaming. Environmental Science & Policy 10, 587–599 (2007).
19. Gusdorf, F. & Hallegatte, S. Behaviors and housing inertia are key factors in determining the consequences of a shock in transportation costs. Energy Policy 35, 3483-3495 (2007). 20. Gusdorf, F., Hallegatte, S. & Lahellec, A. Time and space matter: How urban transitions
create inequality. Global Environmental Change 18, 708-719 (2008).
21. Alonso, W. Location and land use: toward a general theory of land rent. (Harvard University Press: Cambridge, MA, 1964).
22. Muth, R.F. Cities and Housing; the Spatial Pattern of Urban Residential Land Use. (University of Chicago Press: Chicago, 1969).
23. Mills, E.S. An Aggregative Model of Resource Allocation in a Metropolitan Area. The
American Economic Review 57, 197-210 (1967).
24. Iacono, M., Levinson, D. & El-Geneidy, A. Models of transportation and land use change: a guide to the territory. Journal of Planning Literature 22, 323-340, (2008).
25. Brueckner, J.K. Urban General Equilibrium Models with Non‐central Production. Journal
of Regional Science 18, 203-215 (1978).
26. Anas, A., & Kim. I. General equilibrium models of polycentric urban land use with endogenous congestion and job agglomeration. Journal of Urban Economics 40, 232-256 (1996).
27. Giuliano, G. Land Use Impacts, of Transportation Investments in The geography of urban
transportation (2004).
28. Laporte, V. Croissance du nombre de logements en zones inondables. Ministère du
Développement durable. CGDD : Le Point sur (2009)
29. Camerer, C. and H. Kunreuther, 1989. Decision processes for low probability events: policy implications. Journal of Policy Analysis and Management, 8, 565-592.
Supplementary Information is linked to the online version of the paper at www.nature.com/nature.
Acknowledgements This study benefited from funding by the Agence Nationale de la Rercherche through the projects “Vulnérabilité Urbaine aux épisodes Caniculaires et stratégies d’Adaptation” (VURCA) (ANR-08-VULN-013) and “Modélisation Urbaine et Stratégies d’adaptation au Changement climatique pour Anticiper la Demande et la production Energétique” (MUSCADE) (ANR-09-VILL-0003-01) projects. The authors are grateful to Didier Rouchaud, Alain Sauvant, Jean-Luc Salagnac, and Nicolas Coulombel for providing invaluable data. Tony Bigio, Jan Corfee-Morlot, Marianne Fay, Elisabetta Genovese, Louis-Gaetan Giraudet, and Paolo Avner provided helpful comments. The findings, interpretations, and conclusions expressed in this paper are entirely those of the authors. They do not necessarily represent the views of the International Bank for Reconstruction and Development/World Bank and its
10
affiliated organizations or those of the executive directors of the World Bank or the governments they represent.
Author Contributions V.V. carried out the computational analysis. S.H. initiated the study. S.H. and V.V. continued and finalized its design. They both wrote the paper.
Author Information Reprints and permissions information is available at
www.nature.com/reprints. The authors declare no competing financial interests. Readers are welcome to comment on the online version of this article at www.nature.com/nature. Correspondence and requests for materials should be addressed to V.V. ( [email protected]).